Table of Contents
QUICK SUMMARY:
Creating a comprehensive Facebook report is essential for delivering value and helping clients understand their results. By sharing this data, agencies will be better positioned to build trust and foster long-term client relationships. This article explores the key elements of a well-crafted Facebook report, including the various types of metrics, common reporting hurdles, and best practices.
Feels good to cross things off your to-do list, right?
Create a design for that client’s Facebook Ad: Check. Monitor user engagement: Check. You're cruising through these campaigns when suddenly… it’s time to analyze the data.
Even if you know these campaigns inside out, there’s another key part of the puzzle: Communicating results to clients.
Easier said than done. For starters, it may be tricky to decide on which metrics to track. There’s engagement rate, conversions, leads–you name it. Plus, there’s the challenge of getting your message across in a succinct but impactful way. After all, clients are busy and don’t have time to sift through mounds of data or hard-to-look-at spreadsheets.
That’s where a well-crafted Facebook report comes in. It’s a way to share campaign results, give recommendations, and demonstrate your agency’s value.
In this article, we’ll explore how to create one, along with popular data types, reporting best practices, and the importance of an automated solution.
What Makes a Great Facebook Report?
To put it simply, an exceptional Facebook report goes beyond basic insights.
Think about it–clients can easily check their feeds, track follower counts, and see which posts garnered the most likes, all on their own. So, to really stand out, your agency must go beyond the obvious and create a solid value proposition.
For example, clients may have questions like:
"What type of Facebook post generates the most user engagement?"
"Are our Facebook Ads reaching the intended audience?"
"What about device usage? Do potential customers typically access Facebook on this browser?"
"How effective are Facebook campaigns in achieving our overall marketing goals?"
They’re all reasonable inquiries. Aside from regular 1:1 discussions, a well-crafted Facebook report is the way to communicate these insights. Essentially, it’s a must-have for sharing data analysis, uncovering trends, and demonstrating tangible ROI.
So, how exactly do you take a Facebook report from average to extraordinary? Here are a few reporting best practices.
Reporting Best Practice | Description |
|---|---|
Understand Client Goals | Align each Facebook report with the client’s specific objectives (such as brand awareness, lead generation, or engagement). |
Ensure There’s Clarity | Instead of using marketing jargon or sharing complex insights, focus on simplicity. Use clear language, intuitive visuals, and more context where necessary (e.g., including a detailed explanation of ROAS when reporting on Facebook Ad results). |
Use a Consistent but Personalized Format | Maintain a consistent format for each report, which sets a standard and adds a familiar structure. Also, infuse personalization to ensure brand recognition at each touchpoint (e.g., add your logo and unique brand colors). |
Highlight Key Takeaways | Include an executive summary at the start of each Facebook report. This approach allows busy decision-makers to quickly understand key points without getting bogged down by details. |
Remember–presentation matters. Taking the time to customize your client’s Facebook report often leads to greater client satisfaction and retention in the long run.
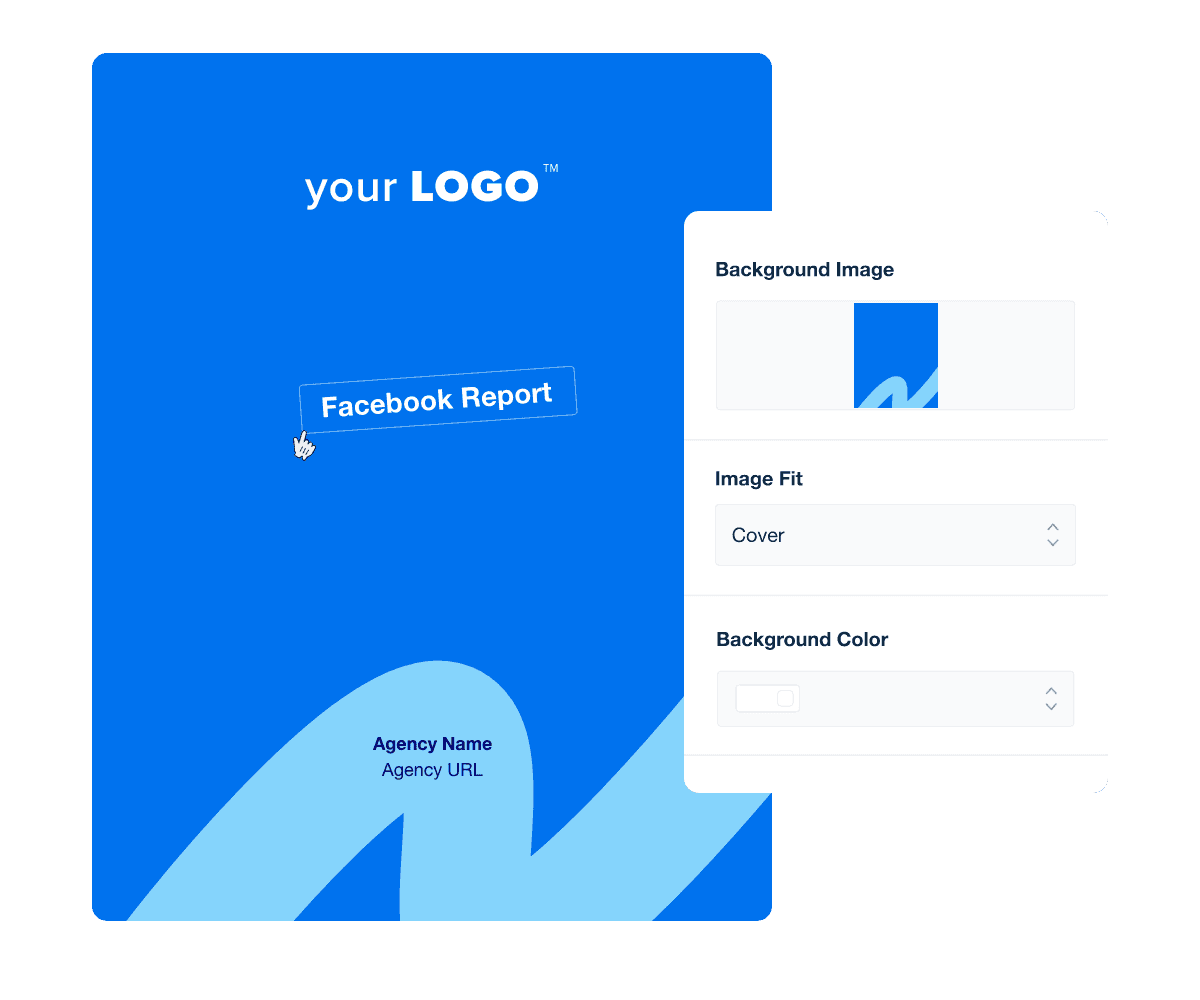
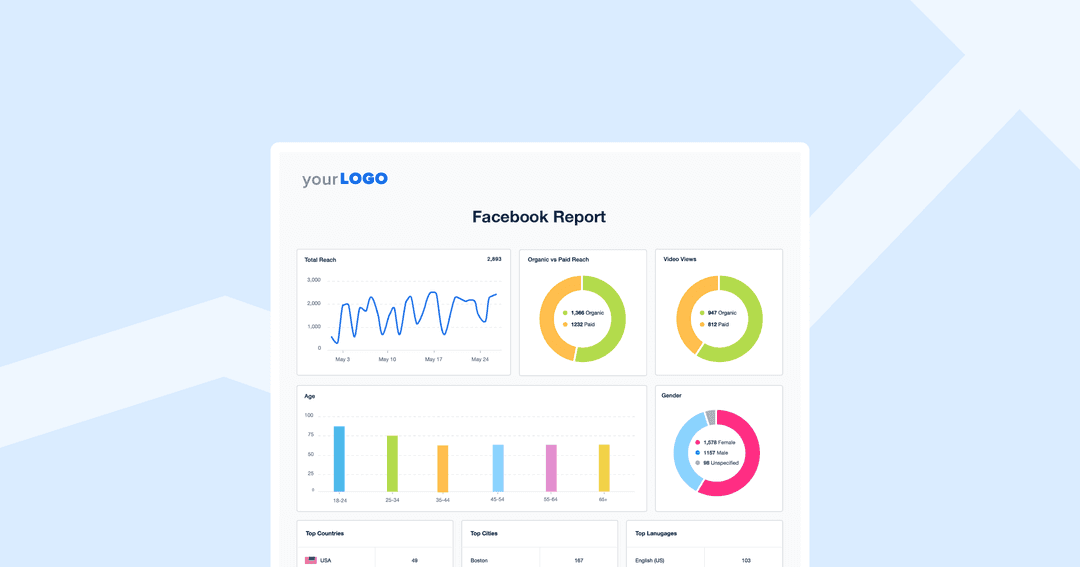
Create marketing reports as unique as your clients. Add a custom cover page, leave comments, and toggle with data visualizations for any ad set–try AgencyAnalytics today, free for 14 days.
Types of Data To Include in a Facebook Report
Now that we’ve touched on the importance of reporting, you may be wondering, “What exactly should I include?”
To help guide this decision, let’s explore some common Facebook metrics and what they mean.
Likes: Likes are an indicator of basic audience engagement—they show that your client’s content resonates in some way.
Shares: This metric measures how often users share your client’s Facebook Ad or post. A significant number of shares extends organic reach, boosts content visibility, and builds brand awareness.
Reach: This number reflects the number of unique users who have seen your client’s Facebook Ad. Essentially, it shows the extent of audience exposure.
Engagement Rate: This metric measures the percentage of users who interacted with your client’s Facebook Ad or post compared to the total reach. A high engagement rate is a good indicator of content relevance.
Clicks: Clicks show piqued user interest and may also lead to more concrete actions (e.g., completing an online sale).
Demographics: An overview of audience characteristics (e.g., age, gender, and location) means knowing exactly who interacted with your client’s Facebook content. This data may also reveal new market segments.
Amount Spent: This figure refers to the total amount spent on your client’s Facebook Ad strategy. Monitor this number to ensure their budget remains on track.
Cost-Per-Click (CPC): CPC is the amount your client pays each time a user clicks on a Facebook PPC ad. A lower CPC indicates better cost-effectiveness and may yield greater campaign profitability.
Click-through Rate (CTR): CTR refers to the percentage of users who clicked on your client’s Facebook Ad after viewing it. This metric shows how well their ad attracts attention and user interest.
Leads Generated: This number collates how many users submitted their contact information via a submission form within your client’s ad. While a high number of leads may seem promising, keep an eye on quality.
Add-to-Cart Rate: If your client runs ecommerce ads on Facebook, monitor their add-to-cart rate. It shows how many times users put products in their shopping carts, which is a sign of conversion intent.
Return on Ad Spend (ROAS): ROAS measures the revenue generated for every dollar spent on advertising. A higher ROAS means their campaign was profitable and effective.
Conversions: Conversions refer to the actions users have taken after interacting with your client’s ad (e.g., purchases, sign-ups, or app installs). It shows the ad’s effectiveness in driving desired outcomes.
Common Challenges When Creating Facebook Reports (And How To Overcome Them)
Reporting may seem daunting at times; we get it. Thankfully, there are a few ways to ease the burden.
Here’s a breakdown of common reporting roadblocks, along with tips for navigating them effectively.
Challenge | Fix |
|---|---|
Data Overload | Facebook provides a wealth of data, which may be overwhelming to sift through. Instead of reporting on everything, focus on key metrics that align with your client’s campaign objectives. |
Lack of Context | To provide sufficient context, include qualitative insights or annotations in all Facebook reports. Also, mention any external factors that could affect campaign performance. For example, explain the effect of cookies and similar technologies. |
Accurate Conversion Attribution | After a user views your client’s Facebook Ad, they may perform an action outside of the platform (e.g., visiting your client’s website). To ensure this vital data is captured, connect Facebook Ads to Google Analytics. That way, you’ll be better equipped to make accurate conversion attributions. |
Report Creation for Paid and Organic Efforts
| If your client is running both paid and organic Facebook efforts, it may be challenging to create a cohesive report. Instead of relying on screenshots or manual data compilation, use a pre-built Facebook report template. |
Aside from the hassle of outdated reporting methods, there’s another thing to consider: You’ve got multiple clients on your roster.
When the reporting period rolls around–like it always does–you’ll need a system to streamline this entire process. Otherwise, there’s the risk of human error, wasted billable time, and inaccurate recommendations.
The solution? Investing in a tool like AgencyAnalytics. It’s a way to automate data retrieval and consolidate metrics from 80+ marketing platforms.
Accurate client reporting is a great way to show customers that your work is making a difference. It's also useful when all of the marketing data is centralized in one place, which leads to greater client satisfaction.
Ryon Gross, CEO, Local Leap Marketing
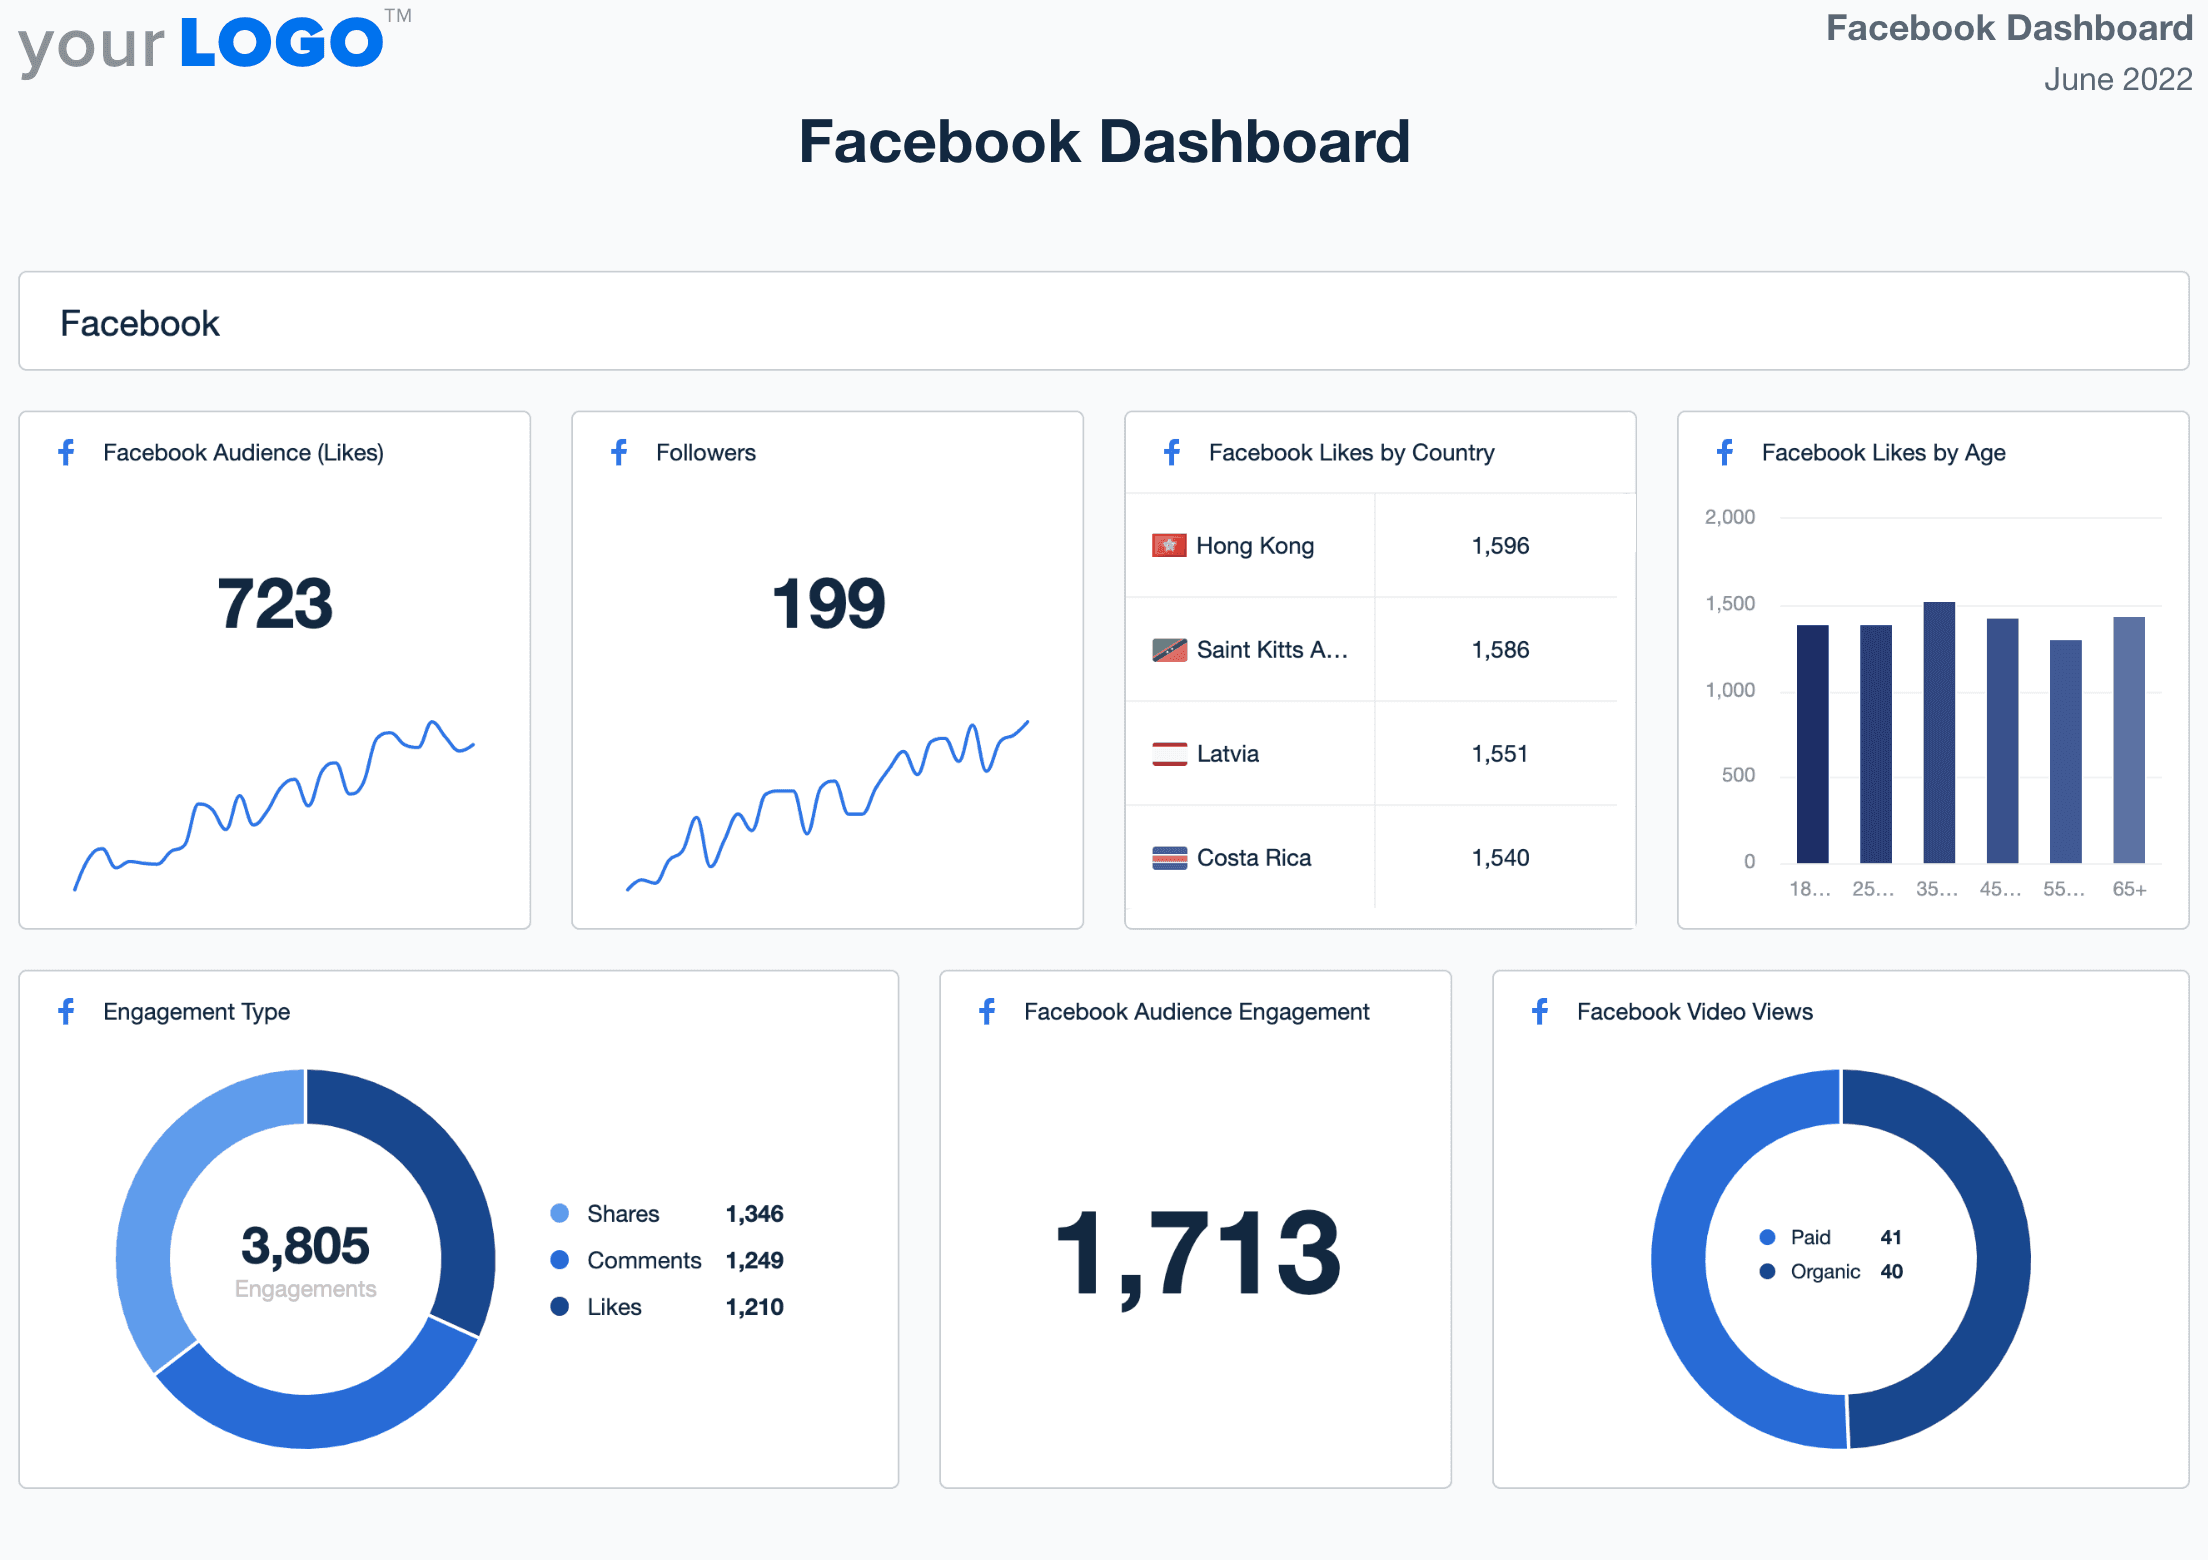
Invest in a reporting system that grows with your agency. Access data insights from multiple client campaigns in one place–explore AgencyAnalytics, it’s free for 14 days.
7 Best Practices for Delivering Outstanding Facebook Reports
There’s power in repeatable processes. To consistently create impactful Facebook reports, incorporate these practices into your routine.
1. Understand Your Client’s Objectives Upfront
First things first–what does your client want to achieve?
To get this key information, have a conversation with your client beforehand. For added context, here are some common Facebook goals and examples.
Goal | Description | Example |
|---|---|---|
Brand Awareness | Increase the visibility and recognition of the client's brand among a particular audience on Facebook. | A client with a local bakery wants to boost brand visibility and be known for vegan desserts. Their target market is health-conscious Facebook users within a 1-mile radius. |
Traffic | Drive Facebook users to your client’s website or landing page. | Your agency creates a Facebook Ad campaign that links to a separate landing page. This way, potential customers are able to view the dessert menu and place online orders. |
Engagement | Boost interaction with your client’s Facebook content (e.g., likes, comments, shares, and reactions). | Your client runs an online contest where followers can win a free dessert by commenting on a post. |
Lead Generation | Capture contact information for potential leads by embedding a form into Facebook posts or ads. | This client wants to increase email sign-ups via a Facebook lead gen form. To do so, they’re offering a free dessert coupon after users submit their contact information. |
Conversions | Drive specific actions (e.g., purchases, form completions) on your client’s website via Facebook Ads. | To boost sales, your agency creates a promotion where first-time buyers receive a discount on vegan desserts. |
2. Focus on Tracking Facebook Metrics That Align With These Goals
Next, it’s time to decide on Facebook metrics that align with your client’s chosen goal.
To do so, take your client’s goal and translate it into a quantifiable OKR or KPI. In other words, create a target that’s relevant and easy to measure. Consider the following examples:
Brand Awareness: Reach 1000 new users per quarter through a Facebook Ad with a brand awareness goal.
Traffic: Get 500 website clicks each month from your client’s organic Facebook posts.
Engagement: Boost your client’s Facebook engagement rate from 5% to 8% in the next month.
Lead Generation: Generate 100 leads bi-weekly from your client’s Facebook lead gen forms.
Conversions: Achieve 1000 app installs per quarter via a Facebook Ad campaign.
After deciding on a target, use the goal-tracking feature in AgencyAnalytics to visualize progress and monitor traction. That way, your client will know whether their campaigns are on the right track.
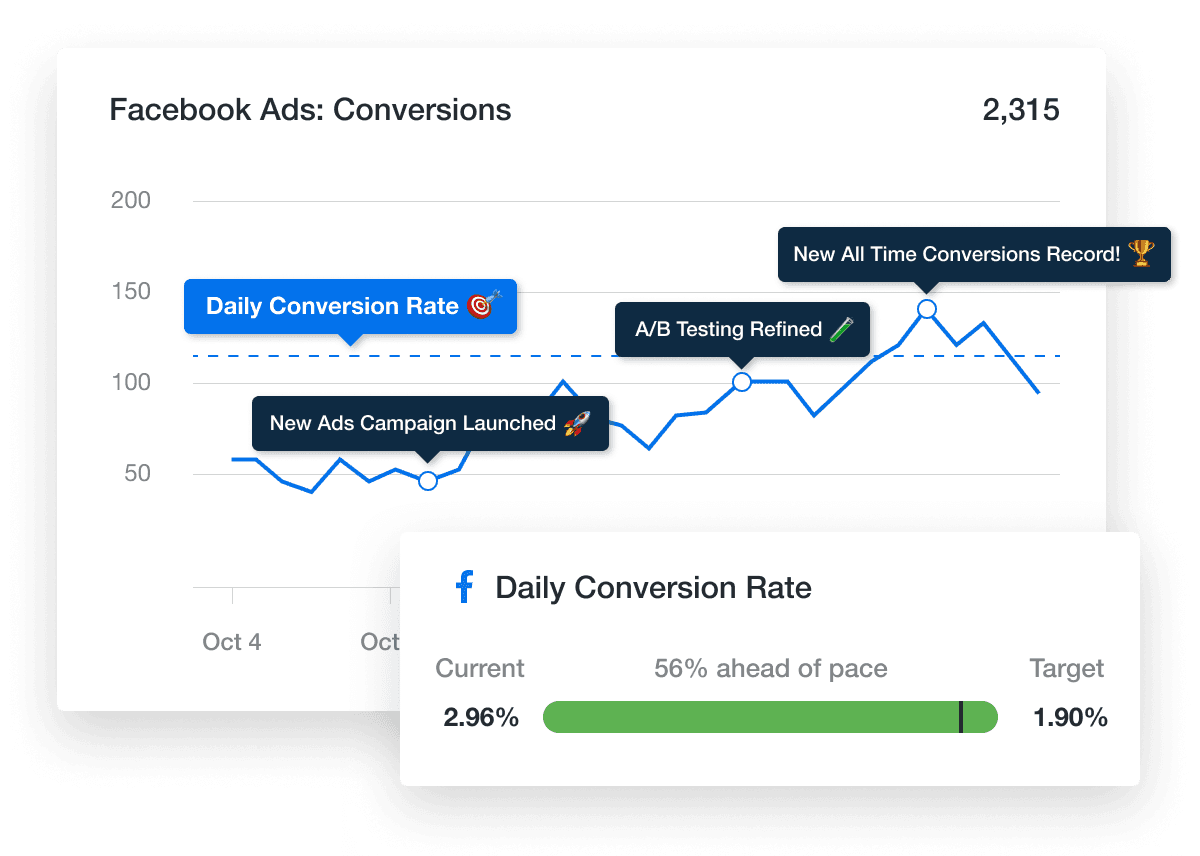
No need to manually log into Facebook Ads Manager. Use AgencyAnalytics to show you ads performance, create dynamic goals, and keep clients informed. Sign up for a free 14-day trial today!
Agency Tip: Ensure your clients know of any regulations or developments that could affect their goals. For example, consider cookies by Facebook. Because users have the option to decline optional cookies, this may affect the reach of retargeting campaigns. Controlling cookies with browser settings could also lead to variable results. While some things are out of your control, still report on campaign progress and remain transparent.
3. Create a Report That Reflects These Insights
After running your client’s Facebook campaigns, it’s time to report on the results. With AgencyAnalytics, you’ve got options:
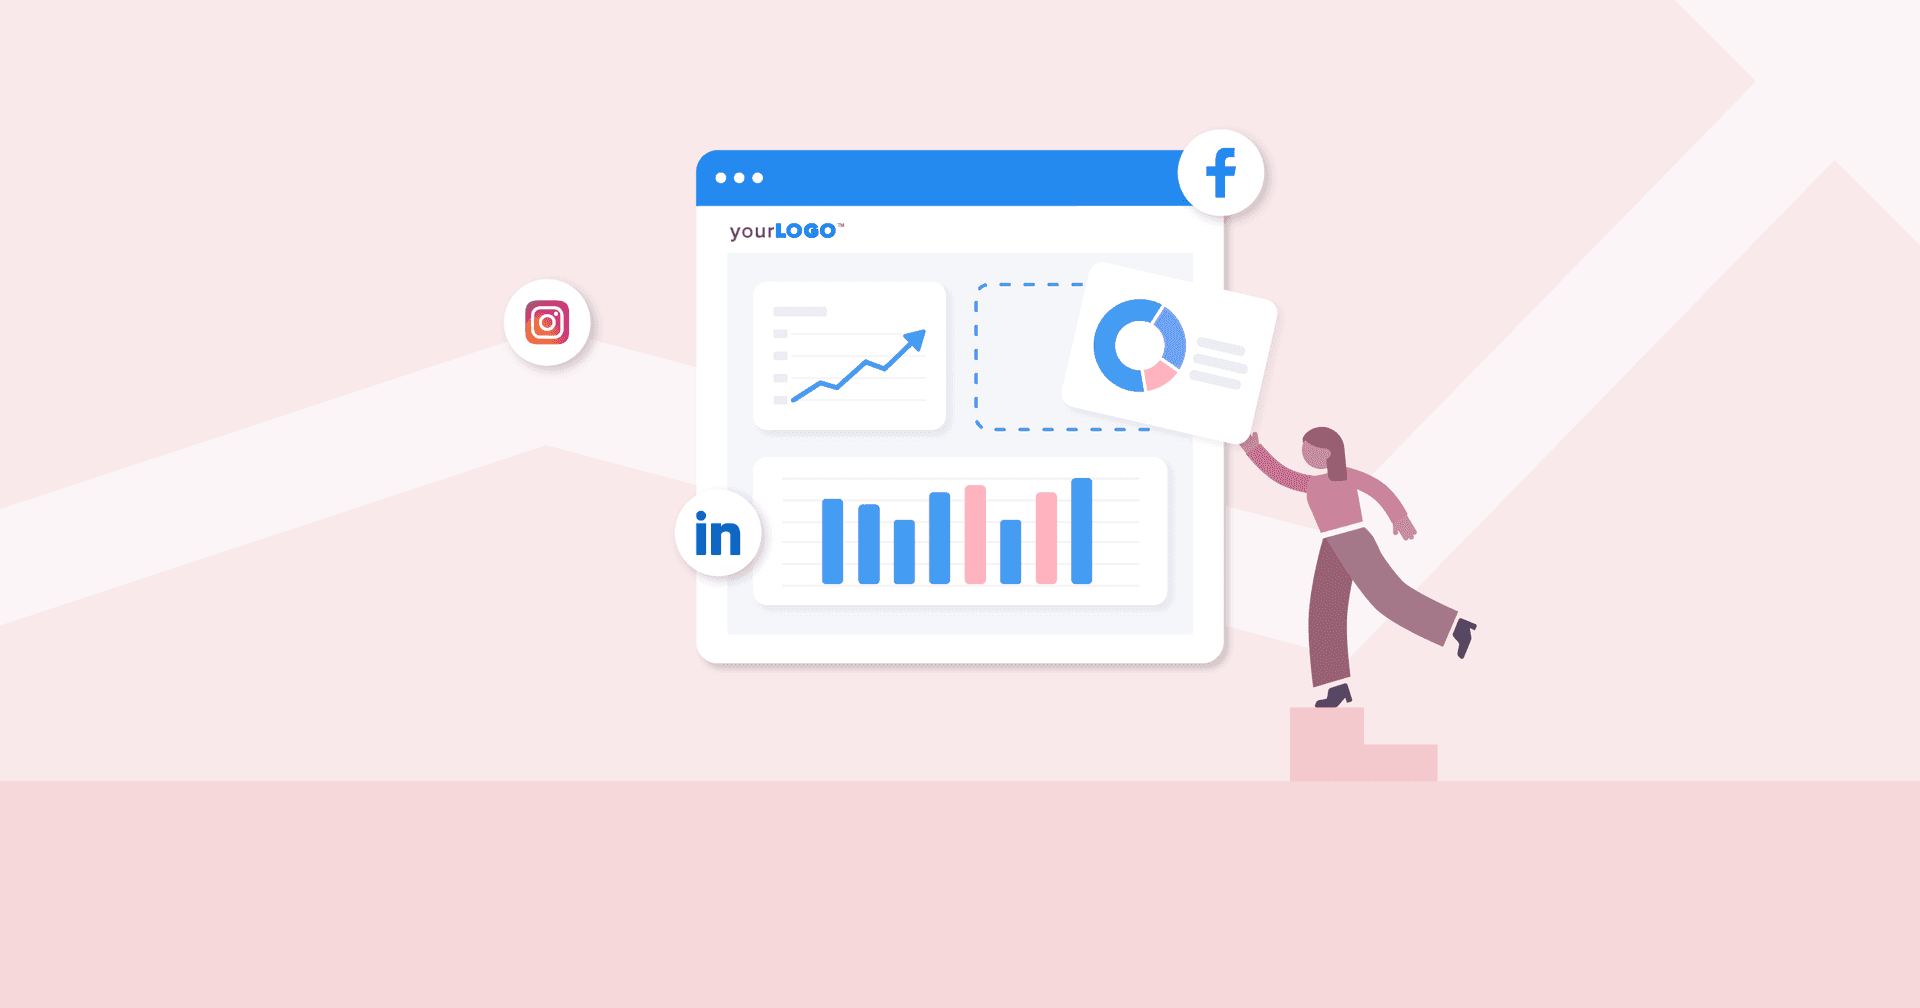
Build a Custom Report With the Drag and Drop Feature: With a few clicks, shift widgets and arrange your client’s Facebook report as needed.
Utilize the White-Label Feature: To start things off right, create a fully customizable and replicable cover page. Then, incorporate your unique brand colors and even swap the background image for extra pizzazz!
Use a Pre-Built Facebook Report Template: If you’re not in the mood to start from scratch, no worries! This handy template simplifies the entire report prep process, saving you valuable time.
Create a Smart Report in just 11 seconds: If your client is running other marketing campaigns, the Smart Report option may be your best bet. Connect their integrations in AgencyAnalytics and watch those insights auto-populate into a professional report. It’s that simple!
4. Make Data Visualizations the Primary Focus
An eyesore of numbers? That’s not exactly fun.
Bring your client’s data to life through visualizations. It’s the best way to tell a story, uncover trends, and get your point across.
Focus on creating reports that are clear, concise, and actionable. This means using data visualization tools like charts, graphs, and tables to help clients quickly and easily understand the performance of their campaigns. It also means providing context and explanations for the data presented, so clients can understand what it all means and how it relates to their business goals.
Daniel Dye, President, Native Rank
If the default graph doesn't quite meet your needs, try experimenting with different formats. We even provide features like maps, bar graphs, and pie charts–whatever works for your agency.
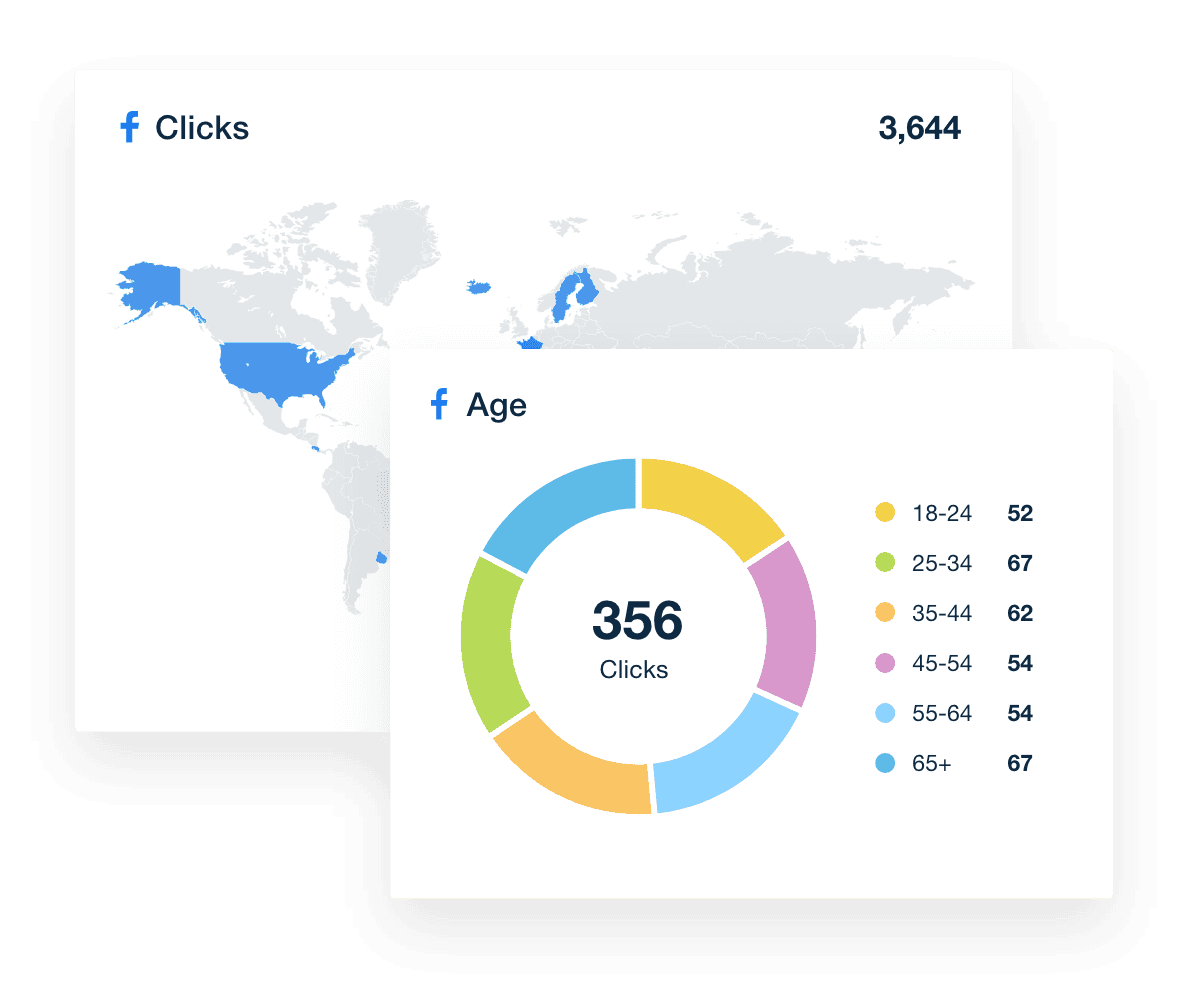
Facebook Ad reporting has never been easier. Report on audience insights, manage your ad experience, and explore a range of data visualizations–it’s that simple with AgencyAnalytics. Sign up for a free 14-day trial today.
5. Decide on an Appropriate Reporting Frequency
Wondering how often your agency should deliver Facebook reports?
According to the results of our last Agency Benchmarks Survey, most agencies deliver reports on a monthly basis.
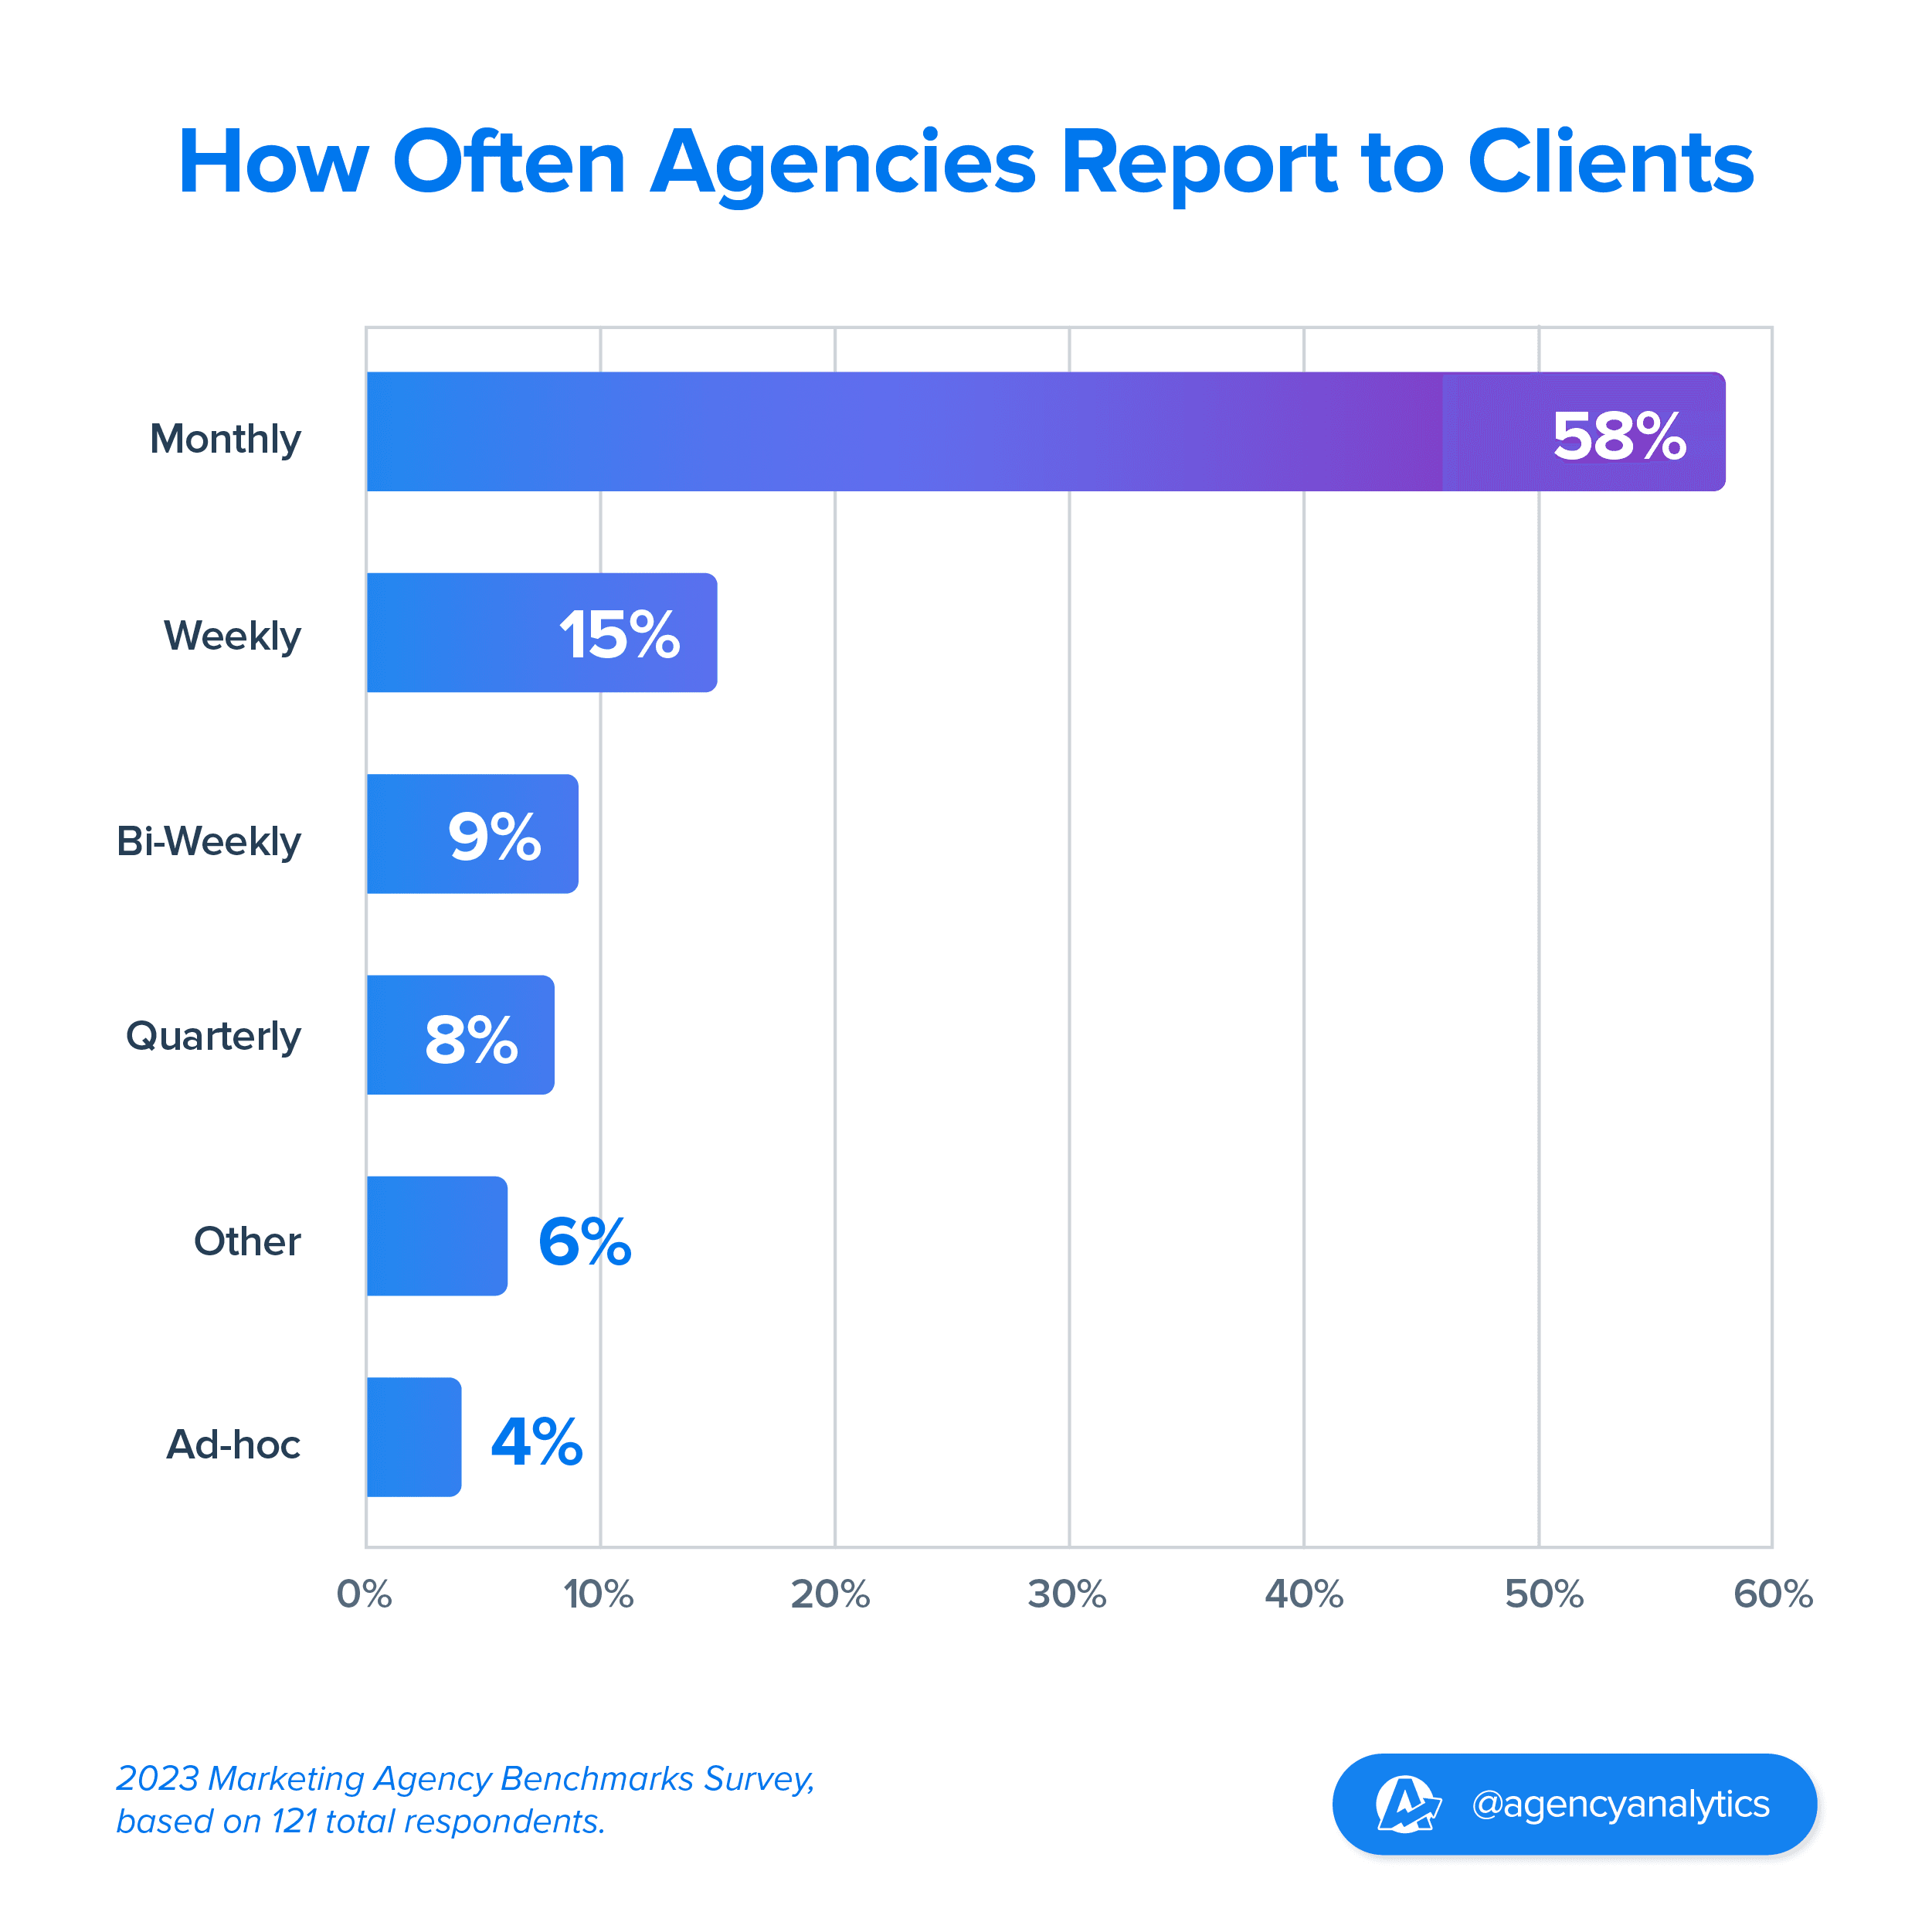
Why might that be? It’s just enough time to keep clients in the loop and allow campaigns to materialize.
A monthly reporting cadence provides a consistent touch-point with the client while reducing hours spent analyzing and giving feedback on the data in reports. This allows for the majority of client billable time to be spent doing the work rather than reporting on it.
Lorianna Sprague, Vice President of Marketing, Trusted Search Marketing
That said, reporting frequency will vary based on a few things. Consider the following:
Campaign Type and Duration: Short-term efforts (e.g., product launches or seasonal Facebook Ad campaigns) may require weekly or bi-weekly reporting.
Ad Spend and Budget Management: If your client has a significant budget, they may prefer a more frequent reporting cadence to understand their ad metrics.
Client Expectations: Some clients simply want to be looped in more regularly, especially if they’re heavily invested in the outcomes (e.g., a high-stakes Facebook Ad strategy). Alternatively, other clients could be comfortable with a standard once-a-month report.
Whatever the case, decide on this beforehand and ensure your client knows what to expect.
6. Consider Granting Clients Live Dashboard Access
What if there was a way to keep clients informed 24/7? There is!
With dashboard login profiles, your clients will have on-demand access to their marketing metrics. This will provide data transparency, ensuring clients know what’s happening with their Facebook campaigns.
We want to be totally transparent with our clients. AgencyAnalytics allows us to provide our clients with a live dashboard where they can have full insight into what we're doing. It also means we don’t need to give full access to the ad platforms where they would have the potential to interfere with performance.
Michael Wisby, CEO, Two Trees PPC
Worried about sharing too much? Set user permissions to control exactly what’s shared.
This approach also ensures that clients don’t have to manually log into their Facebook accounts to monitor data insights. You never know–they could inadvertently click an ad configuration or cause a campaign disruption.
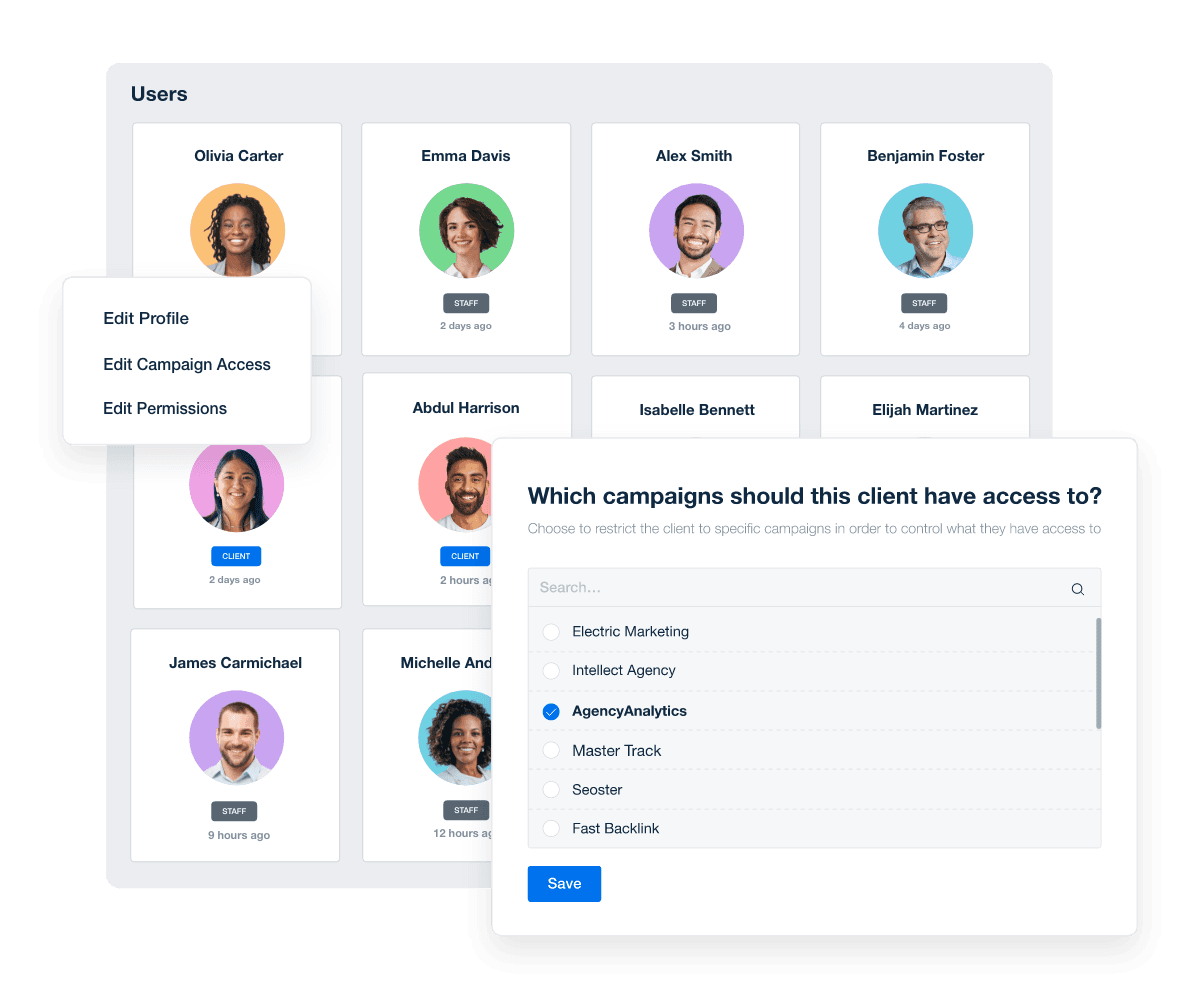
Invest in a Reporting System That Evolves With Your Agency
While some best practices should always be implemented (like focusing on comprehensive tracking and reporting), it’s important to remain flexible.
Investing in a platform like AgencyAnalytics provides just that… and then some. From pre-built report templates to live visual dashboards, it’s a must-have tool that maximizes your valuable billable time.
The best part? It’s not just built for Facebook reporting. Easily consolidate insights from 80+ marketing platforms into a single, unified interface. Despite the influence of external factors (like cookies from other companies), having live data at your fingertips is the best way to identify trends and communicate results.
Paint the bigger marketing picture and deliver solid ROI–explore AgencyAnalytics by signing up for a free 14-day trial today.
What I liked most about this software is the fact that it is an all-in-one website tool. I’m able to easily track keyword rankings, and check Google Analytics and Facebook insights, all in one place. This tool is very helpful, and I highly recommend it.

Click Sprout Media
Impress clients and save hours with custom, automated reporting.
Join 7,000+ agencies that create reports in under 30 minutes per client using AgencyAnalytics. Get started for free. No credit card required.
Already have an account?
Log in

Written by
Faryal Khan is a multidisciplinary creative with 10+ years of experience in marketing and communications. Drawing on her background in statistics and psychology, she fuses storytelling with data to craft narratives that both inform and inspire.
Read more posts by Faryal KhanSee how 7,000+ marketing agencies help clients win
Free 14-day trial. No credit card required.


