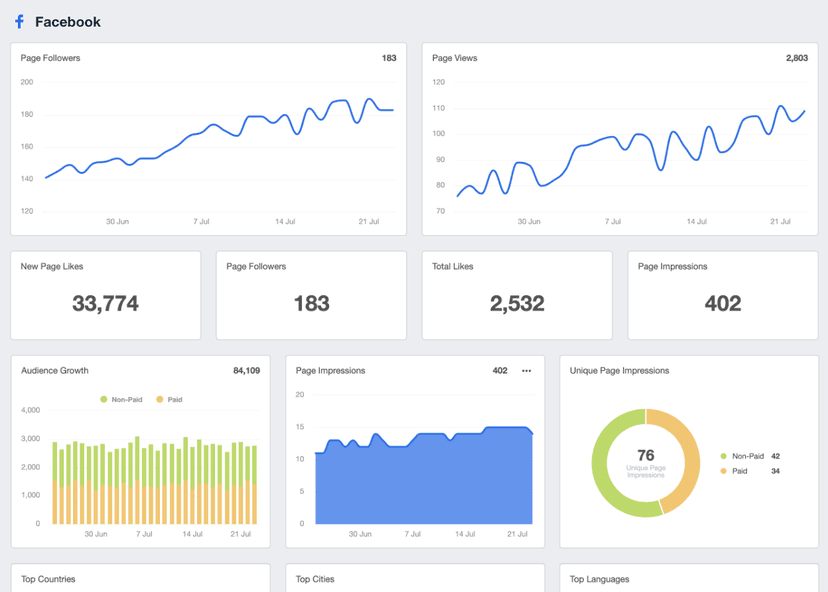
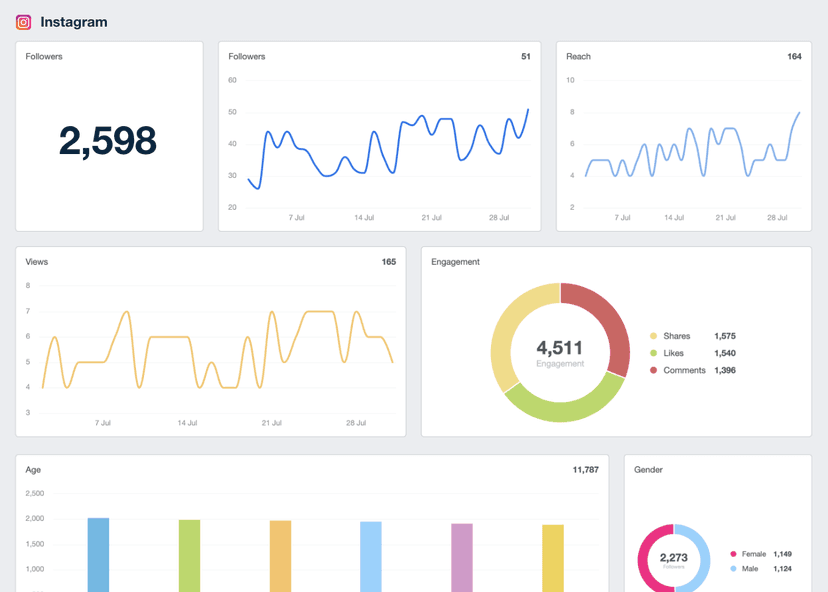
1-Day Active Users
Traffic Trends
Identify daily traffic patterns and peaks in user engagement to aid content optimization.
Engagement Analysis
Gauge user engagement levels to refine targeting and analyze user behavior.
Content Impact
Assess the impact of specific content or campaigns to understand what resonates most.
Trend Analysis
Identify trends in user engagement over time and pinpoint days with peak activity.
Why 1-Day Active Users Are Important
Measuring 1-Day Active Users is like having a daily headcount in a store. On busy days, a store sees more customers, mirroring peak online user engagement. Quieter days with fewer visitors reflect lower online activity. This metric gauges daily engagement, much like a store owner tracks foot traffic to understand customer interest. A consistent or growing number of active users indicates strong user interest and engagement. Conversely, a decline signals issues that may need prompt attention (e.g., improving website usability). This metric is an indispensable tool for ongoing optimization and strategy refinement.

Stop Wasting Time on Manual Reports... Get Insights Faster With AgencyAnalytics
How 1-Day Active Users Relate To Other KPIs
1-Day Active Users is closely tied to several other KPIs, offering a multifaceted view of marketing performance. For instance, it directly correlates with Conversion Rate, as more active users often lead to more Conversions. Analyzing these two metrics together provides insights into how engagement translates into desired actions.
Comparing 1-Day Active Users with user retention rates helps determine if strategies attract new users or keep existing ones engaged better. Additionally, 1-Day Active Users often lead to longer Session Durations and more Page Views. That’s because increased engagement usually means more time spent and interactions on a website.
How To Calculate the Number of 1-Day Active Users
To collate 1-Day Active Users, count the unique users who engage with a website or app within a 24-hour period. This metric counts unique users based on their interactions, like visits and other events or actions. Each user is counted only once per day, regardless of multiple engagements, ensuring an accurate tally of individual user activity.
What Is a Good Number of 1-Day Active Users?
There's no one-size-fits-all number for good 1-Day Active Users. It depends on several factors, such as business size, industry, target audience, and historical performance data. For a small, niche business, a few hundred active users might be excellent. Conversely, a large eCommerce site may have thousands or even millions of daily users.
If this number is growing or meeting specific targets, it's generally considered good. Also, consider the context–a spike in active users during a marketing campaign is a positive indicator of effective engagement strategies.
What Is a Bad Number of 1-Day Active Users?
A bad average for 1-Day Active Users indicates low engagement and potentially diminishing interest in a product or service. However, context is also important here.
For example, a website may historically average several thousand daily users. A sudden drop to a few hundred users could be a cause for concern. Similarly, if competitors or industry norms are significantly higher, this may indicate underperformance.
A low count isn't always negative for a small business with a limited audience. However, a consistent decline or numbers far below historical averages typically means improvements are needed.
How To Set Goals and Benchmarks for 1-Day Active Users
Establish tailored benchmarks for 1-Day Active Users by considering business outcomes such as revenue or Customer Acquisition Costs.
In addition, analyze historical data and make correlations with other metrics (e.g., Session Duration, Conversion Rates) for more in-depth insights. Considering daily or weekly user activity patterns also helps to optimize campaigns and time content releases.
Why 1-Day Active Users Matter to Clients
For clients, 1-Day Active Users is a crucial indicator of immediate customer engagement and interest. It provides instant feedback on the appeal of products or services to their target audience.
A substantial number of daily active users suggests that the website is engaging and marketing strategies are effective. It's also essential for evaluating the impact of products or new feature launches, as it offers actionable insights for business growth.

Why 1-Day Active Users Matter to Agencies
This metric helps agencies quantify the reach and effectiveness of their strategies in real time, enabling them to make swift optimizations.
High daily engagement often translates to successful content or campaign resonance. Agencies then use this data to demonstrate how their efforts drive engagement and interest. This metric also provides valuable insights into user behavior, which is crucial for future targeted campaigns.

Report smarter for your clients with just a click.
Best Practices for Analyzing and Reporting on 1-Day Active Users
A thorough analysis of 1-Day Active Users is essential for optimizing advertising campaigns. Here are the top reporting tips to communicate these insights effectively.
Correlate With Other Metrics
Report 1-Day Active Users alongside related metrics like Conversion Rates, Session Duration, or Bounce Rates to provide a more comprehensive view of user engagement.
Use Segmentation
Break down 1-Day Active Users by different demographics, channels, or behaviors to understand the most engaged segments.
Highlight Anomalies
Identify and explain any unexpected spikes/dips in the data. This provides more context about unusual user behavior or the impact of external factors.
Report Consistently
Regularly report on 1-Day Active Users (e.g., weekly, monthly) to align with campaign schedules and pinpoint trends.
Compare Across Channels
Evaluate 1-Day Active Users across platforms to identify the most effective channels and guide resource allocation.
Visual Representation
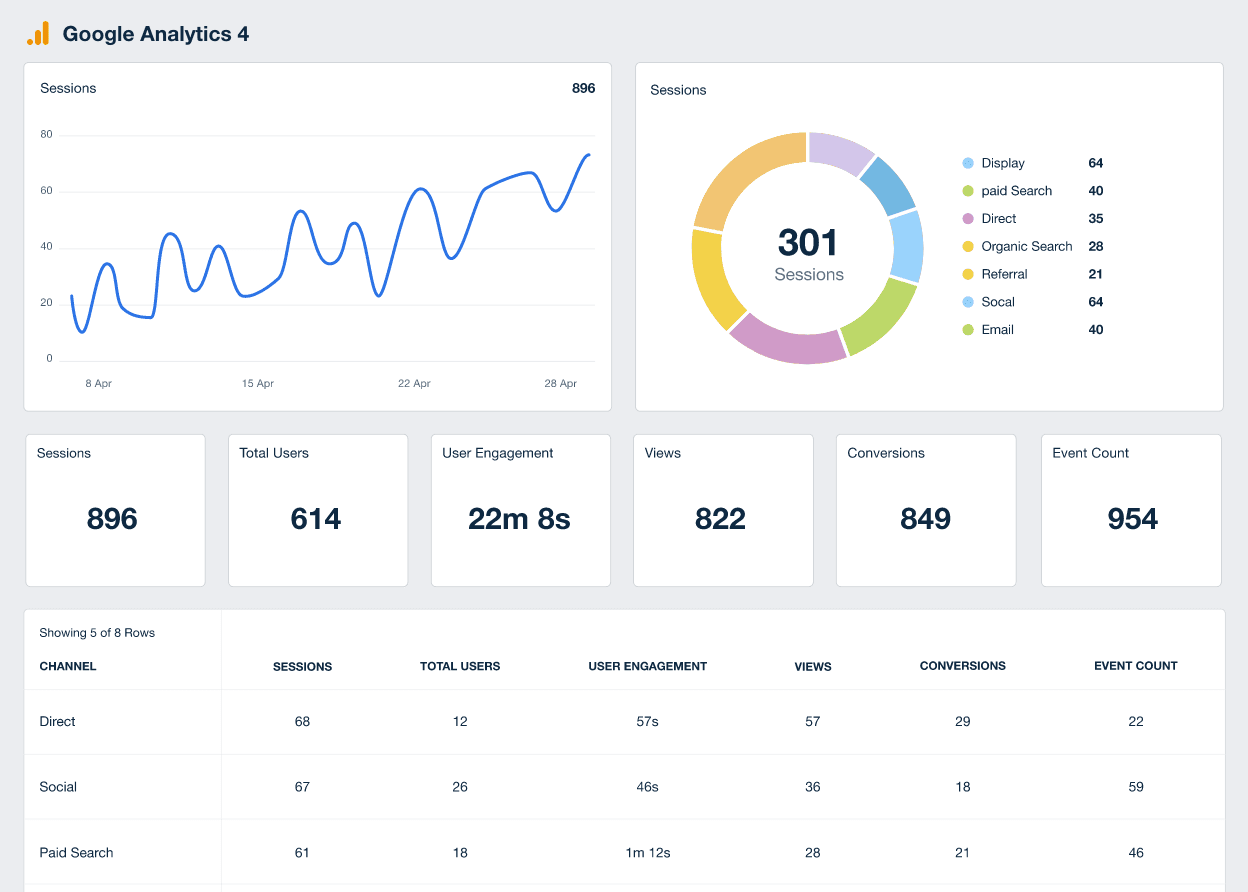
Use graphs or charts to visually represent changes and trends in 1-Day Active Users over time, making data more accessible and understandable.
Google Analytics 4 Dashboard Example
How To Improve 1-Day Active Users
Improving 1-Day Active Users is crucial for assessing the health and growth potential of a business. Follow these practical tips to improve daily user interaction and drive more tangible outcomes.
Engage Regularly
Use push notifications, emails, or social media to remind users of new content or features, which encourages daily visits.
Optimize UX
Track website optimization metrics and update website elements as needed (e.g., template designs) for enhanced engagement.
Incentivize Visits
To encourage daily visits, offer exclusive incentives such as rewards, exclusive content, discounts, or promotion codes.
Related Blog Posts
See how 7,000+ marketing agencies help clients win
Free 14-day trial. No credit card required.


