7-Day Active Users
Product Performance
Monitor user engagement to prioritize features or areas for product development.
User Retention Analysis
Track short-term user retention to gauge overall content effectiveness.
Market Position Benchmarking
Compare user engagement with competitors to determine market share.
User Engagement Insights
Assess engagement frequency and its correlation with conversions.
Why 7-Day Active Users Are Important
This metric offers a snapshot of how content, features, or marketing campaigns resonate with an audience within a 7-day timeframe. It directly indicates a website or app’s ability to attract and retain users in the short term.
Moreover, 7-Day Active Users is vital for spotting trends in user engagement, identifying potential issues, and making data-driven decisions.
A steady or increasing number of active users typically signals effective engagement strategies. Conversely, a decline may mean making content improvements or website optimizations.
Stop Wasting Time on Manual Reports... Get Insights Faster With AgencyAnalytics
How 7-Day Active Users Relate To Other KPIs
7-Day Active Users directly correlate with metrics like Conversion Rate and Bounce Rate, as well as Monthly Active Users. A high number of active users combined with a strong Conversion Rate indicates success in attracting users and prompting them to take action. On the other hand, having many active users with a high Bounce Rate implies content that doesn't convert effectively.
This metric also complements Customer Lifetime Value (CLV) and Acquisition Cost and Daily Active Users. Tracking active user metrics helps in understanding the impact of retention strategies, which is a key component of CLV. Additionally, consider it alongside Acquisition Cost to understand the cost-effectiveness of attracting and retaining users.
How To Calculate the Number of 7-Day Active Users
Measuring 7-Day Active Users involves tracking the unique users who visit a website or app over a consecutive seven-day period. This process requires aggregating data to identify distinct users and ensuring each individual is counted only once, regardless of multiple interactions. This metric is typically extracted from analytics tools that monitor user engagement daily.
What Is a Good Number of 7-Day Active Users?
A good average for 7-Day Active Users varies significantly across industries and platforms. Generally, a good benchmark is one that shows consistent growth or stability in active user numbers.
For instance, consider a newly launched app–an increase in weekly active users might be a positive indicator. In contrast, a stable number with minimal fluctuation may be considered healthy for more established platforms.
What Is a Bad Number of 7-Day Active Users?
A bad average for 7-Day Active Users is indicated by a consistent decline or a significantly lower number than historical active user data. This decline may happen for several reasons. For example, it could signal user dissatisfaction with recent changes (e.g., website layout, content direction). Regardless of the scenario, it’s a cause for concern that requires an analysis of user engagement and improvements to address it.
How To Set Goals and Benchmarks for 7-Day Active Users
To create benchmarks for 7-Day Active Users, gather and analyze historical data to identify usage trends. Establish realistic benchmarks based on this analysis while also factoring in industry standards and specific user segments.
Regularly update benchmarks to reflect changing user behaviors and market conditions. Use this baseline to create user engagement goals that are relevant, attainable, and realistic.
Why 7-Day Active Users Matter to Clients
For clients, 7-Day Active Users is a direct measure of how well their digital presence resonates with target audiences. It provides immediate feedback on user engagement and helps evaluate the effectiveness of recent marketing campaigns or content updates.
Furthermore, this metric aids clients in making informed decisions about future investments in marketing and product development. For example, a consistent increase in how many users are active might justify business expansion, content re-focus, or exploring new markets.

Why 7-Day Active Users Matter to Agencies
For agencies, achieving a consistent or growing number of 7-Day Active Users showcases proficiency in attracting and retaining an audience. It also demonstrates their ability to produce engaging content that resonates with users.
Additionally, this metric provides agencies with critical insights for optimizing marketing strategies and allocating resources. By monitoring fluctuations in 7-Day Active Users, agencies demonstrate historical trends and ensure their client’s digital presence remains strong.

Turn Data Chaos into Client Success Stories with AgencyAnalytics.
Best Practices for Analyzing and Reporting on 7-Day Active Users
A thorough analysis of 7-Day Active Users is essential for optimizing advertising campaigns. Here are some reporting suggestions to communicate these insights effectively.
Peak vs. Off-Peak Analysis
Compare user activity during peak and off-peak hours within the 7-day period to identify engagement patterns.
Pre and Post-Campaign Comparison
Analyze changes in 7-Day Active Users before and after specific marketing campaigns to gauge their impact.
Device Type Analysis
Segment 7-Day Active Users by device type (mobile, desktop, tablet) to monitor engagement and identify trends.
Impact of Content Updates
Correlate changes in 7-Day Active Users with recent content updates or website changes to assess performance.
Identify Conversion Correlation
State how variations in 7-Day Active Users affect conversion rates, providing insights into user engagement quality.
Benchmark Against Industry Standards
Compare 7-Day Active Users with industry benchmarks to evaluate performance relative to competitors.
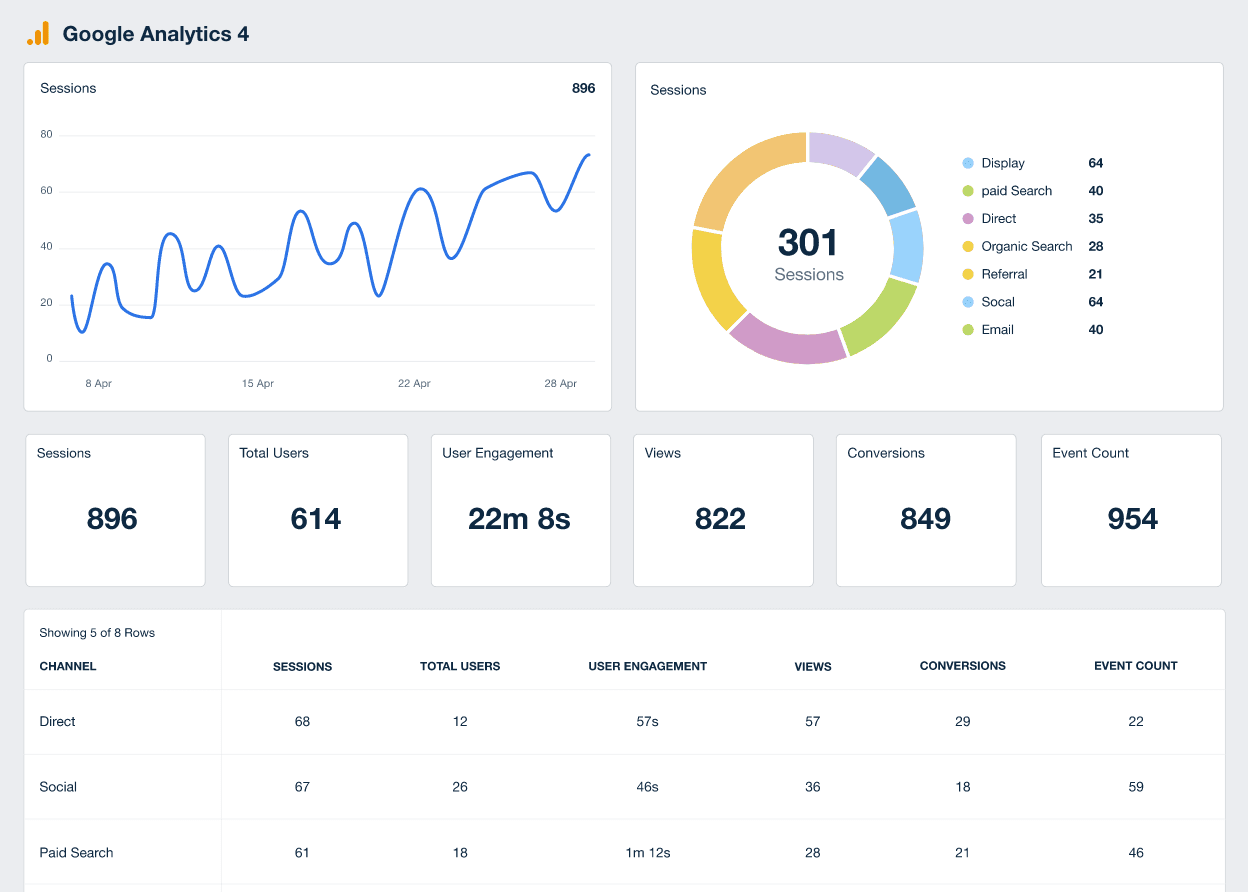
Google Analytics 4 Dashboard Example
Related Integrations
How To Increase 7-Day Active Users
Improving 7-Day Active Users is crucial for assessing the health and growth potential of a business. Follow these practical tips to improve daily user interaction and drive more tangible outcomes.
Interactive Features
Incorporate interactive elements like quizzes or polls to drive engagement and encourage repeat visits.
Personalize Experience
Tailor content, recommendations, and interactions based on user preferences and behaviors.
Optimize Accessibility
Ensure device compatibility–particularly for mobile–with responsive designs and appropriate media dimensions.
Related Blog Posts
See how 7,000+ marketing agencies help clients win
Free 14-day trial. No credit card required.


