Table of Contents
QUICK SUMMARY:
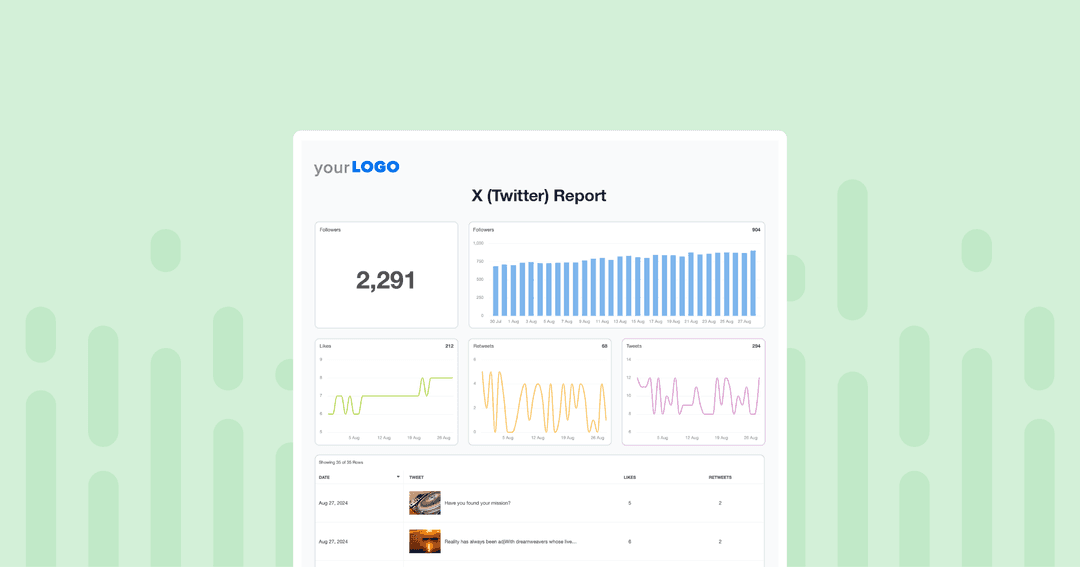
An X (Twitter) Metrics report pulls together essential Twitter metrics from your client’s campaigns, wrapping them up in a clear and actionable format. In this article, you’ll learn how to create compelling X (Twitter) reports that demonstrate your agency’s value, drive results, and strengthen client relationships.
Managing multiple clients and meeting tight deadlines often leaves little time for creating comprehensive (X) Twitter metrics reports, but these reports are crucial for demonstrating the impact of your team’s work.
Wondering how to create clear, actionable reports more efficiently, without sacrificing their quality? You’re in the right place.
In this article, you’ll learn how to craft effective X (Twitter) metrics reports that highlight your agency’s digital strategies and prove ROI. We’ll also explore how online reporting tools automate the process, allowing your team to produce clear, visually appealing, and insightful metrics reports.
What Makes a Great X (Twitter) Metrics Report?
Not all metrics reports are created equal. A great (read: valuable and easily interpreted) X report needs to be much more than a compilation of raw data points—especially when it comes to demonstrating your agency’s value to clients. Are those metrics important? Absolutely, but they don’t tell the whole story. The real value lies in transforming them into actionable insights that serve each client’s overarching social media strategy.
So, how does your agency transform a basic X report into a brilliant one? It’s all about mastering these core elements:
1. Clear Objectives: Communication expert and author of How to Win Friends and Influence People, Dale Carnegie, famously said, “Tell the audience what you’re going to say, say it, then tell them what you’ve said.”
This simple yet impactful approach applies perfectly to reporting. By starting your client’s X (Twitter) reports with a clear summary of their goals and purpose, you’re setting up what’s to come. This not only prepares your clients for the data they’re about to see but also ensures they fully grasp the context and significance of the insights you provide.
2. Relevant Metrics: Stuffing your X report full of every available Twitter metric is tempting—especially when your team is crushing it. But, less is actually more here. Including too many metrics makes it harder for your clients to figure out where to focus their attention. So, cut the fluff and focus only on the Twitter metrics that directly impact your client's goals. This approach makes it easier to showcase your team’s achievements and demonstrate the value your agency delivers.
AgencyAnalytics is not only a timesaver for our small team, it facilitates our being able to share rich data around client websites and outreach we would otherwise not be able to pull together for them. We do include email alongside other social outreach platforms (Twitter, Facebook, YouTube, etc. ) to help showcase the community for many of our clients.
Seth Giammanco, Principal, Strategy and Technology, Minds On Design Lab
3. Customization: Every client is unique, so their reports should be tailored to reflect that. Use templates to quickly and easily customize reports to fit each client’s specific needs and goals.
4. Visuals: Quickly convert X metrics from Google Sheets into visuals like charts, graphs, and tables not only make your report more engaging, but they also help stakeholders quickly grasp key insights.
5. Trends and Patterns: Raw data is great, but it’s more valuable when it’s interpreted. Highlight emerging trends or patterns to help your clients see their progress over time and visualize the big picture.
6. Actionable Next Steps: Valuable reporting includes more than a summary of what your team has accomplished. It should also include takeaways and offer actionable recommendations for improved Twitter performance.
Make sure your Twitter report template covers these key points so your clients easily see how well your team has executed their strategy and the tangible results achieved.
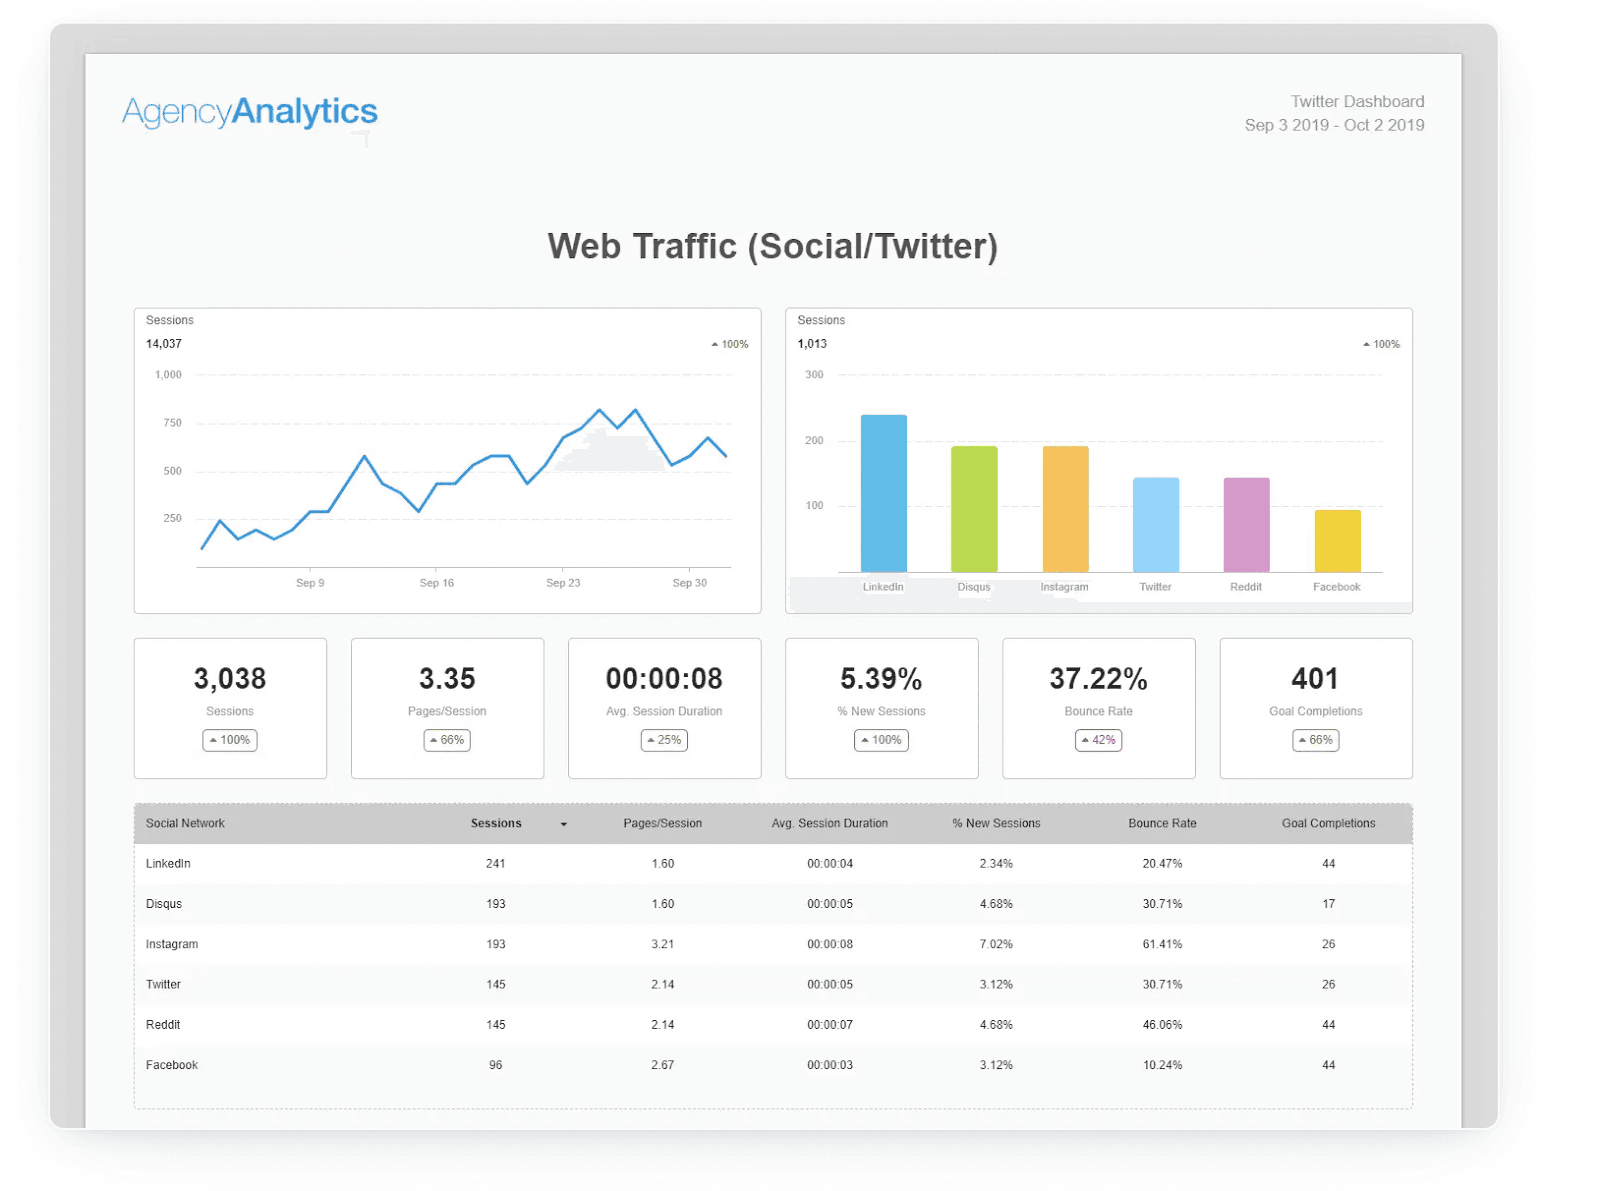
Streamline your reporting process and create custom Twitter analytics dashboards in minutes using the Google Sheets integration from AgencyAnalytics. Start your free 14-day trial with AgencyAnalytics today.
9 Twitter Metrics to Include in Your X Report
Think of your Twitter analytics report like a well-crafted playlist. Too many songs and it loses its impact. Focus on these key Twitter metrics to keep your agency’s achievements clear and compelling.
Follower Growth: Shows you the overall increase in Twitter followers over time and helps your clients understand the long-term impact of your agency’s X (Twitter) strategy.
Tweet Impressions: This is the total number of times your client’s tweets are seen by other Twitter users. Measuring Twitter impressions provides insight into both visibility and reach.
Engagement Rate: The engagement rate measures how often Twitter users interact with your client’s content. This includes link clicks, as well as clicks on posts (such as links, avatars, usernames, post expansion, and hashtags), along with retweets, replies, follows, and likes. Comparing these metrics against the average engagement rate in your client’s industry helps gauge how well their content resonates with their audience.
Click-Through Rates: This metric calculates the percentage of clicks an ad or link receives relative to its views. Click-through rates are a great way to gauge the relevance of client posts and the effectiveness of your calls-to-action.
Video Completion Rate: The video completion rate measures the percentage of viewers who watched videos to the end—reflecting the content's ability to maintain interest.
Cost per Reach: Measures how much it costs to get 1,000 ad impressions. The cost per reach formula helps agencies assess the cost-effectiveness of Twitter ads, making it useful for evaluating the overall cost of reaching their target audience.
Cost per Result (CPR): This metric shows how much it costs for a Twitter user to take a desired action (e.g., clicks or conversions).
Hashtag Performance: This metric is assessed based on social media engagements and reach—helping you identify which hashtags are performing best for your clients.
Best Time to Post: Identifies when your client’s target audience is most active, so you schedule tweets for optimal social media engagement.
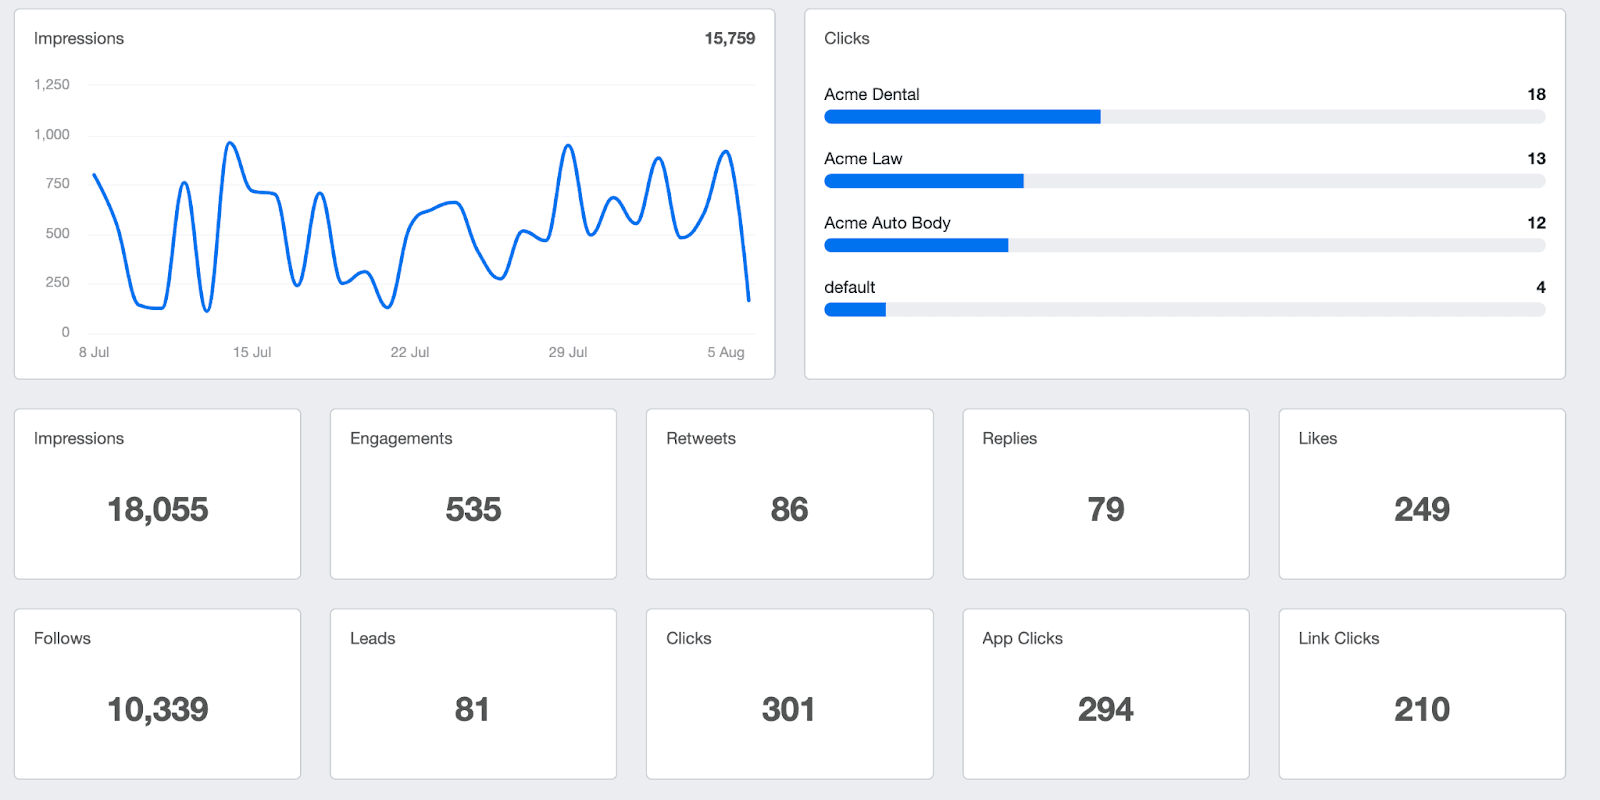
While these metrics are valuable, the real impact comes from analysis and strategic recommendations, which is why investing in a time-saving reporting solution is so beneficial. Designed specifically for agencies, AgencyAnalytics pulls data from 80 marketing platforms with just a few clicks—making social media reporting easier (and faster) than ever.

AgencyAnalytics' one-click smart reports allow your team to create a customized client report template in just 11 seconds! Start your free 14-day trial today!
Common Challenges of Creating X (Twitter) Metrics Reports
Building your client base is essential for growing a thriving marketing agency, but even the most experienced social media marketer will admit that juggling too many metrics reports is a major headache—especially when you keep running into the same issues. Take a look at these common challenges, and if they hit close to home, be sure to explore our solutions.
Challenge | Description | Solution |
|---|---|---|
Lack of Communication
| Without clear communication, your clients might not understand the ways in which your agency is working to enhance their bottom line. | Discuss overarching goals and key metrics from the onset, and keep clients regularly updated on progress. |
Information Overload | Pulling too many metrics from your client’s Twitter page makes it difficult to focus on what matters, hindering your team’s ability to create clear, actionable insights for your clients. | Put your blinders on. Focus exclusively on the Twitter metrics that align with your client’s goals and leave the rest. |
Lack of Context | Without context, your clients may misinterpret the data and come to inaccurate conclusions about your agency’s performance. | Use annotations to highlight how each metric relates to your client’s objectives. |
Presentation | Your reports don’t display key Twitter metrics in an accessible way. | Create a Twitter analytics dashboard using visual tools like charts, graphs, and infographics to make data more digestible. |
Having accurate reporting means everything, as we are a results-driven business. We need to be transparent to our clients with accurate reporting. Even if there is a negative, (like a ranking drop) we need to be honest to our clients so we can act on, and improve the situation.
Andrew Thomas, Technical Director, HookedOnMedia
8 Best Practices for Building X (Twitter) Metrics Reports
Retaining your clients depends on your ability to demonstrate your value. Here are some best practices that will help you create Twitter metrics reports that clearly articulate the success of your agency’s campaigns—and the value your team brings to the table.
Establish KPIs and Goals Upfront
While it may sound counterintuitive, starting with your client’s end goal and working backward to create a social media strategy is the best way to ensure you're on the same page.
Let’s say Client A tells you their main goal is to boost brand awareness ahead of a new product launch. Right away, this tells your team what information should be front and center on your client’s Twitter analytics dashboard—ensuring the data that’s collected and presented aligns with their overarching objectives.
Client retention is key to the success of our business. By using AgencyAnalytics, we are able to provide our clients with insightful, accurate, and detailed reports that showcase the value we bring to their business. This level of transparency and clear communication helps build trust and strengthen our relationships with clients, which in turn leads to higher levels of client retention.
Adam Binder, Founder + CEO, Creative Click Media
Choose Which Metrics to Track
Select metrics that directly relate to your client’s KPIs and goals. This eliminates information overload and ensures your team’s reporting focuses on what matters most to your clients. For instance, to track Client A’s brand awareness, your focus should be on Twitter engagement metrics like Twitter impressions, engagement rate, and follower growth over click-through rates or cost per acquisition, as they are less relevant to measuring visibility and engagement.
Choose Your Reporting Frequency
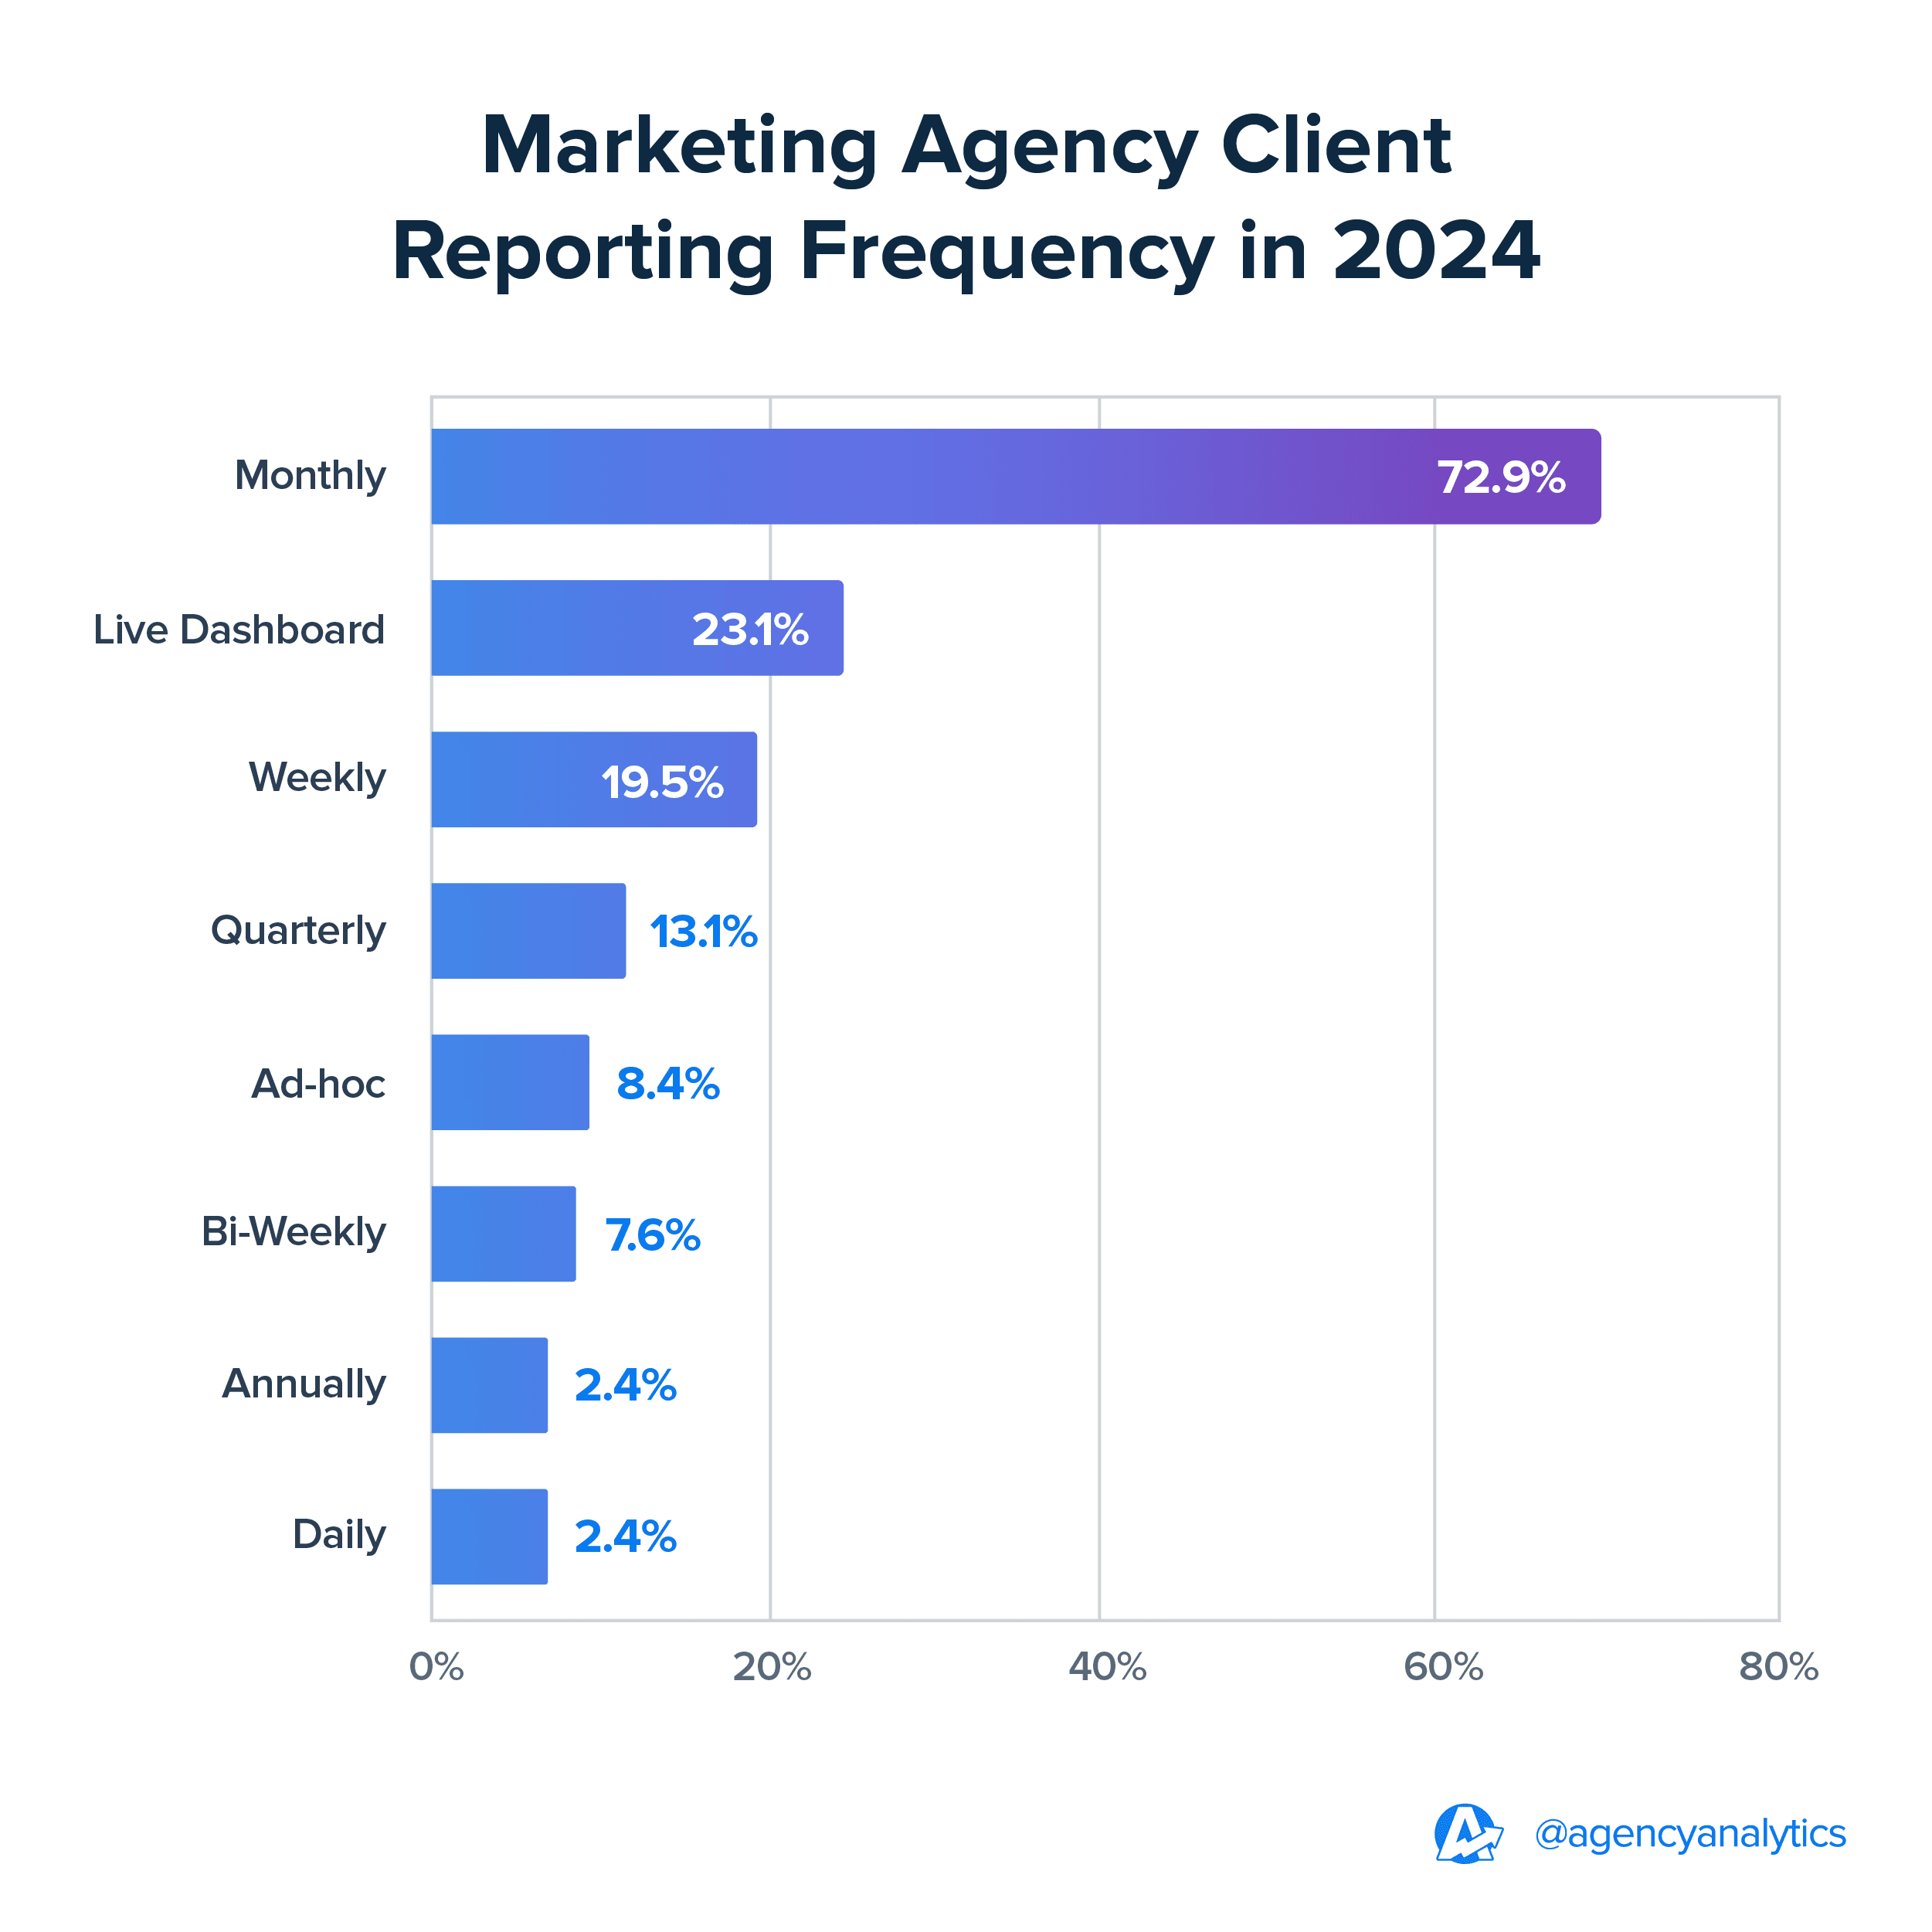
Work with your clients to determine your reporting frequency. Setting a regular reporting schedule ensures your clients know exactly when to expect updates while establishing a consistent cadence for the social media marketers on your team—making the process smoother for everyone.
According to the AgencyAnalytics Marketing Agency Benchmarks Report, the majority of clients prefer to receive reports on a monthly basis.
Build Your Template
Customizable templates make your team’s reporting process more efficient, so they spend less time manually compiling Twitter data and more time building out client strategies. But those handy templates? They benefit your clients too. Consistently presenting Twitter account activity gives your clients a clear, familiar layout that simplifies tracking progress over time.
One piece of advice is to create a master report template that lays out the specific metrics that you want reported on for each type of campaign/instance first and foremost, so that your reporting is uniform across clients and also to save yourself time so that you aren't starting from zero each time.
Molly Lopez, Owner-Partner at HITE Digital, Miami Office
So, what makes a solid Twitter metrics report template?
Accurate Data: Give your clients the full picture with current metrics and historical data trends.
White Label: Apply your agency’s logo and colors using white labeling to maintain brand consistency.
Data Visualization: Use visuals to present your client’s Twitter data as clearly as possible.
Choosing the Right Chart Types
Visuals make complex data more accessible and easier to understand. Send your clients a report without them and they might struggle to find the point. Creating a Twitter analytics dashboard with visuals like line graphs to show progress over time will provide the context your clients need to see the big picture.
Highlight Key Goals and Add Notes
Use annotations and goals to personalize dashboards, highlight key changes, set Twitter performance thresholds, and update clients on progress. Annotations help explain unexpected results, showcase top performing Twitter ads, or point out areas of your client’s social media strategy that might need a bit more attention.
Stay Flexible and Adjust as Needed
Social media is constantly changing—whether it’s yet another algorithm update or a new feature. Regardless of which social media platform you’re tracking, your reports should adapt to these changes to ensure your team is providing relevant recommendations.
Maximize the Impact of Your X (Twitter) Metrics Reporting
Mastering the art of X (Twitter) metrics reporting doesn’t just make your team’s job easier, it showcases your agency’s strengths and delivers tangible results for your clients. By applying the best practices outlined in this article and utilizing efficient reporting tools, your team spends less time compiling Twitter metrics reports and more time crafting world-class strategies that attract more clients and boost your agency’s revenue.
Ready to see how effortless reporting can be? Start your 14-day free trial today and let our supportive team help you get the most out of your client's data.

Written by
Kali Armstrong is a freelance content writer with nearly a decade of experience crafting engaging, results-driven copy. From SEO blogs to punchy short-form pieces, she combines strategic insight with authentic messaging to captivate audiences and drive results.
Read more posts by Kali ArmstrongSee how 7,000+ marketing agencies help clients win
Free 14-day trial. No credit card required.


