Salesforce Dashboard
What Is a Salesforce Dashboard?
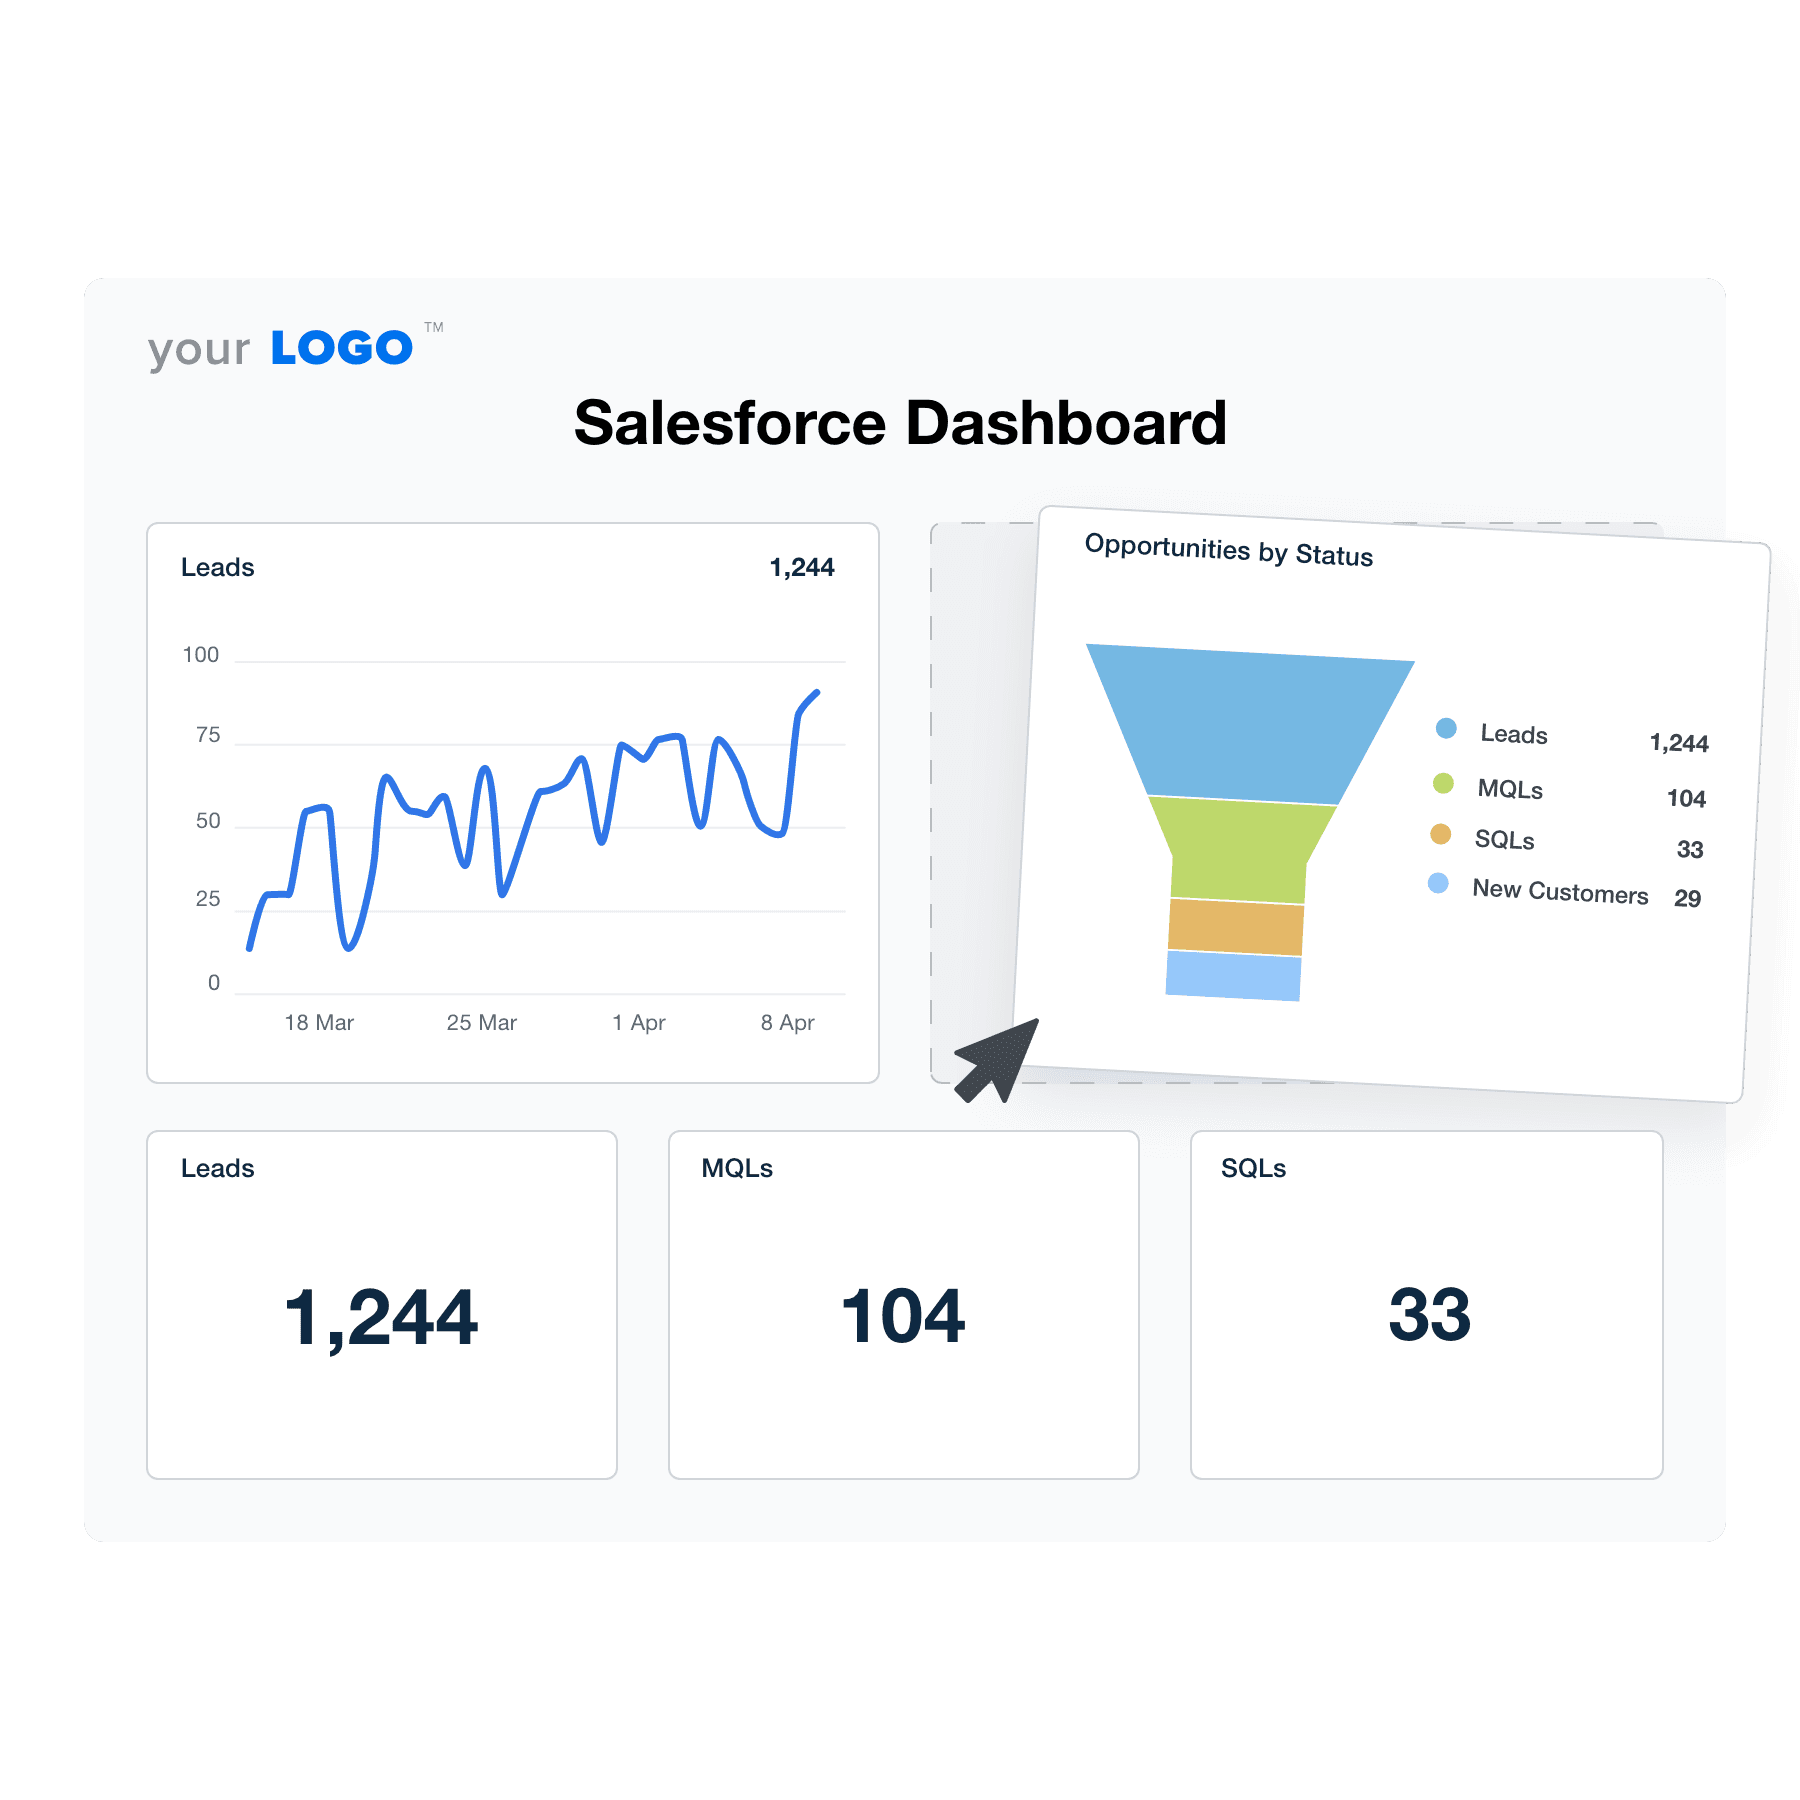
A white label Salesforce dashboard is a customized reporting tool that empowers agencies to present clients with actionable data. This interface visualizes key insights like lead conversion rates, sales pipeline progress, and revenue forecasts. This way, both agencies and clients are equipped to make well-rounded, informed decisions.
By adding your logo and brand colors, this dashboard becomes a way to solidify your brand and ensure recognition over time. This added touch of professionalism increases confidence in your services, all while presenting metrics that matter.
Why Your Agency Needs a Salesforce Analytics Dashboard
A Salesforce Dashboard goes beyond generic metrics, delivering tailored insights that align with your client's specific goals. Customize this tool as your agency sees fit–swap data visualizations, add comments for more context, or rearrange dashboard widgets. This flexibility means focusing on the KPIs that matter most and providing useful data without unnecessary clutter.
Create dashboards that provide clarity, ensure transparency, and deliver precise insights. To paint the complete picture, include metrics across 80+ platforms and share related report data. Deliver a white labeled reporting experience that exceeds client expectations!
Another key feature of this dashboard is automatic data retrieval. This means more billable time to focus on achieving results instead of creating eyesore spreadsheets. The result? Greater operational efficiency, more accurate data tracking, and happier clients.
11 Sections To Include in a Salesforce Dashboard
A well-structured Salesforce dashboard does more than display data: It tells a story.
By organizing metrics clearly, you’ll provide clients with a comprehensive view of their sales and marketing performance. Here are the essential sections to include in a Salesforce dashboard for maximum impact.
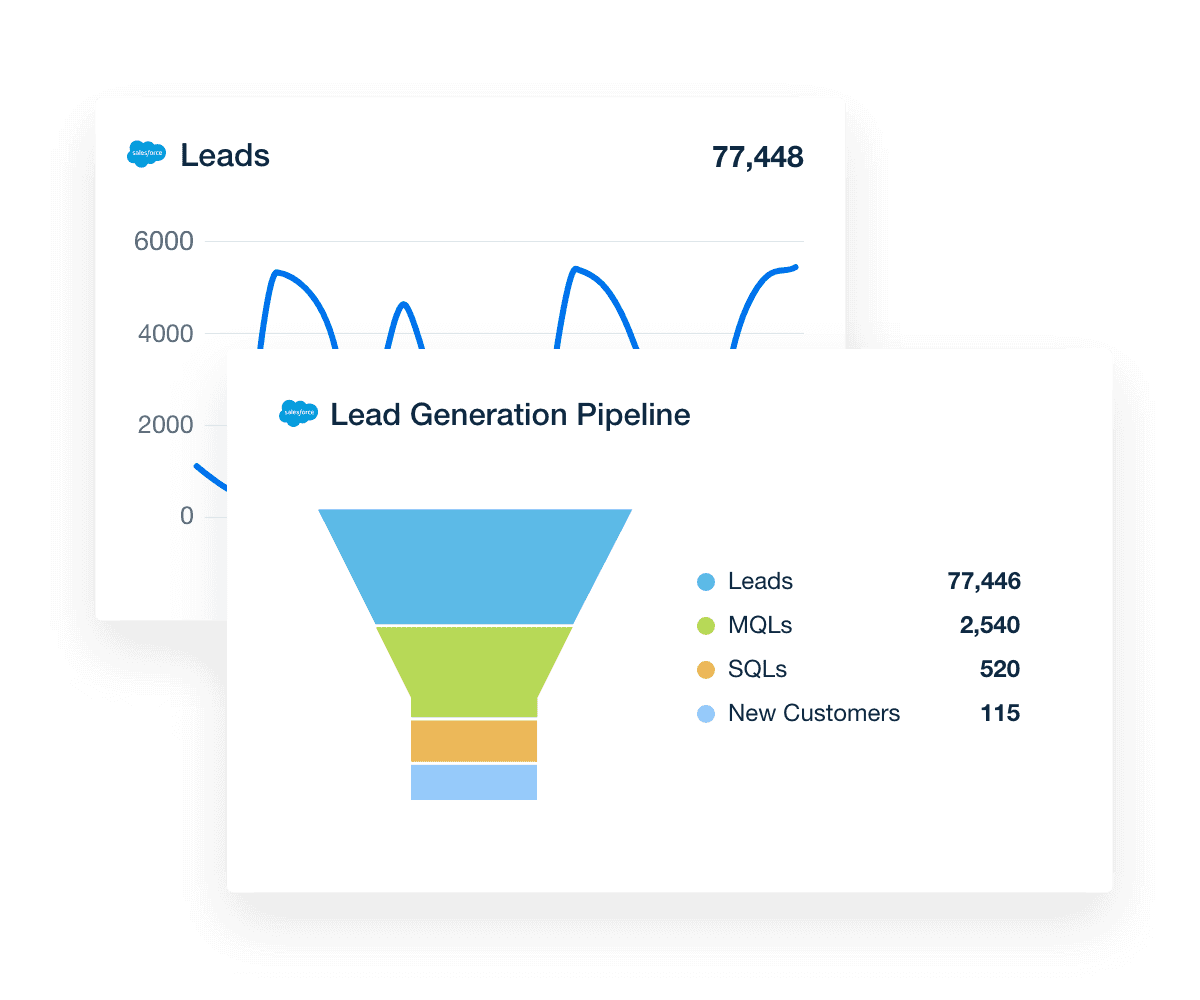
1. Leads
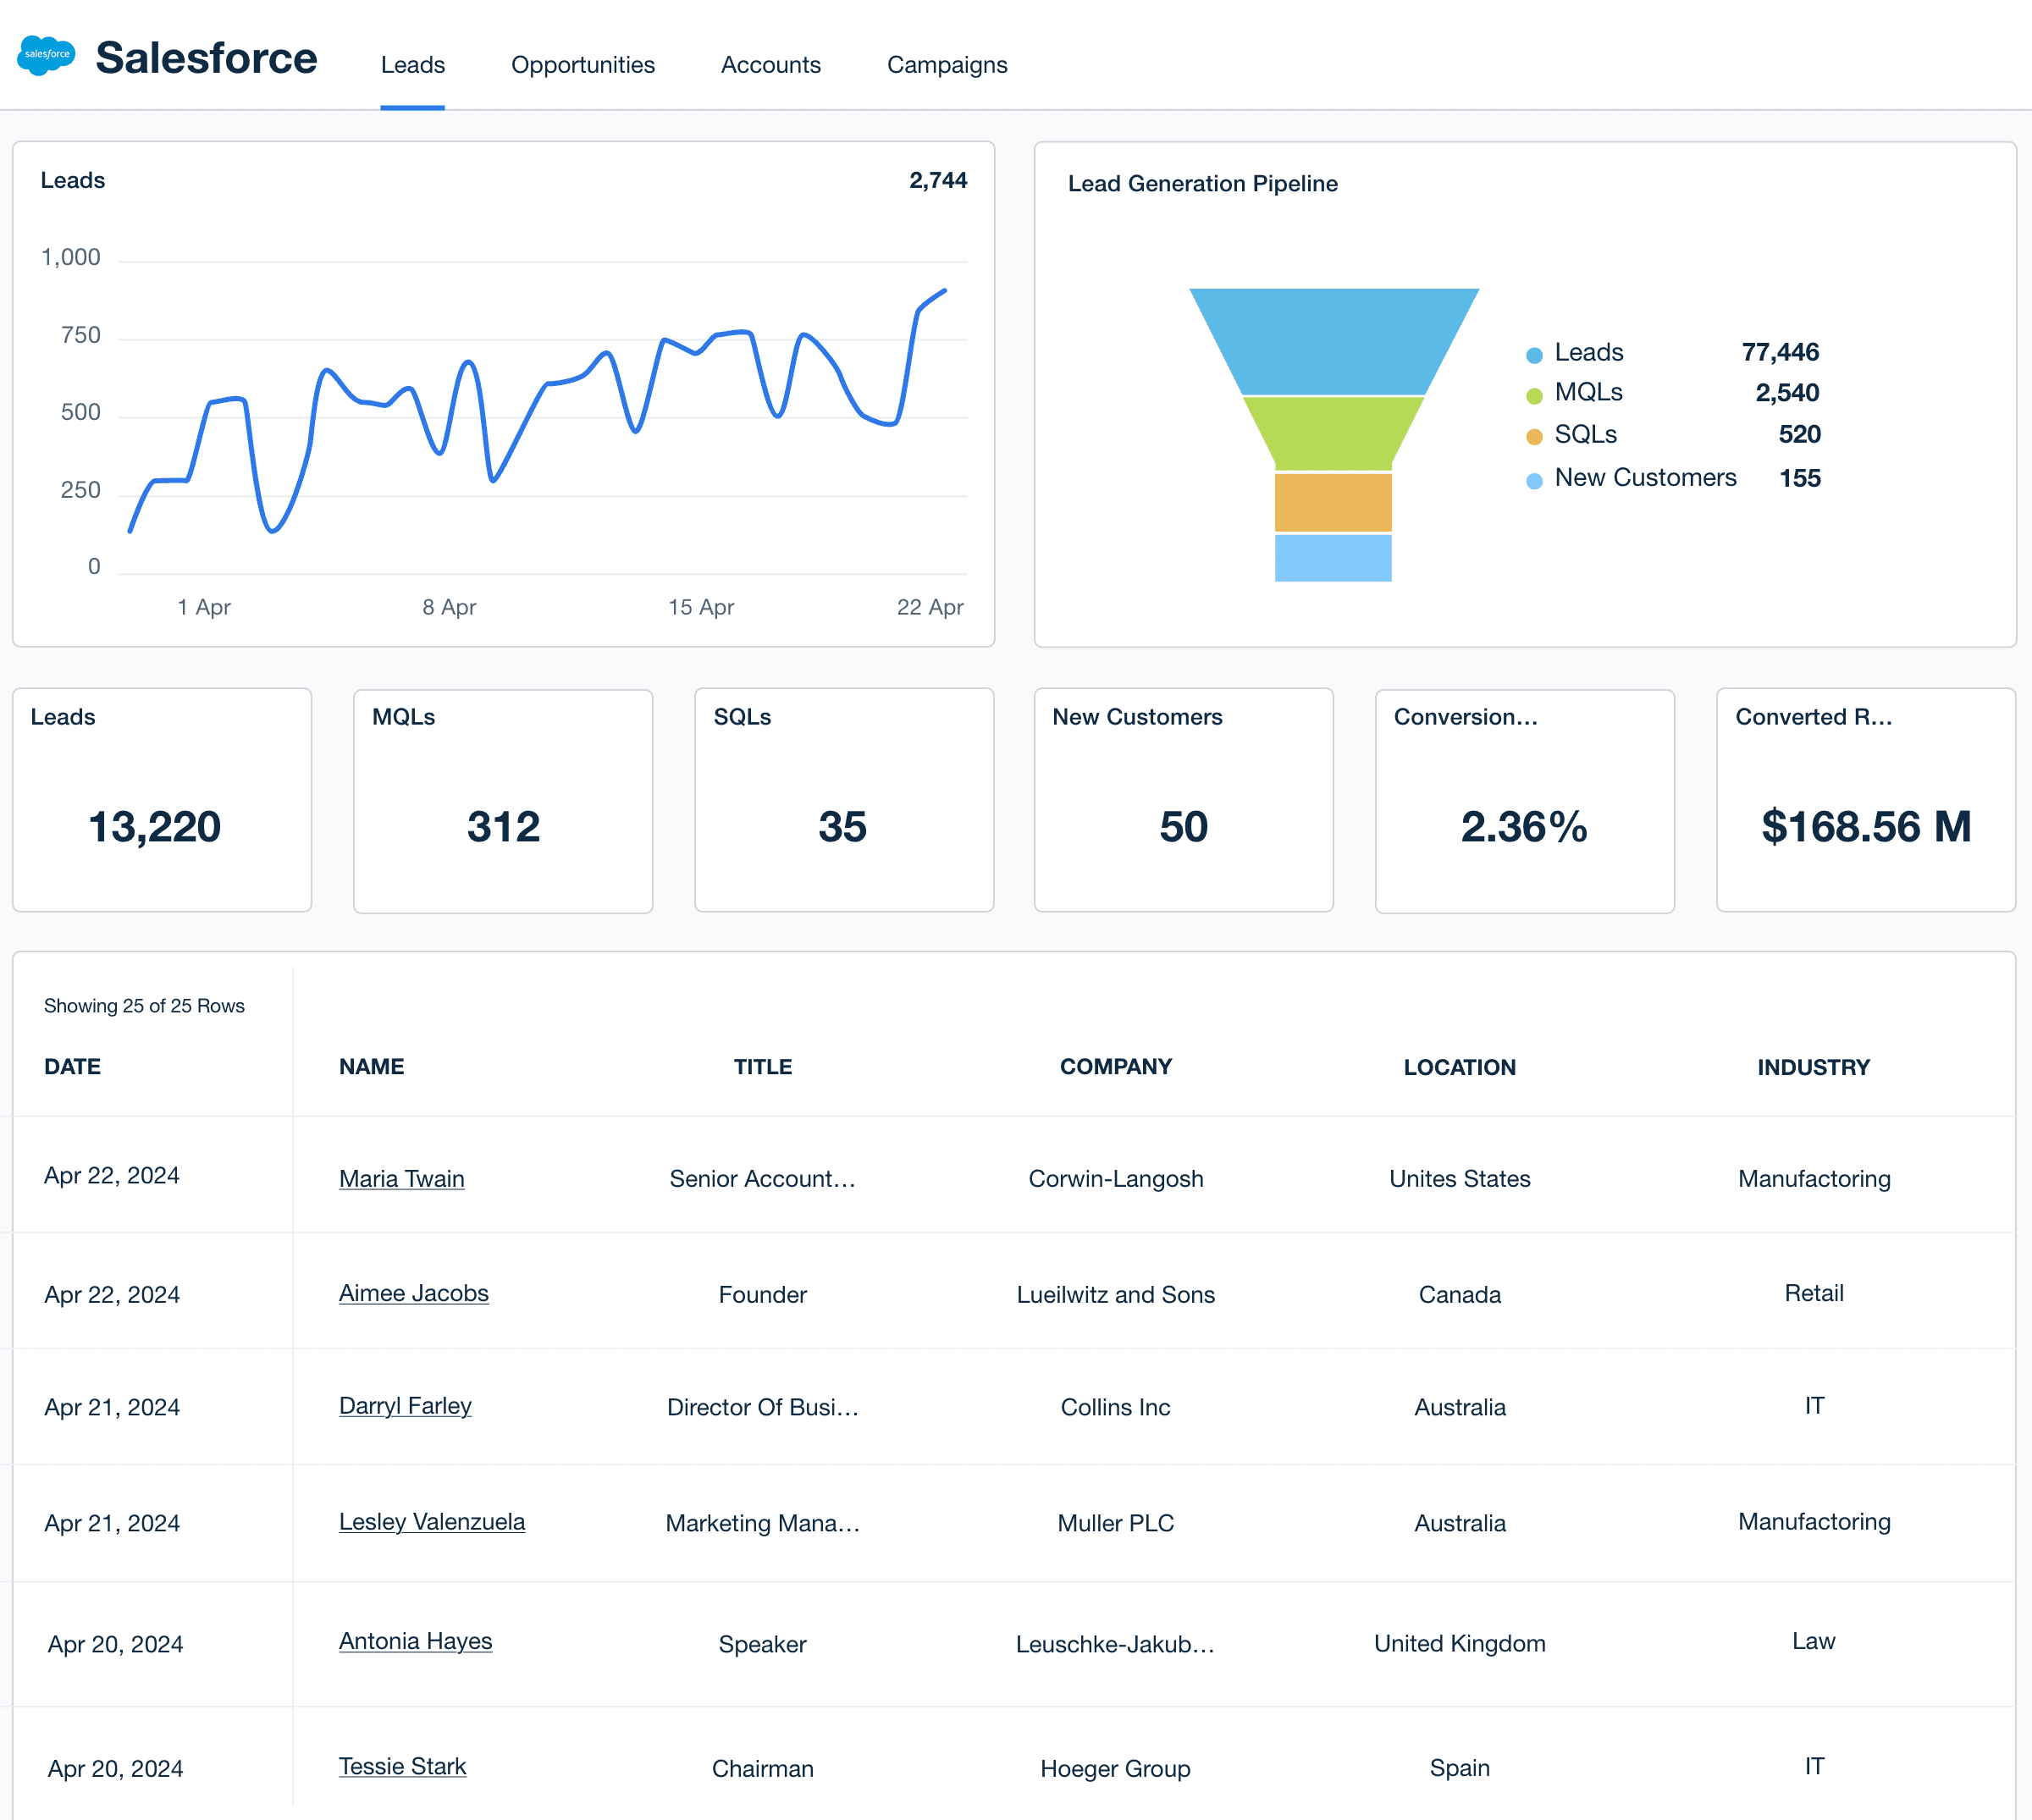
Leads represent individuals or businesses that have expressed interest in your client’s product or service. These prospects are a critical metric for tracking how effectively a campaign is driving interest and attracting potential new business.
A high number of leads often indicates that targeting strategies are working. However, note that it’s also important to evaluate quality and avoid flooding sales teams with unqualified prospects. Conversely, a low number of leads may mean improvements are needed (e.g., more specific messaging or increasing ad spend).
2. Marketing Qualified Leads (MQLs)
MQLs are potential customers who have come through the pipeline via your client’s marketing efforts. At this stage, they’ve shown enough interest or engagement to be considered for further nurturing by the sales team.
Monitoring MQLs helps agencies assess the quality of leads being generated. A high number suggests that your client’s marketing campaigns are reaching the right audience and resonating with potential buyers. Conversely, a low number of MQLs signals a need to refine messaging, adjust targeting, or revisit the offers being promoted.
3. Sales Qualified Leads (SQLs)
SQLs are potential customers who have been vetted and deemed as serious prospects by the sales team. Unlike MQLs (who show initial interest), SQLs have taken actions that suggest they’re closer to completing a purchasing decision. Therefore, they’re high-priority targets for conversion by sales reps.
Tracking SQLs helps agencies fine-tune campaigns, ensuring the right prospects are moving through the pipeline efficiently. A high number of SQLs reflects successful lead nurturing between marketing and sales, which demonstrates clear value to clients.
On the flip side, low SQL numbers may reveal gaps in lead qualification or misalignment in the funnel. To fix this, focus on optimizing the lead handoff process, refining qualification criteria, and enhancing communication between teams.
4. New Customers
New customers refer to individuals or businesses that have successfully completed the buying process (i.e., they’ve transitioned from prospects to paying clients). They’re often an end goal of any marketing and sales funnel, providing a direct measure of revenue.
This metric is a clear indicator of how well your client’s efforts convert leads into actual customers. A high number means the sales funnel is functioning smoothly, effectively turning SQLs into buyers. A low number suggests issues further down the funnel, possibly with sales follow-ups or misalignment in targeting. Use this data to pinpoint bottlenecks and optimize existing processes.
5. Opportunities
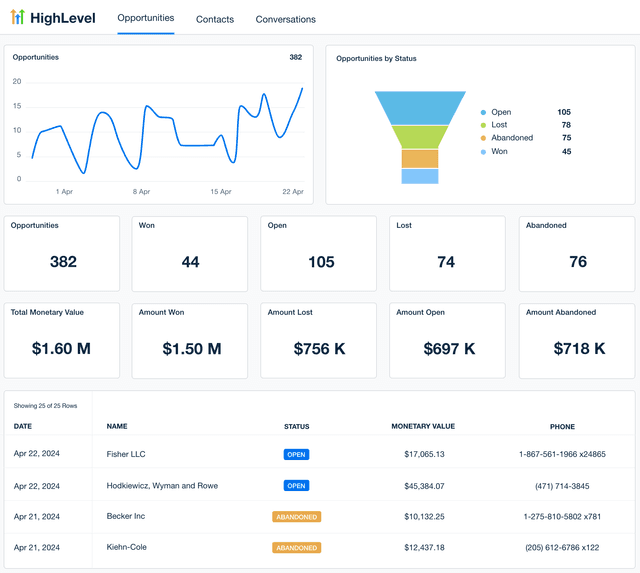
Opportunities refer to potential deals that are actively being pursued by the sales team. These qualified prospects have moved past the initial interest stage and are now seriously considering a purchase. Therefore, this metric is a key indicator of future revenue.
Reporting on opportunities allows your agency to demonstrate the progress of client campaigns. A high number means your client’s marketing efforts are driving prospects deeper into the sales funnel, creating more chances for conversion. To address a low number, consider refining the lead nurturing process. Also, focus on addressing any pain points that prevent these serious prospects from converting.
6. Closed Deals
Closed deals represent successful sales that have been finalized, which results in generated revenue. These deals reflect the culmination of all marketing and sales efforts, and by extension, your agency’s ability to drive tangible results.
A significant number of closed deals indicates that your client’s campaigns are driving high-value conversions. However, a low number of closed deals may indicate a disconnect between the opportunities generated and the sales team’s ability to drive conversions.
This could suggest an ineffective sales follow-up, poor lead qualification, or a mismatch between prospects’ needs and the solutions being offered.
7. Conversion Rate
Conversion rate measures the percentage of prospects who take a desired action out of the total number of potential leads. It’s a direct indicator of whether a campaign is effective at turning interest into tangible results.
Tracking this metric helps agencies ensure that clients consistently hit sales targets. A high conversion rate signals that strategies are well-aligned with audience intent and drive meaningful engagement. To fix a low conversion rate, focus on optimizing follow-ups and offering a clear value proposition.
8. Expected Revenue
Expected revenue refers to the projected income from deals that are in the pipeline but not yet closed. It’s calculated by multiplying the potential deal value by the probability of closing, giving agencies a clear forecast of future revenue streams.
A high expected revenue is an ideal scenario–it shows that your client’s sales funnel is packed with valuable opportunities. It’s also useful to create accurate financial projections and plan ahead.
That said, a low number suggests that the total pipeline may need more attention. It could also mean placing more focus on attracting qualified leads.
9. Amount Won
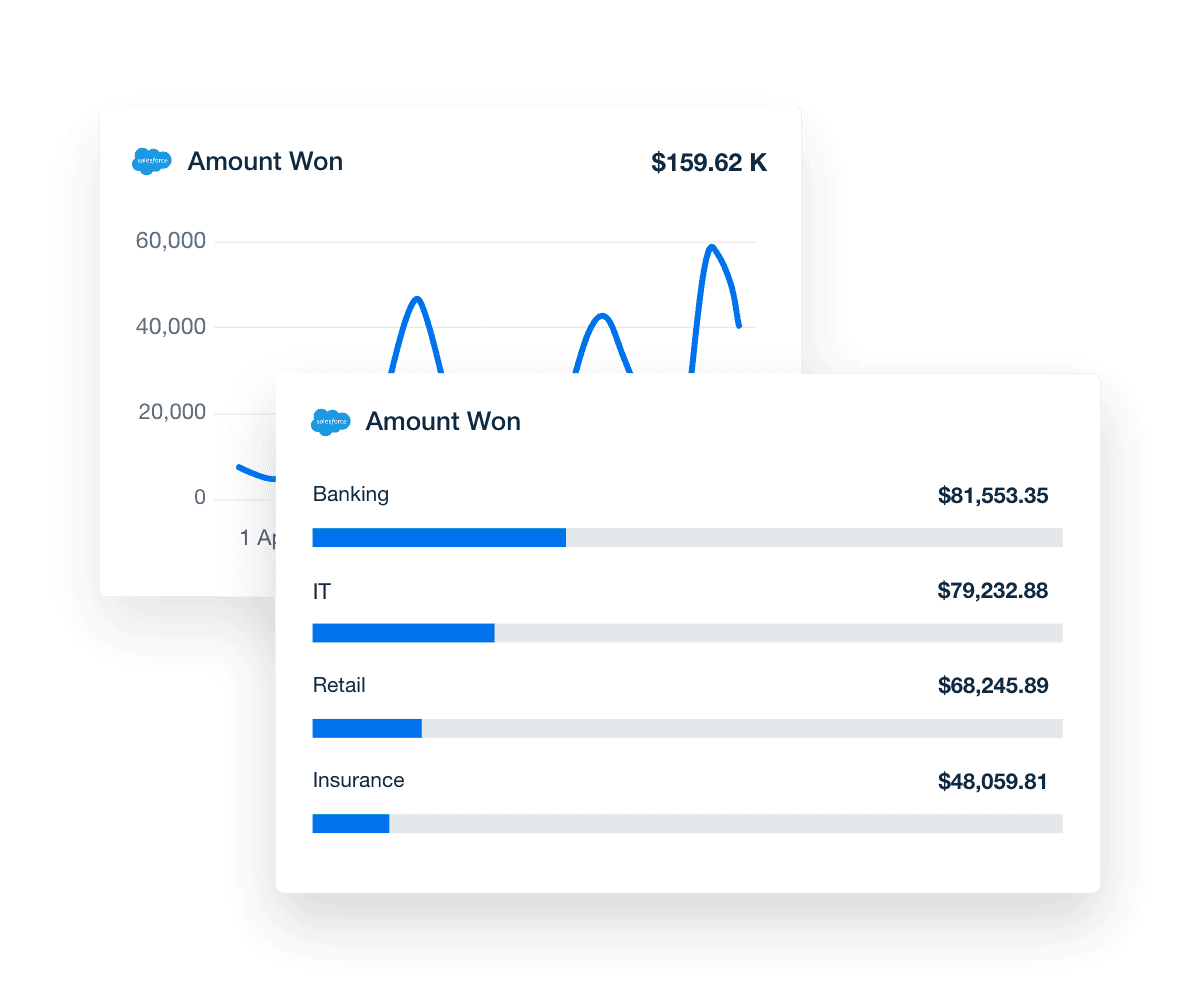
Amount won refers to the total revenue generated from deals that have been successfully closed. This metric reflects the financial outcome of all completed sales efforts, which is a tangible measure of your client’s growth.
If your client generates a significant amount of revenue, it means that their opportunities actually convert into substantial outcomes. It also reaffirms that there’s a healthy interest in their product or service. However, a low number may suggest that leads are entering the pipeline without converting. It could point to a few things, like friction in the sales process that prevents leads from moving forward.
10. Amount Lost
Amount lost refers to the total value of deals that were not successfully closed, representing missed revenue. In other words, this metric highlights potential income that didn’t materialize, making it a valuable learning opportunity for both clients and agencies.
Use this data to analyze where deals are slipping through the cracks. It may help your agency identify patterns, potential causes (e.g., a slow follow-up process), and reduce future losses.
11. Goal Tracking
To present a visual representation of progress towards sales and marketing targets, try the goal tracking feature. It gives a clear, measurable view of performance, allowing both you and your clients to stay aligned on milestones.
By consistently highlighting goal progress to dashboard viewers, you’ll provide valuable context to client data, which helps demonstrate the true value of your services. It also helps Sales Managers make informed decisions (e.g., ensuring adequate resource allocation to nurture high-value prospects). This efficiency fosters trust, ensuring your clients feel confident in their sales strategy and your ability to drive results.
When setting KPI goals, it's important to focus on goals that drive impact and are easy to track. Here are a few best practices:
Align goals with specific business objectives (e.g., meeting overall targets from your client’s sales leaders).
Set measurable targets that reflect both short-term and long-term outcomes. Monitor progress using report charts and other dashboard components.
Regularly review and adjust goals based on sales performance and changing client needs. As a best practice, check in with your client’s Sales Manager to ensure campaigns are yielding enough ROI.
Streamline Reporting With Salesforce Dashboards. Focus on What Matters.
Salesforce dashboards simplify client reporting and campaign analysis. That way, your agency has more time to invest in high-level activities, like actually delivering client results.
It’s not a one-size-fits-all tool, either. With the drag-and-drop builder, move any dashboard widget around and choose a format that suits your client best. Try different dashboard charts, add annotations to Salesforce data, utilize advanced dashboard filters, and even create custom metrics–all in a few clicks. Building dashboards has never been easier!
Here’s another bonus: This platform was built to handle an increasing volume of clients and campaigns. That means you won’t have to worry about switching reporting tools as your roster increases. Instead, you’ll have a robust system that removes the hassle of manual data collection and does the heavy lifting for you.
Use dynamic dashboards to quickly access important data and confidently deliver insights. Streamline internal workflows, strengthen client relationships, and consistently demonstrate measurable value month after month.
What if there was a way to enhance your efficiency even more? Luckily, there is–check out the Smart Dashboard feature! In just a few clicks, create a dashboard that’s automatically populated with your client’s unique metrics. Report on Salesforce data and insights across 80+ platforms in a centralized location.
We differentiate ourselves by showing clients their true marketing ROI and our AgencyAnalytics dashboard is the reason we are able to guarantee this knowledge to our clients. It aggregates their total marketing investment, total quote and sales value and–ultimately–their ROI.
Custom Salesforce Dashboards as Unique as Your Agency
Instantly Access All Your Clients’ Salesforce Data
Streamline data management and access insights from 80+ top marketing integrations. From SEO tools to CRM platforms like Salesforce, access data in one place.
Invest in a unified hub for your clients’ data without the pain of manual data retrieval. Gain a comprehensive view of performance, identify trends, and make important decisions with ease.
White Label Your Salesforce Dashboards
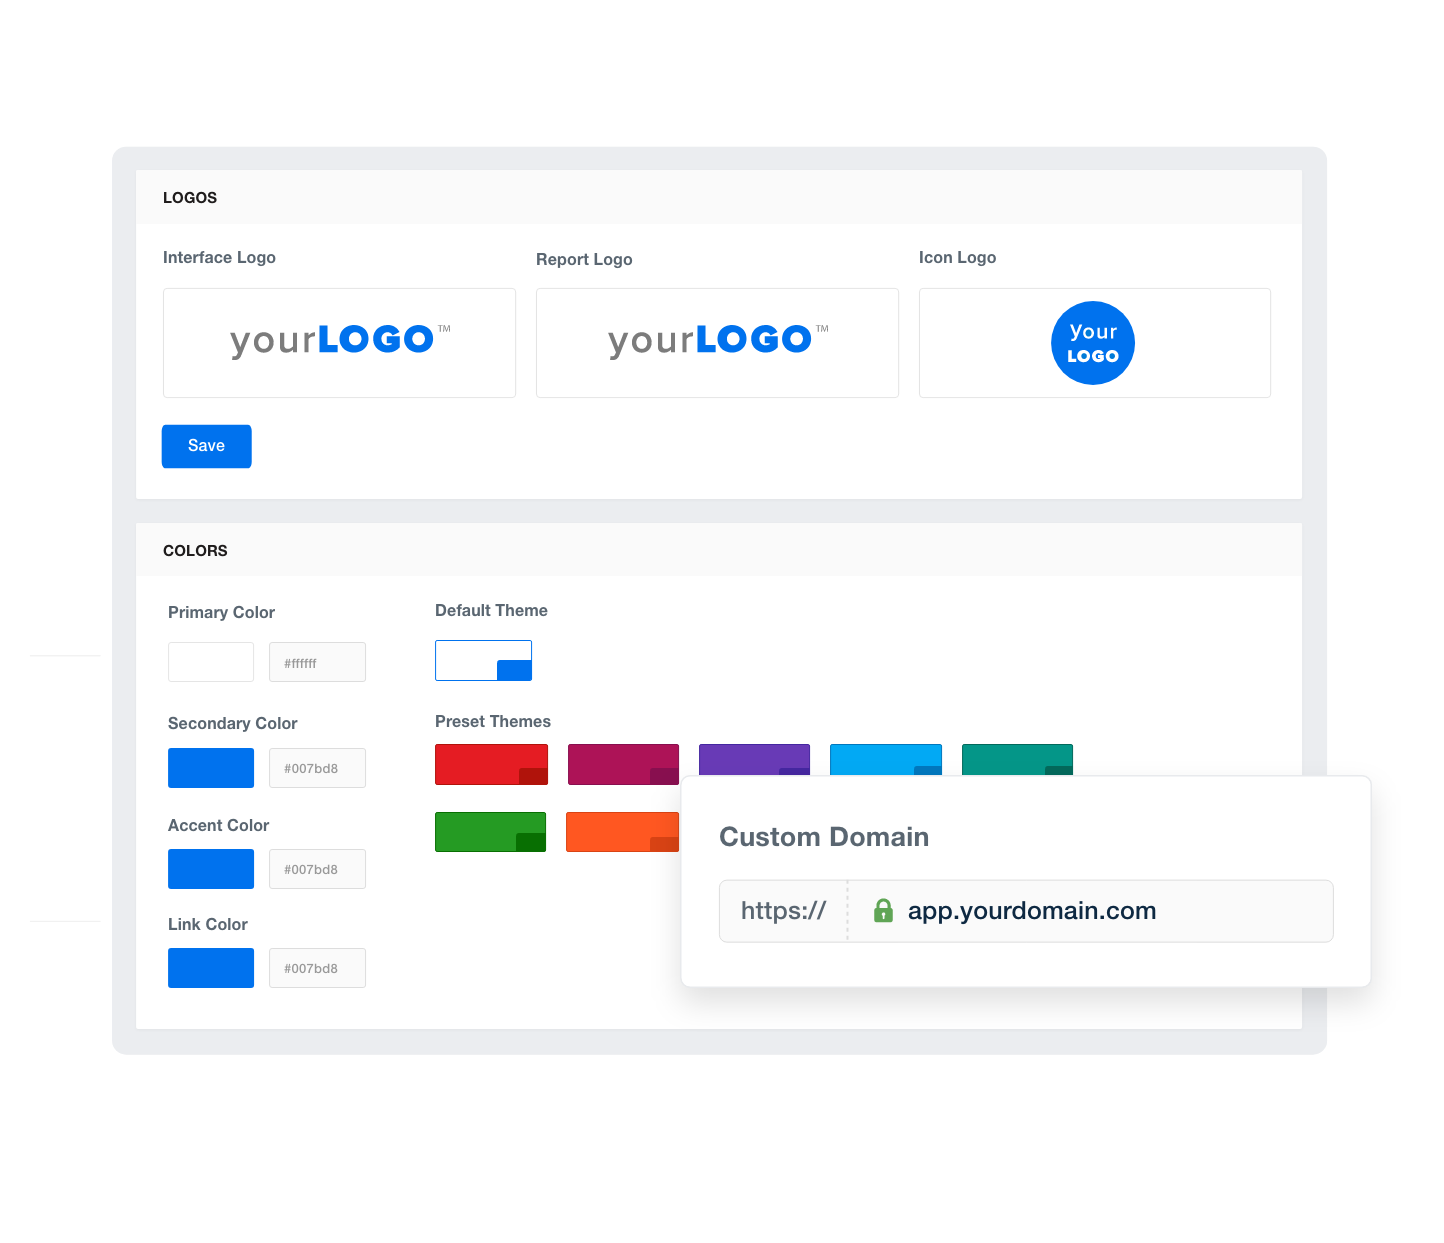
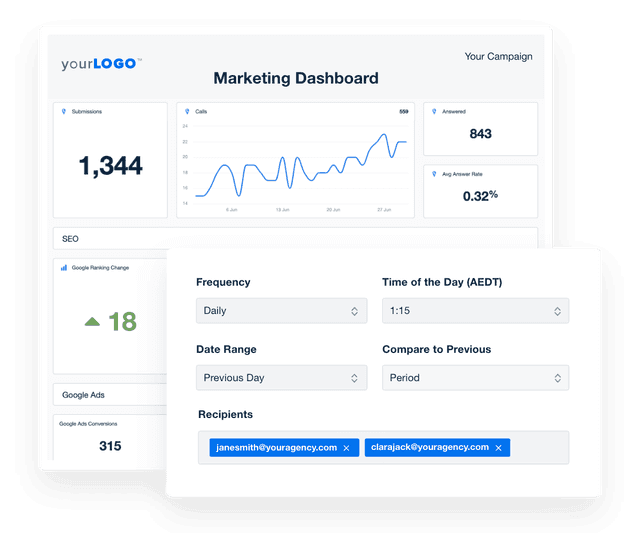
Your brand, your identity. With the white label feature, every dashboard and report reflects your unique essence. Add your agency’s logo, colors, and branding for that extra polished finish.
This way, clients see reporting as your work, not insights from a third-party tool. This professionalism strengthens relationships, positioning your agency as a strategic, trusted partner.
Provide Granular Insights With Custom Metrics
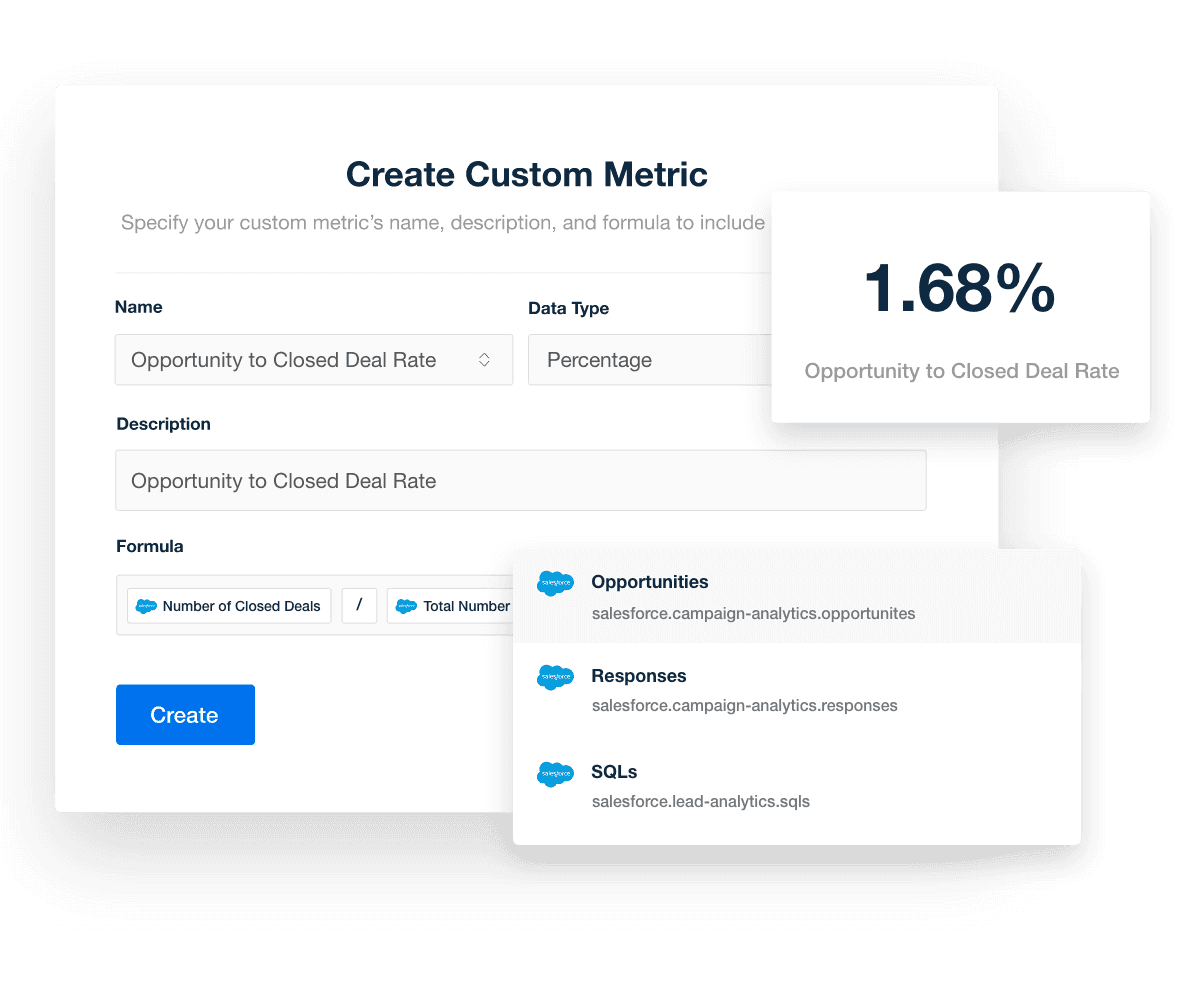
No two clients are alike, and neither are their KPIs. With the custom metric feature, define exactly what success looks like and align dashboards with unique business objectives. Easily blend data points into a single value!
Deliver personalized Salesforce reports and present complex data graphically. Offer a tailored approach that demonstrates your deep understanding of client needs.
Monitor Client Data Using a Single Dashboard
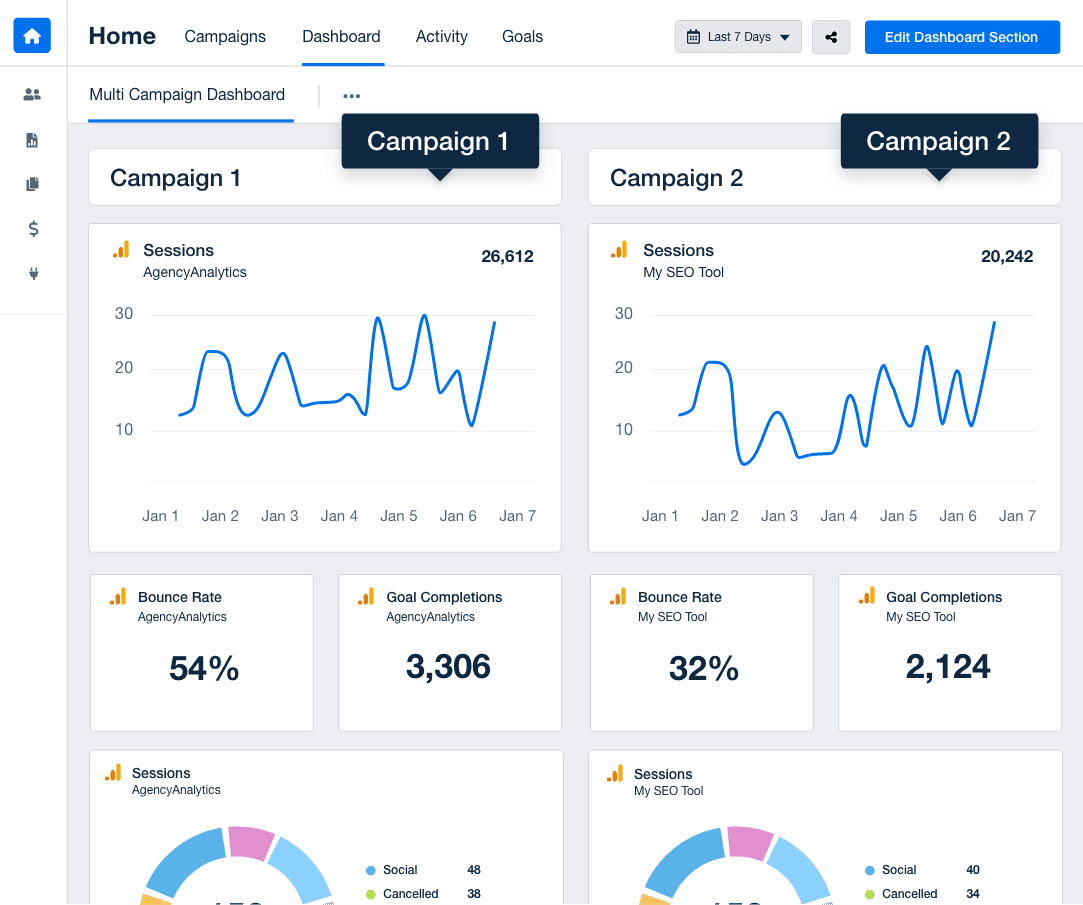
Need a high-level overview of all client campaigns? Simple: Create an internal account dashboard. Monitor critical KPIs, include sections for each client campaign, or even create a separate dashboard tab for each Account Manager.
Ensure that your agency is on target at all times. Use your team’s dashboard to identify campaign hiccups, monitor trends, and enhance data-tracking efforts.
Customer Support is Our Top Priority
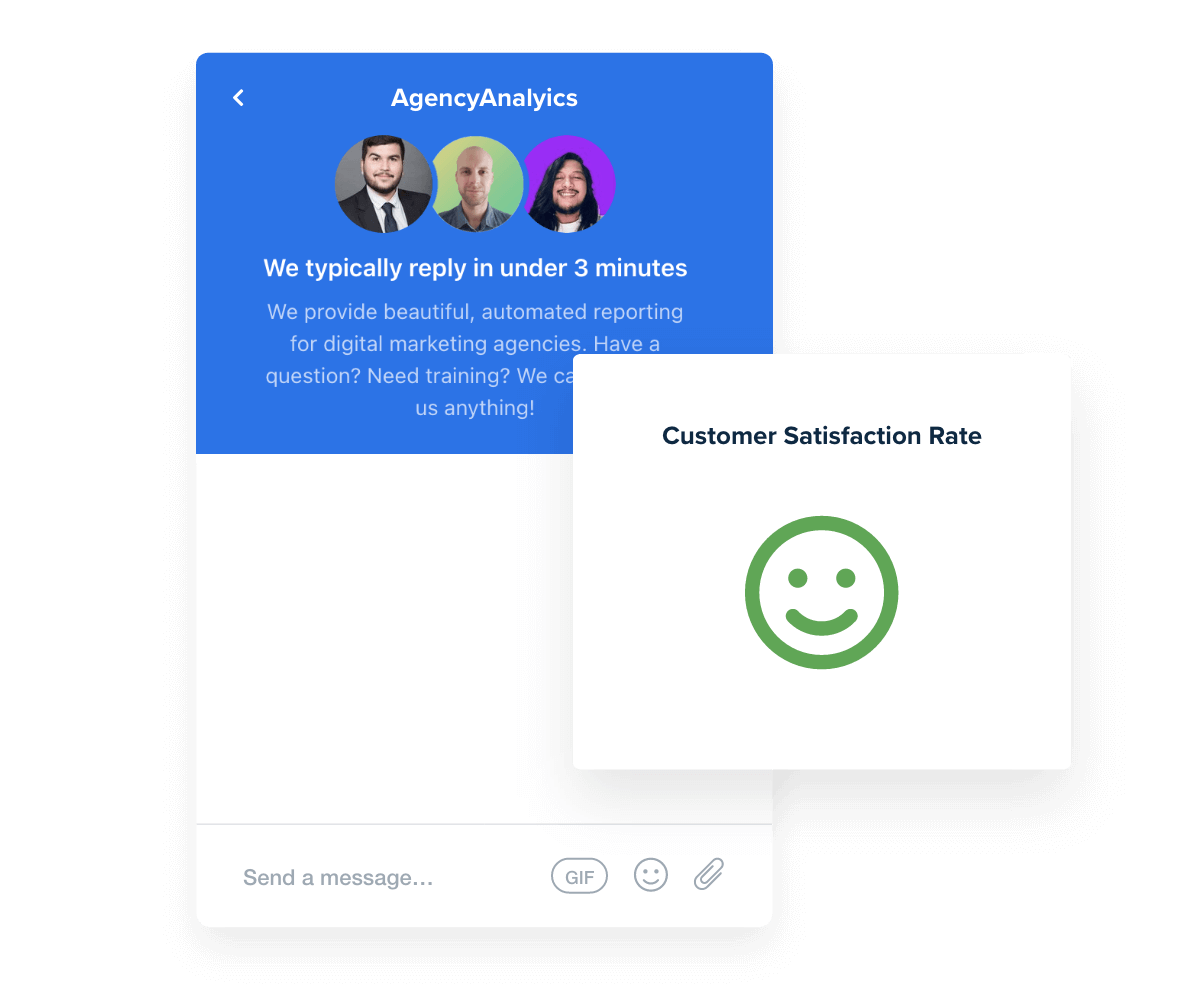
At AgencyAnalytics, your success is our top priority, which is why our dedicated support is available 24/5. Our live chat team responds in under 3 minutes, ready to assist with any questions.
With a satisfaction rate consistently above 95%, our support team ensures you have the support to deliver outstanding results every time. You care about your clients’ success. We care about yours.
Report Smarter. Not Harder.
Save time each month by creating a custom sales dashboard. Even include metrics from over 80+ data sources! Pull data from platforms like Salesforce, Google Analytics, Facebook Ads, and more.
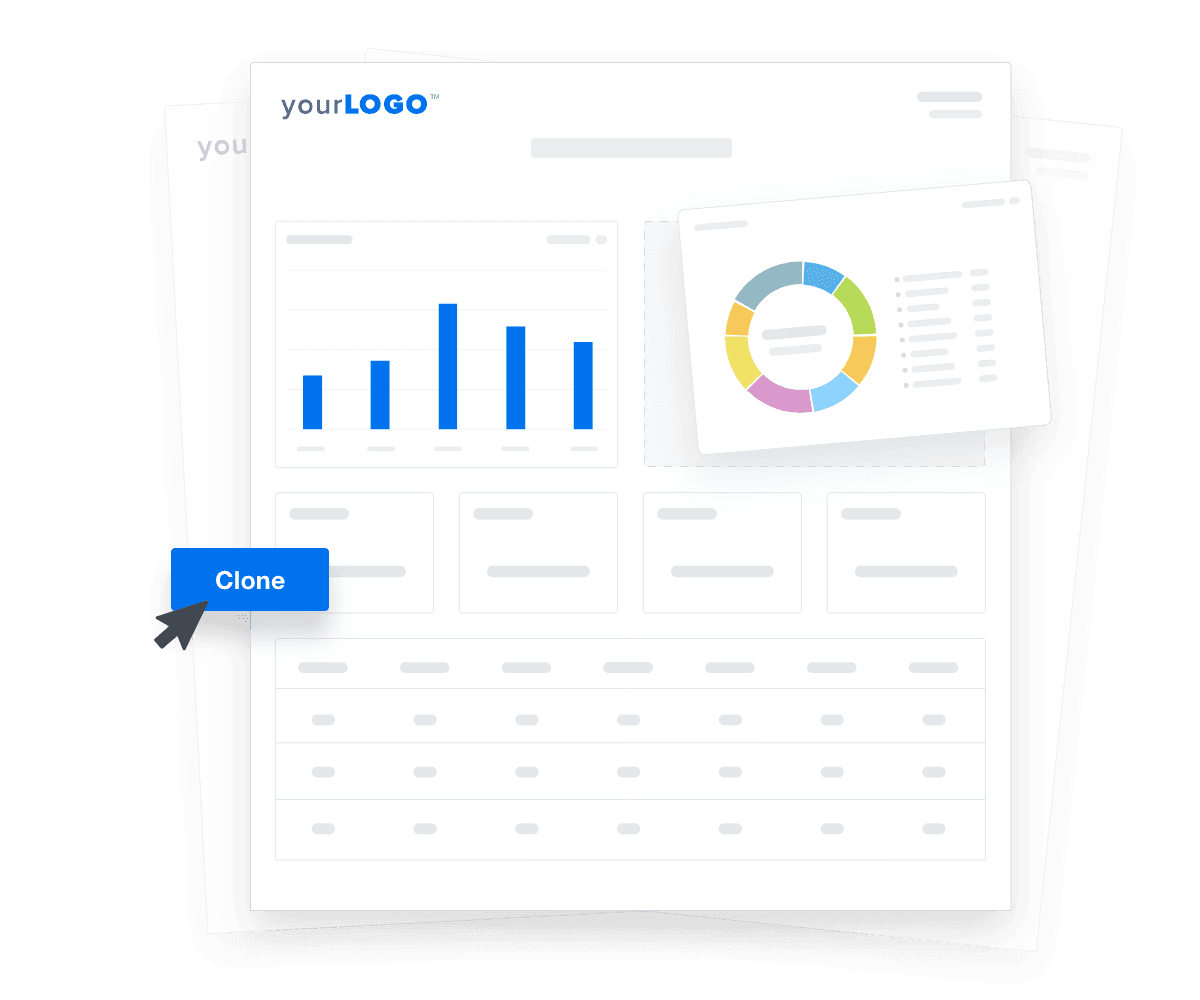
Give clients a comprehensive view of their sales and marketing performance. Easily replicate Salesforce dashboards and save time in the client onboarding process. Reporting has never been easier!
We spent a while looking for a reporting tool that covered our complete needs. AgencyAnalytics ticks the box very nicely for us and our clients. Just love the product. Every integration we needed with extras.