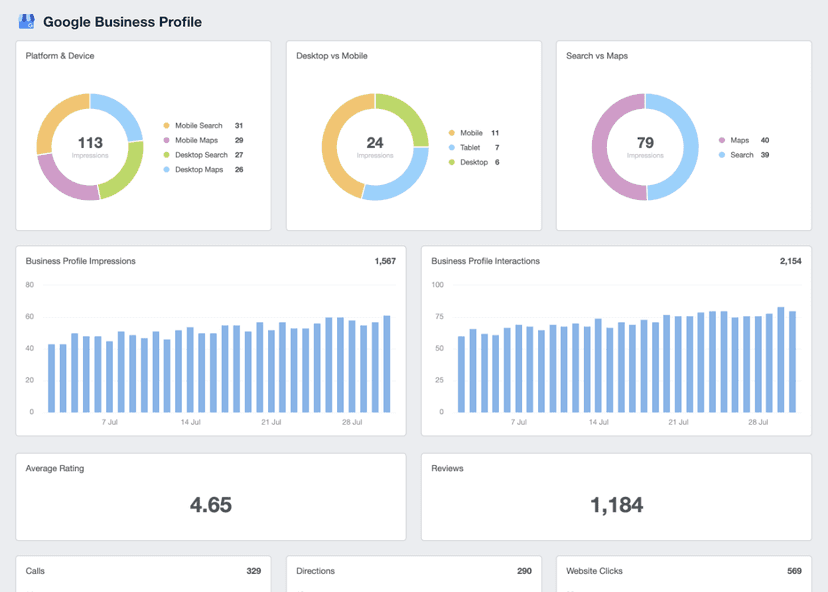
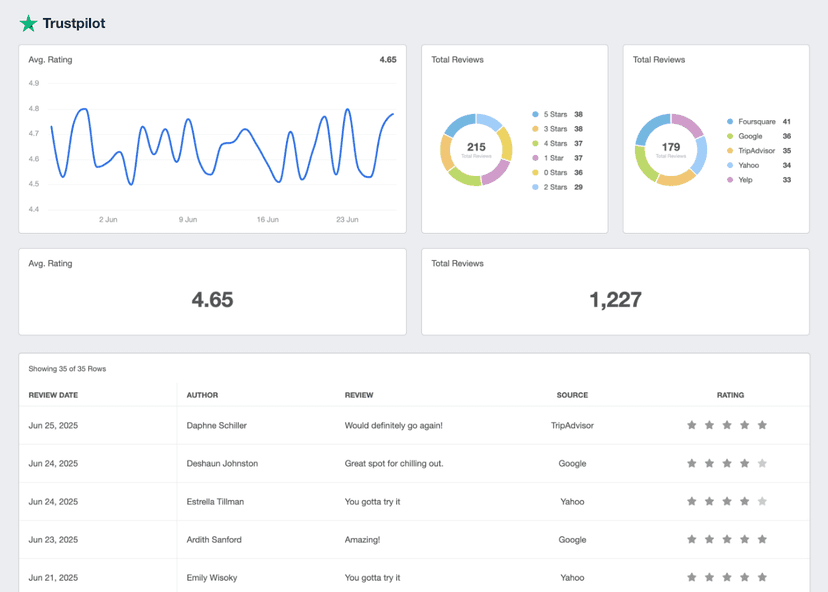
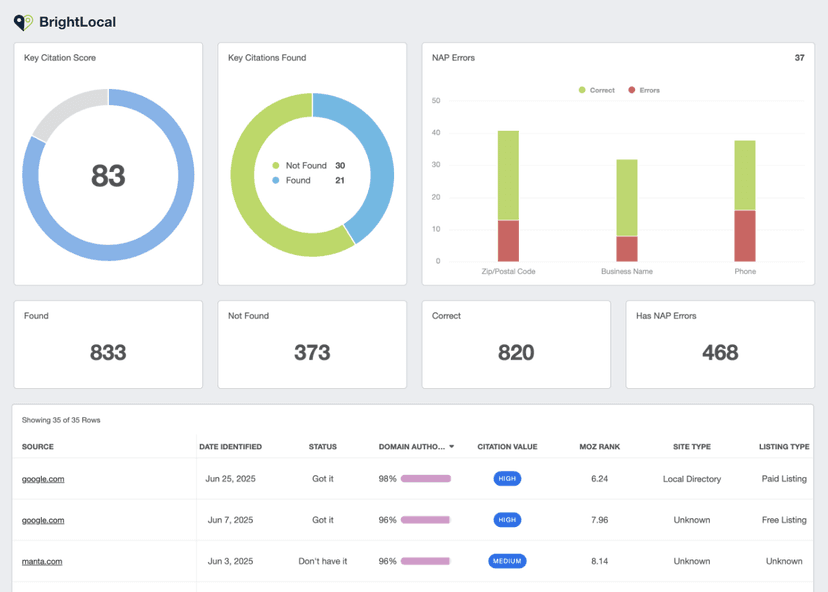
NPS Passives
Trend Analysis
Monitor Passives over time to identify trends in customer satisfaction and engagement.
Segmentation Strategy
Refine audiences and create targeted messages to convert Passives into Promoters.
Feedback Loop
Use feedback from Passives to understand customer needs and improve products or services.
Competitive Benchmarking
Compare Passive data with industry standards to understand overall performance.
An Overview of Net Promoter Score (NPS)
NPS score is a widely used metric in the business world for measuring customer loyalty and satisfaction. It divides customers into three categories: Promoters, Passives, and Detractors.
To calculate this metric, existing customers are asked the following Net Promoter Score question: "On a scale of 0 to 10, how likely are you to recommend our company/product/service to a friend or colleague?"
Here’s a more detailed explanation:
Promoters (score 9-10): Loyal, enthusiastic customers who have repeat purchases and spread positive word about the business. They may also refer other customers.
Passives (score 7-8): Satisfied but unenthusiastic customers who are vulnerable to competitive offerings.
Detractors (score 0-6): Unhappy customers who may impede growth through negative word-of-mouth.
The NPS score is then calculated by subtracting the percentage of Detractors from the percentage of Promoters. The score can range from -100 (if every customer is a Detractor) to 100 (if every customer is a Promoter). A positive NPS (>0) is generally seen as good, and an NPS of +50 is considered excellent.
NPS also helps companies identify areas of improvement by analyzing feedback from Promoters, Passives, and Detractors, gauging customer loyalty and enhancing brand trust.
Stop Wasting Time on Reports. Get Marketing Insights Faster & Drive Results.
Why Passives Matter
NPS Passives capture those customers who are neither highly satisfied nor dissatisfied. By tracking Passives, businesses gain insights into a substantial segment that could potentially be swayed toward becoming brand advocates. Otherwise, there’s a risk of Passives becoming dissatisfied and converting to Detractors.
Passives may highlight where a product or service meets expectations without exceeding them. Leveraging this data is key for refining marketing strategies, tailoring messages, and driving customer satisfaction levels upward.

Factors That Affect the Number of Passives
Passives are customers who sit on the fence–they’re neither fully satisfied nor dissatisfied. This lukewarm stance provides a unique opportunity for companies to refine their strategies and turn Passive customers into brand loyalists.
A customer's experience–from initial awareness through post-purchase support–greatly influences their satisfaction levels. Any friction or disjointed experiences may prevent a customer from becoming a Promoter.
NPS survey responses offer direct insights into the aspects of the customer experience that may need improvement. Use this feedback to measure customer satisfaction and make improvements (e.g., being more price-sensitive for a specific product or service).
A well-designed NPS survey impacts the number of Passives. NPS surveys need to be concise, relevant, and timely to encourage honest feedback. The way questions are framed may influence how customers perceive their experience and how they respond.

How Passives Relate To Other KPIs
Passives offer a more layered understanding of customer experience and campaign effectiveness. For instance, consider Customer Acquisition Cost (CAC). When analyzed alongside Passives, there’s a clearer understanding of whether marketing spend is efficient in driving customer acquisition and satisfaction.
Similarly, its correlation with Customer Lifetime Value (CLV) provides insights into the potential long-term value and loyalty of this customer segment. In addition, Passives’ relationship with Engagement Rates gives a clearer picture of how well content and campaigns resonate with this group.
Higher engagement among NPS Passives could signal untapped potential for converting them into Promoters. On the flip side, low engagement might mean reviewing a content strategy or optimizing the customer journey.
We use surveys, interviews, focus groups, and observation to gain valuable insights. Surveys are great for collecting quantitative data on an issue, while in-depth interviews let us get more personalized feedback. With this information, we can build a better understanding of our target niche and better serve its needs.
How To Calculate Passives
To measure Passives, focus on customer feedback which is typically gathered through NPS surveys. Passives are those who provide middle-range scores–neither high nor low.
For instance, on a 0-10 scale (where 0 is extremely dissatisfied and 10 is extremely satisfied), Passives often have an NPS score between 7 and 8. This segment reflects customers who are moderately content but not enthusiastic enough to be Promoters.
Passives Formula Example
What Is an Acceptable Percentage of NPS Passives?
An acceptable percentage of Passive customers typically ranges from 10% to 20%. These individuals are still engaged to some extent but may not be actively participating or advocating for your brand.
A score that’s closer to 10% indicates a highly engaged audience with minimal passivity. A score closer to 20% suggests a healthy balance between active and passive engagement.
What Is a Bad Percentage of NPS Passives?
On the other hand, a bad percentage of Passives is above 20%. This could imply that a significant portion of the audience is disengaged or indifferent to a brand.
Addressing this issue is crucial as it may negatively impact marketing efforts and overall business performance. Further, there’s also a risk of Passives crossing over to competitor brands or becoming Detractors.
How To Set Benchmarks and Goals for NPS Passives
Agencies should first analyze historical data, observe trends, and establish a baseline for Passives. Following this, create benchmarks and goals that tie into broader business objectives such as revenue or customer retention targets. This approach is useful to set tailored, data-driven benchmarks that reflect a client’s unique customer base.
It’s also beneficial to consider the fluidity between customer segments. By tracking how Passives transition to Promoters or Passives, there’s greater insight into the customer journey.

Why Passives Matter to Clients
For clients, understanding Passives provides insight into a significant segment of their customer base that often goes unnoticed. These are customers who are neither fierce advocates nor vocal critics. Tracking Passives helps clients identify opportunities to nudge this group towards becoming happy customers (i.e., Promoters).
High numbers of Passives might indicate a need for more engaging or personalized customer interactions. Since Passives are not actively dissatisfied, they represent a ripe opportunity for conversion into loyal customers. This metric also aids in understanding the overall health of the client's brand perception in the market.

Why Passives Matter to Agencies
For agencies, Passives are a key metric that indicates how well marketing strategies are working. A low number of Passives may suggest that the agency's efforts are successfully drawing customers toward greater satisfaction and more vocal approval. It also shows the potential to create more Promoters.
On the other hand, a high number of Passives may signal that the current strategies might be too generic, failing to evoke a strong emotional connection from customers. This metric helps agencies to fine-tune their tactics, create more impactful campaigns, and solidify their role as strategic partners in measuring customer satisfaction.

Turn Data Chaos into Client Success Stories with AgencyAnalytics.
Best Practices When Analyzing and Reporting on Passives
A comprehensive understanding of Passive customers is essential for pinpointing areas of improvement. Here are reporting tips to analyze Passives and create relevant recommendations.
Ensure Data Accuracy
Reliable data collection methods, such as well-structured Net Promoter Score surveys, ensure the validity of the Passive score.
Track Passive Customers Over Time
Monitor Passives to understand whether marketing strategies are engaging customers and enhancing customer satisfaction, or if adjustments are needed.
Benchmark Passives Across Channels
Compare Passives across different channels (social media, email, etc.) to reveal which platforms are more effective in engaging customers.
Decipher Trends in Passive Data
Monitoring sudden spikes or drops in the number of NPS Passives will assist in recognizing factors that influence the customer experience.
Contextualize Passive Scores
Are customers wary after a recent rebrand or product pivot? Place Passives in the broader context of customer feedback and market conditions for deeper understanding.
Suggest Steps Based on Passives
Include actionable recommendations to transform Passives into Promoters. Advise on strategies to engage this group more effectively (e.g., incentives, more tailored content).
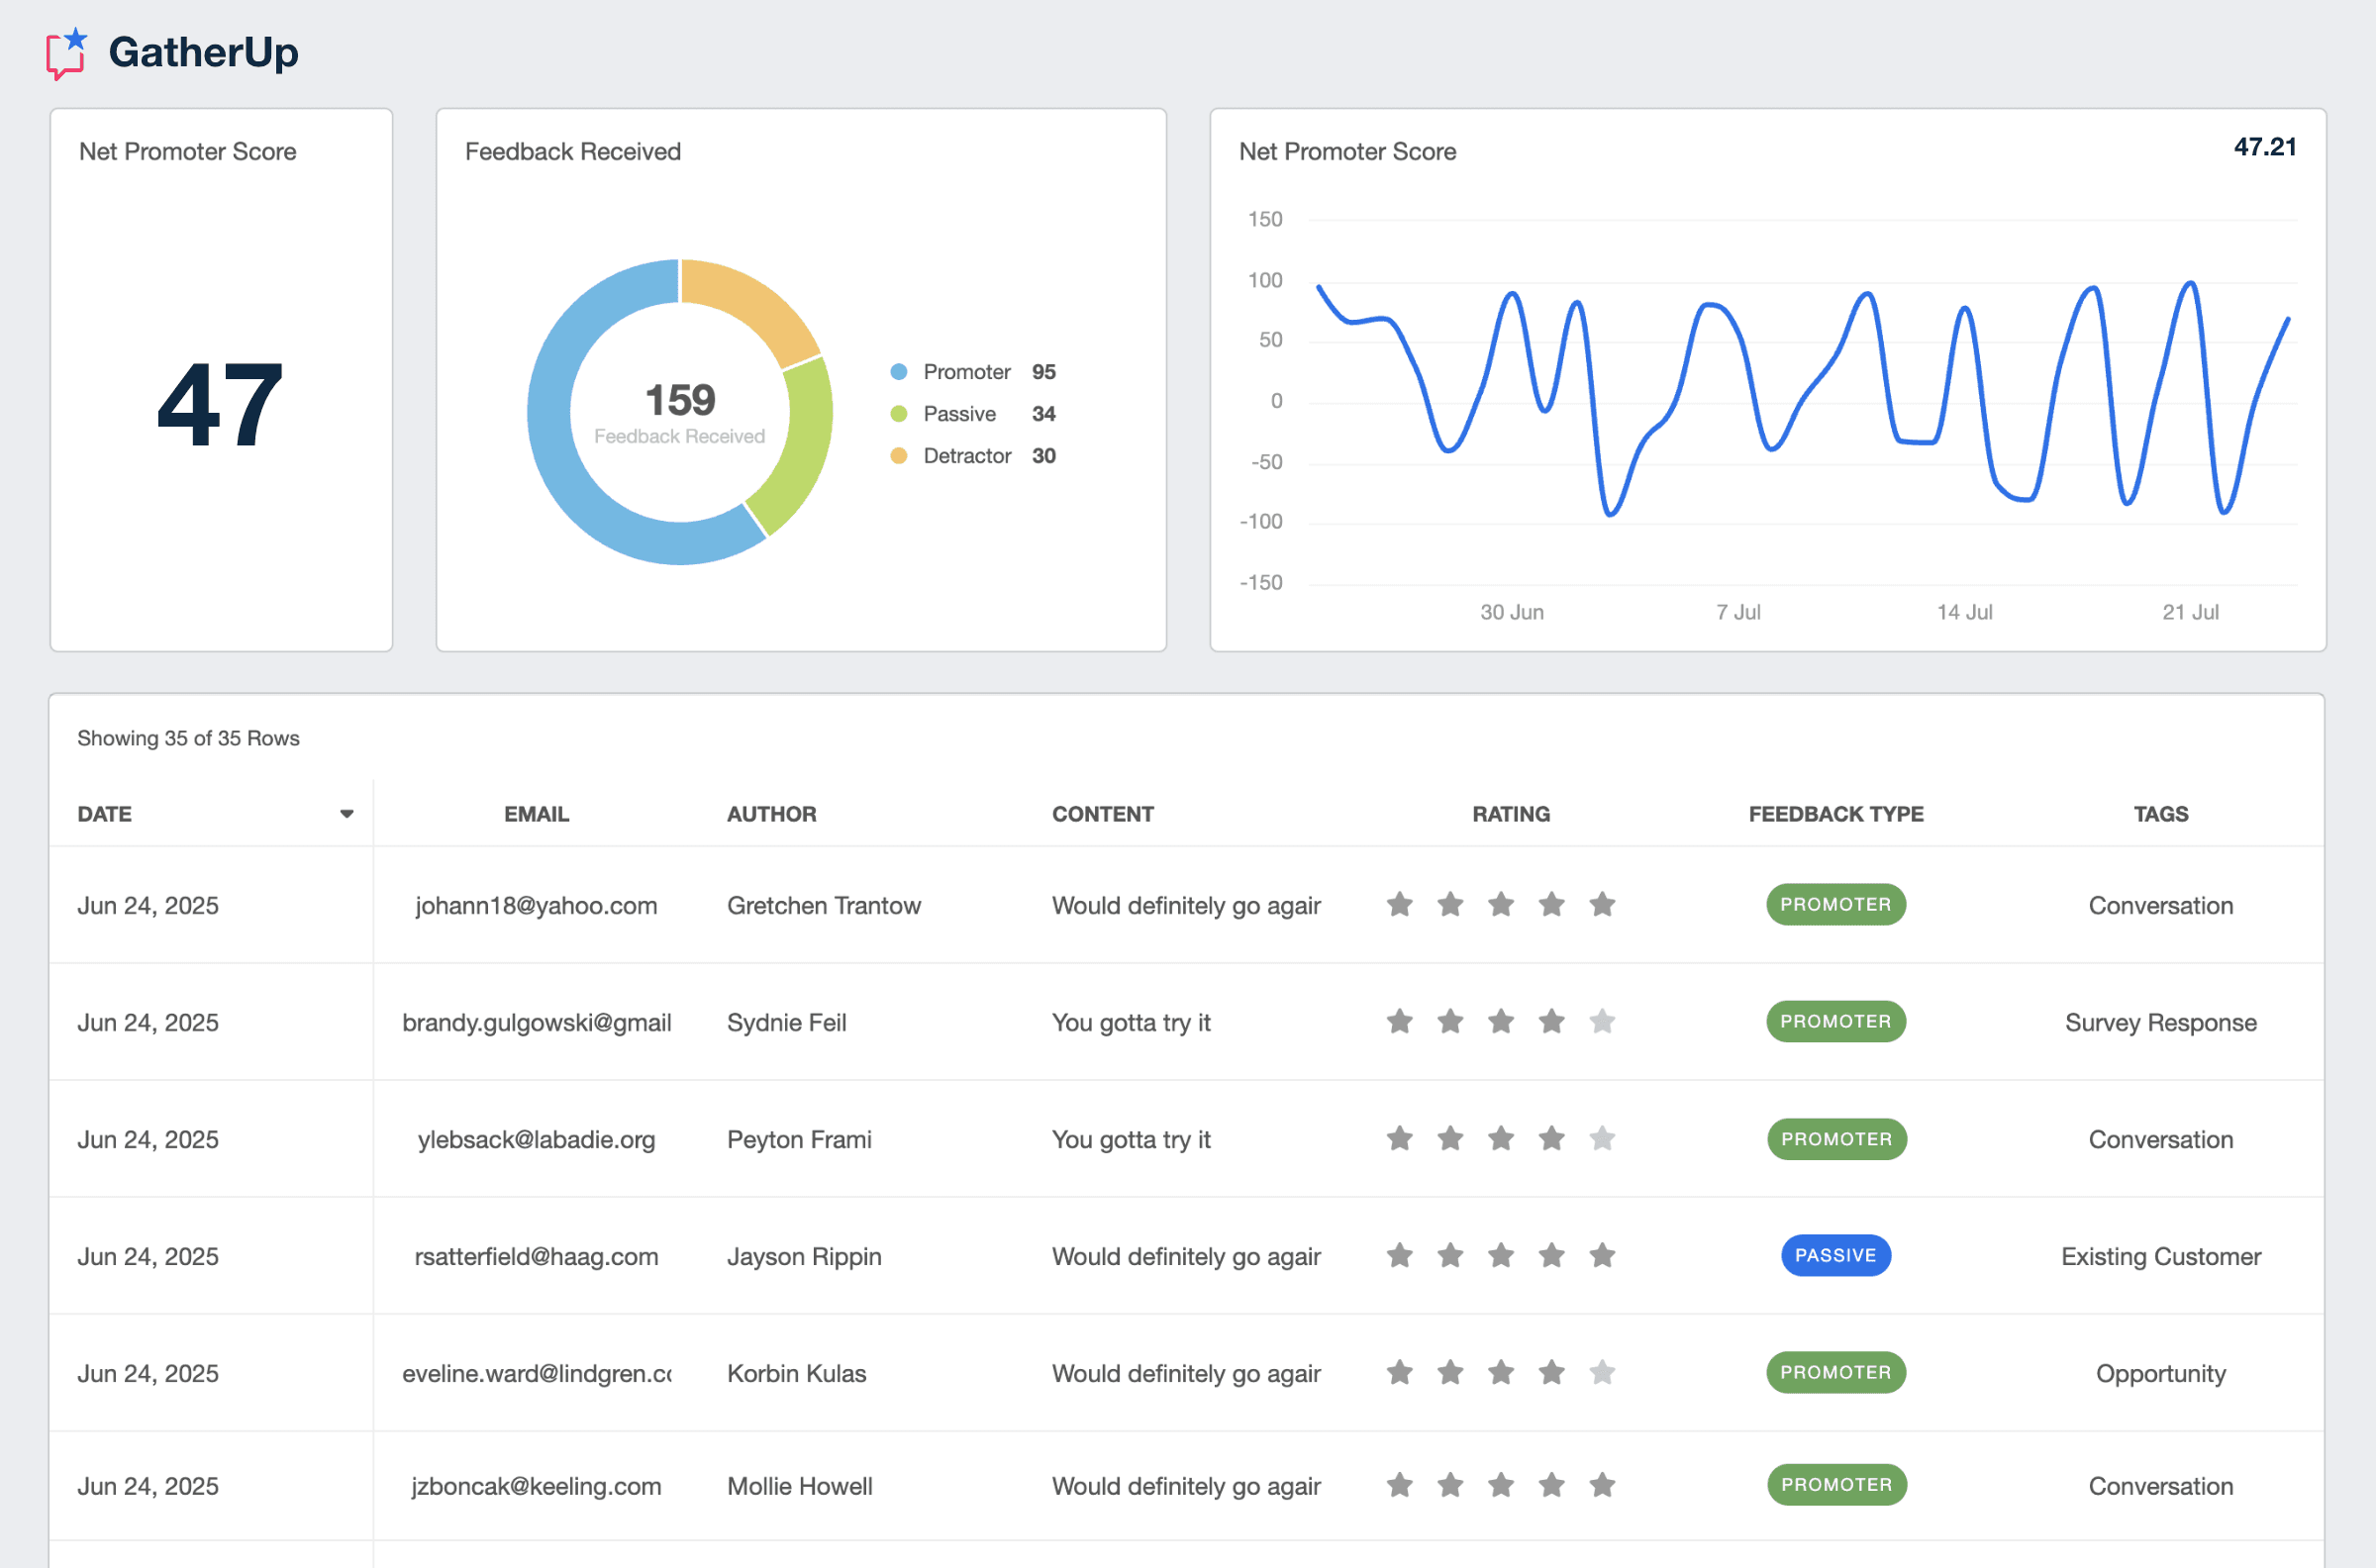
GatherUp Dashboard Example
Related Integrations
How To Turn Passives Into Promoters
Turning Passives into Promoters requires a strategic approach. Use these tips to transform neutral feedback into enthusiastic endorsement.
Enhance Communication
Strengthen communication channels to ensure Passives feel heard and valued. Use prompt, clear, and personalized responses to their queries.
Gather Detailed Feedback
Actively seek detailed feedback from Passives to understand their needs. Use this information to make improvements in products and services.
Exclusive Offers
Create exclusive offers or rewards tailored to the Passive segment. These could be loyalty program benefits, special promotions, or early product access.
Related Blog Posts
See how 7,000+ marketing agencies help clients win
Free 14-day trial. No credit card required.


