Table of Contents
QUICK SUMMARY:
2024 was a year of innovation and growth at AgencyAnalytics, focused on helping agencies streamline workflows, scale efficiently, and deliver smarter insights. With new tools (like AI-driven insights and benchmarking), we aimed to simplify reporting and enhance client communication during a time of rapid industry change. This article explores the key updates agencies have benefitted from in the AgencyAnalytics platform and their use cases.
As 2024 comes to a close, we’re taking some time to reflect on an incredible year of growth and innovation at AgencyAnalytics.
No, we’re not about to share a year recap video with generic corporate greetings or choreographed memorable moments. Instead, we’re here to share all the shiny new updates you’ll find in the AgencyAnalytics platform–ones that elevate your reporting game even more.
It’s been a year of new marketing challenges (let’s be real). But with those hurdles came opportunities to evolve, adapt, and support agencies like yours even better. Whether it’s generating instant AI-driven insights or benchmarking client performance against industry standards, every new feature has been designed with your agency in mind.
Needless to say, we’re excited about our product roundup for 2024 and how these features are helping agencies stay more agile. In this article, we’ll explore all the new updates in the AgencyAnalytics platform, along with how to maximize their fullest potential.
A Year-End Review Steeped in Innovation
Over the past year, we focused on three key priorities: Enhanced Efficiency, Increased Scalability, and Smarter, Data-Driven Insights.
With exciting developments like Generative AI and those never-ending algorithm changes, agencies have had plenty to juggle. And while change often brings uncertainty, one thing shouldn’t waver–the reporting experience delivered to clients.
To meet evolving needs, we’ve introduced a few different ways to lighten the load, keep things running smoothly, and ensure your reporting process remains seamless.
In 2024, we focused on empowering agencies to do more with less effort. Every new feature—whether it was AI-driven insights, benchmarking, or anomaly detection—was thoughtfully crafted to address the real challenges agencies face every day. Seeing our customers harness these tools to unlock growth, gain insight into data and strengthen client relationships has been incredibly rewarding.
Jesse Smith, Chief Product Officer, AgencyAnalytics
The Top 10 AgencyAnalytics Features Introduced in 2024
Without further ado, here’s our year in review and how these 10 key updates are transforming how agencies work.
1. Ask AI
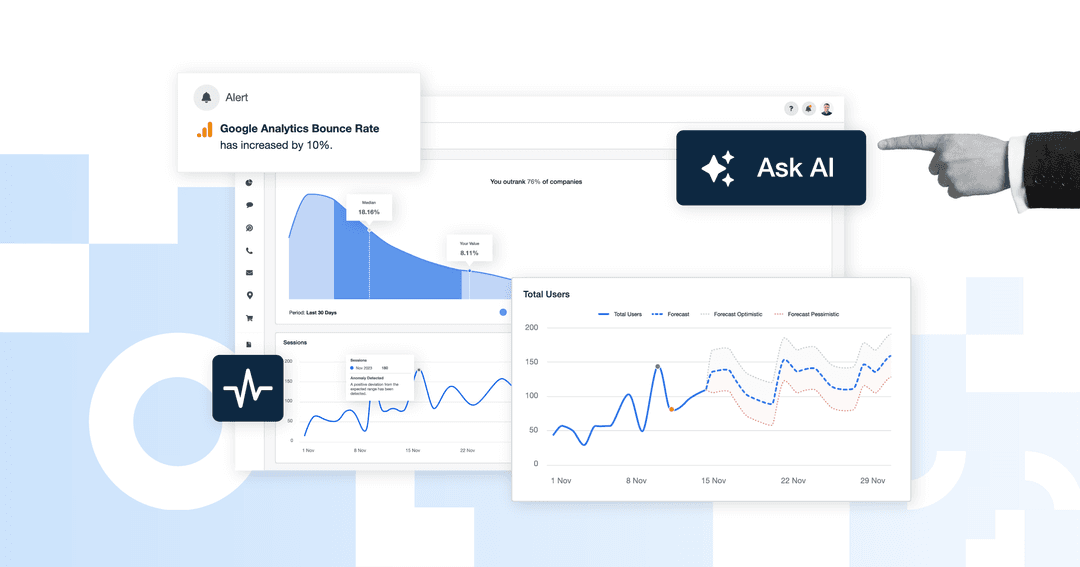
AI is more than a buzzword. It’s a way to optimize workflows, enhance decision-making, and drive measurable results. It’s precisely why we’ve rolled out Ask AI–a nifty, time-saving way to generate actionable insights about client data.
With Ask AI, data interpretation is no longer an arduous task or something to dread. Instead, you’ve got an on-demand analyst who’s just a click away. Quickly assess large volumes of data, form relationships between metrics, and share valuable takeaways that matter. For a more detailed overview, check out the recap video below.
Ask AI is built directly into AgencyAnalytics dashboards—to access it, click on the button at the top right corner.
Then, choose from one of the pre-defined prompts below to get split-second insights. Uncover overlooked campaign accomplishments, areas for improvement, and even potential opportunities to capitalize on–it’s that straightforward.
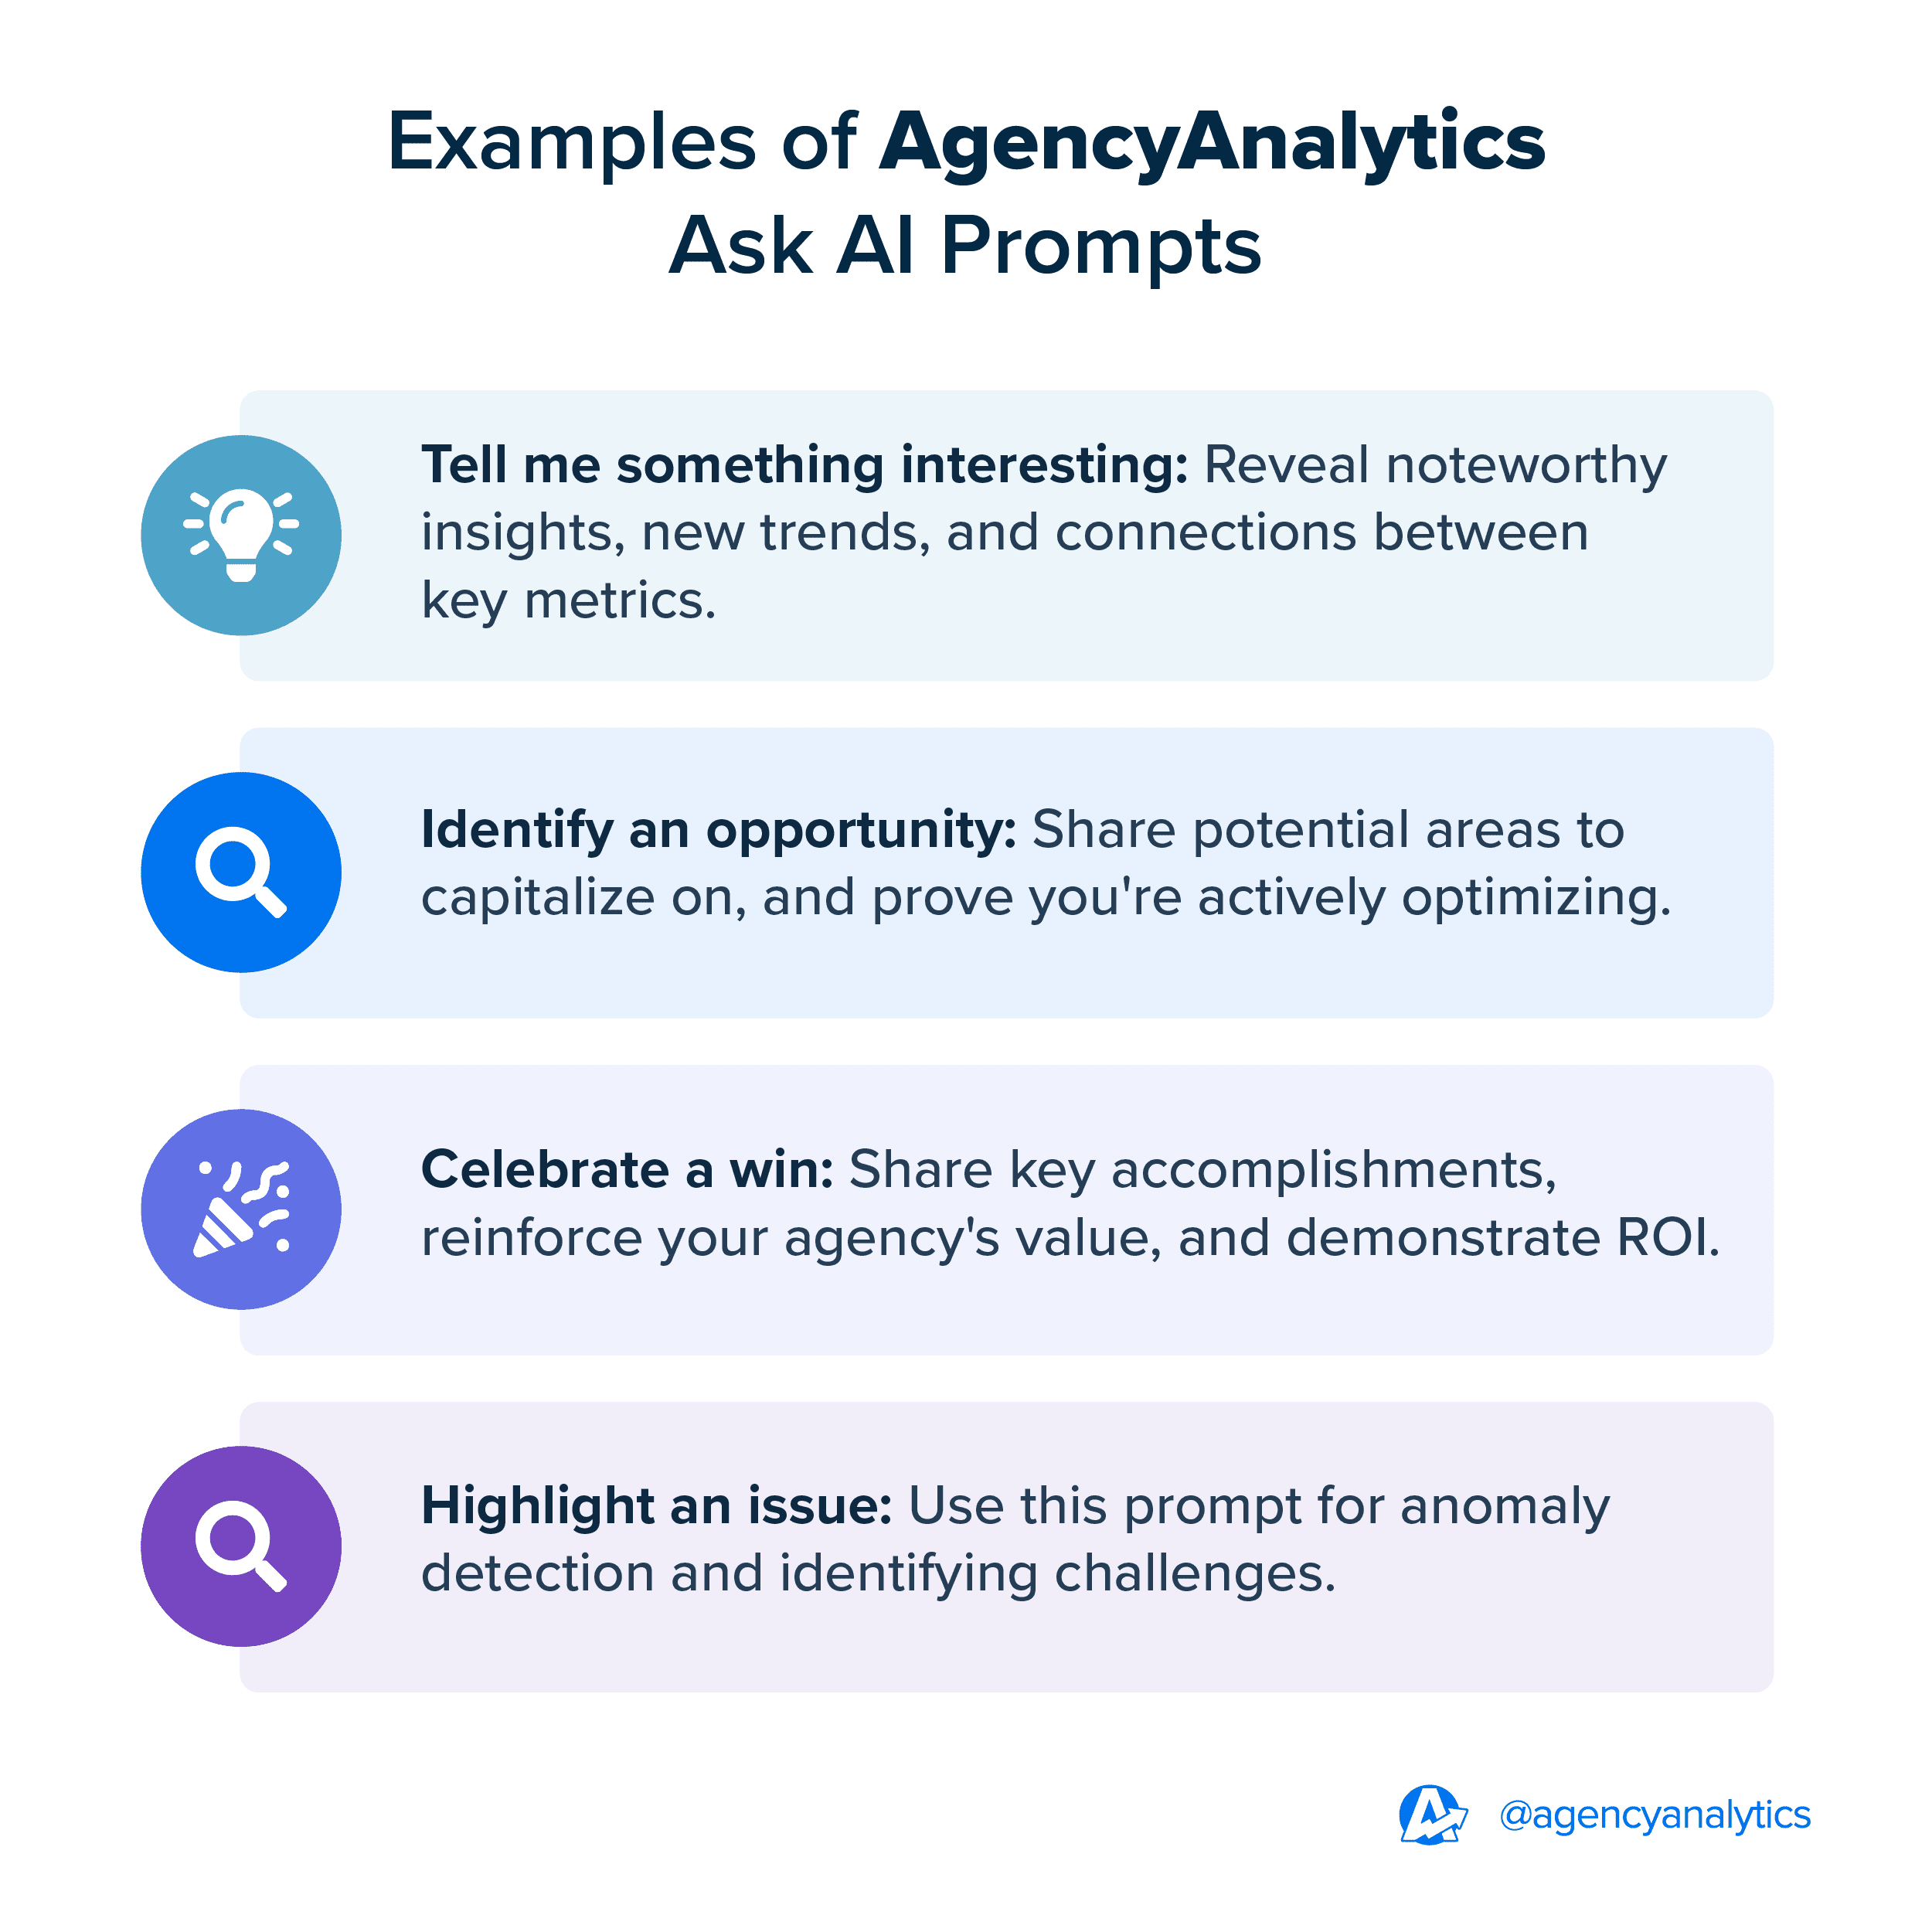
Need a more specific insight (e.g., an explanation about a particular social media metric)? No problem–simply type a question in the text box. Dig deeper into the data or ask for further context; it’s all up to you.
2. AI Summary
Your clients are busy–it’s just a fact.
Realistically, they don’t always have time to explore their dashboard or report in tremendous detail. To make the most of their time (and yours), we’ve introduced AI Summary–a powerful complement to the Ask AI feature.
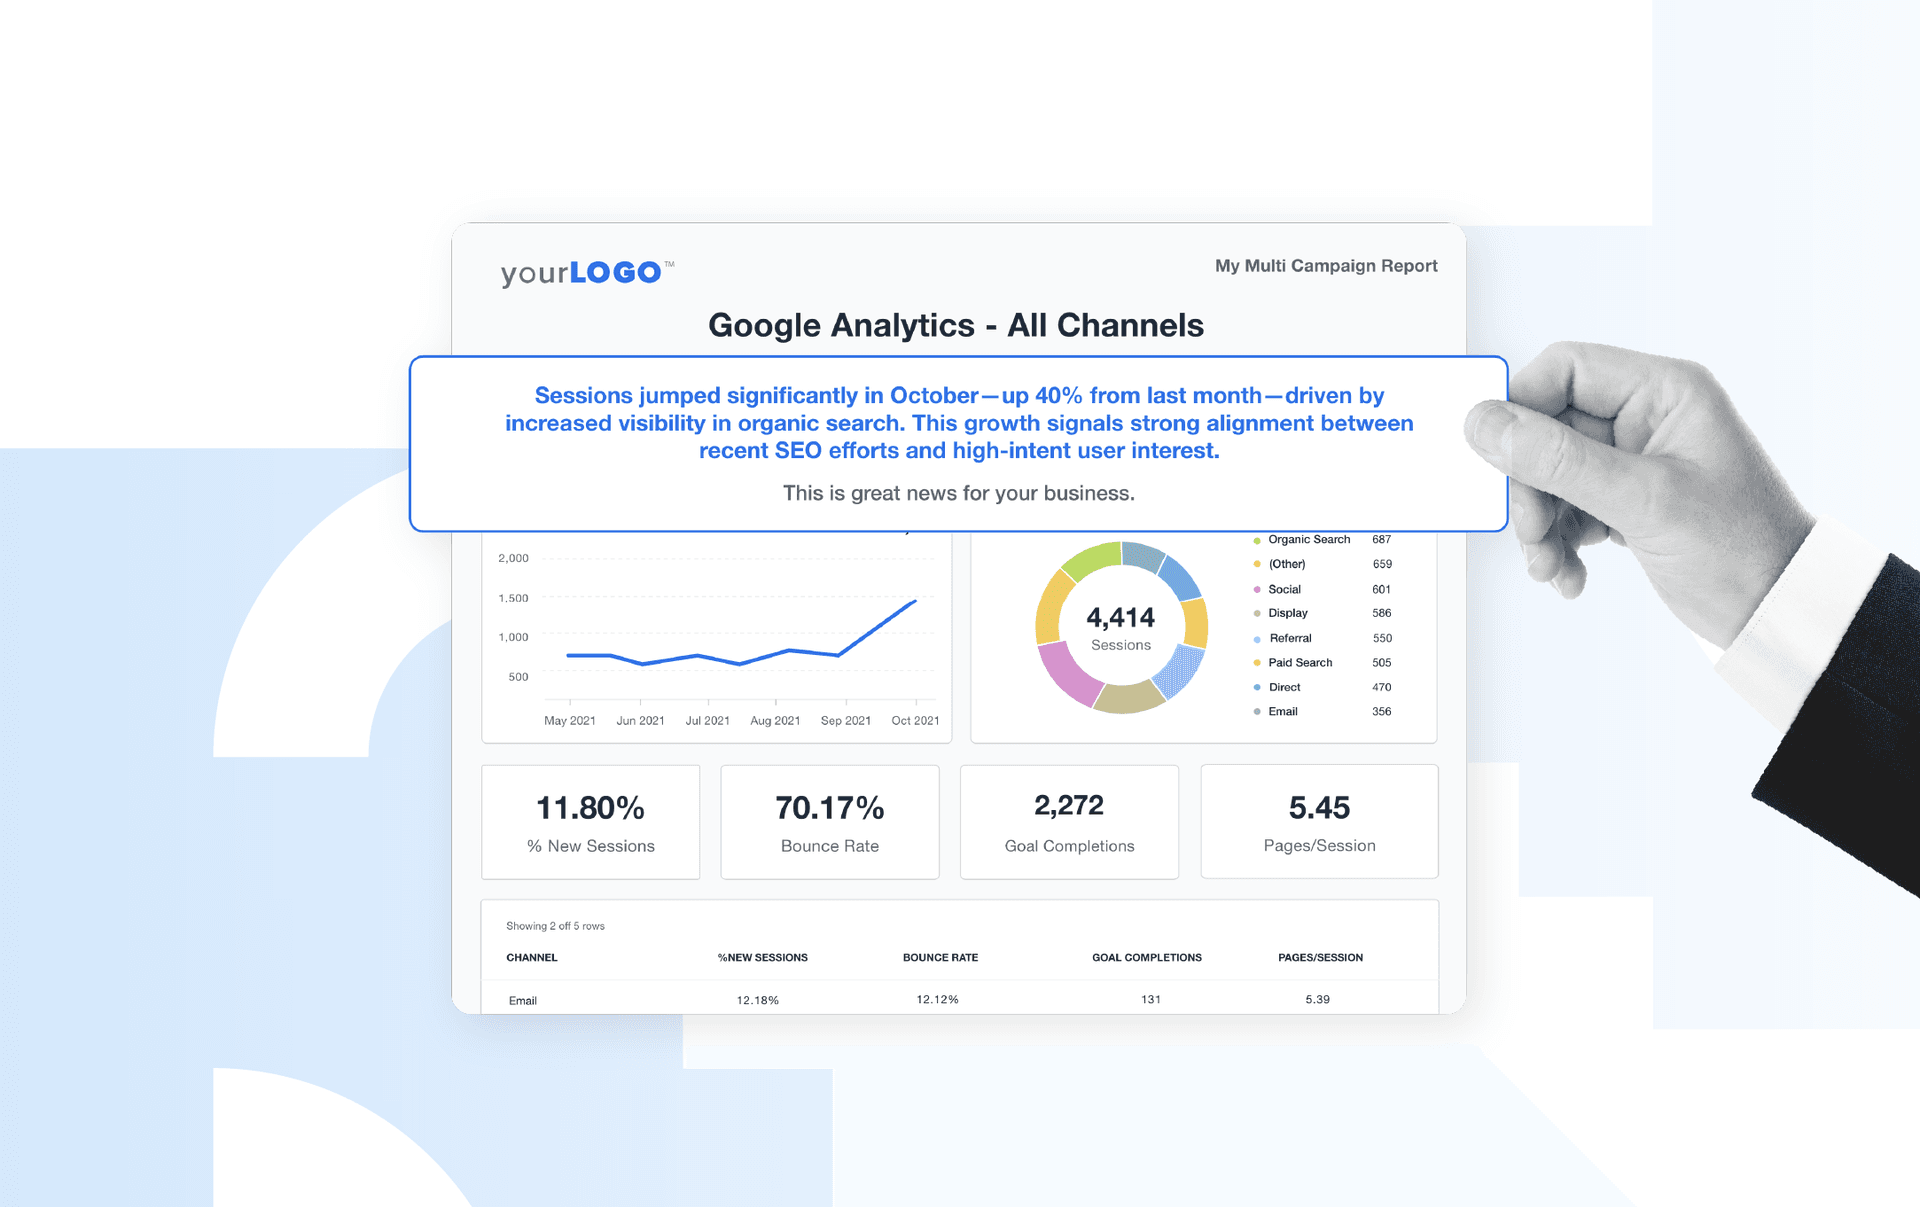
Rather than manually crafting an executive summary, use AI Summary to auto-generate a brief text overview of campaign performance. Quickly weave data storytelling into client reporting and win back more time to focus on high-level, strategic deliverables.
Using the AI features in AgencyAnalytics helps us summarize a client report much faster than reading through results, typing up an email, and sending it to the client. The predictive analytics in Ask AI has certainly increased our productivity, helping us to do things much faster.
Kevin Watts, Founder, Raincross
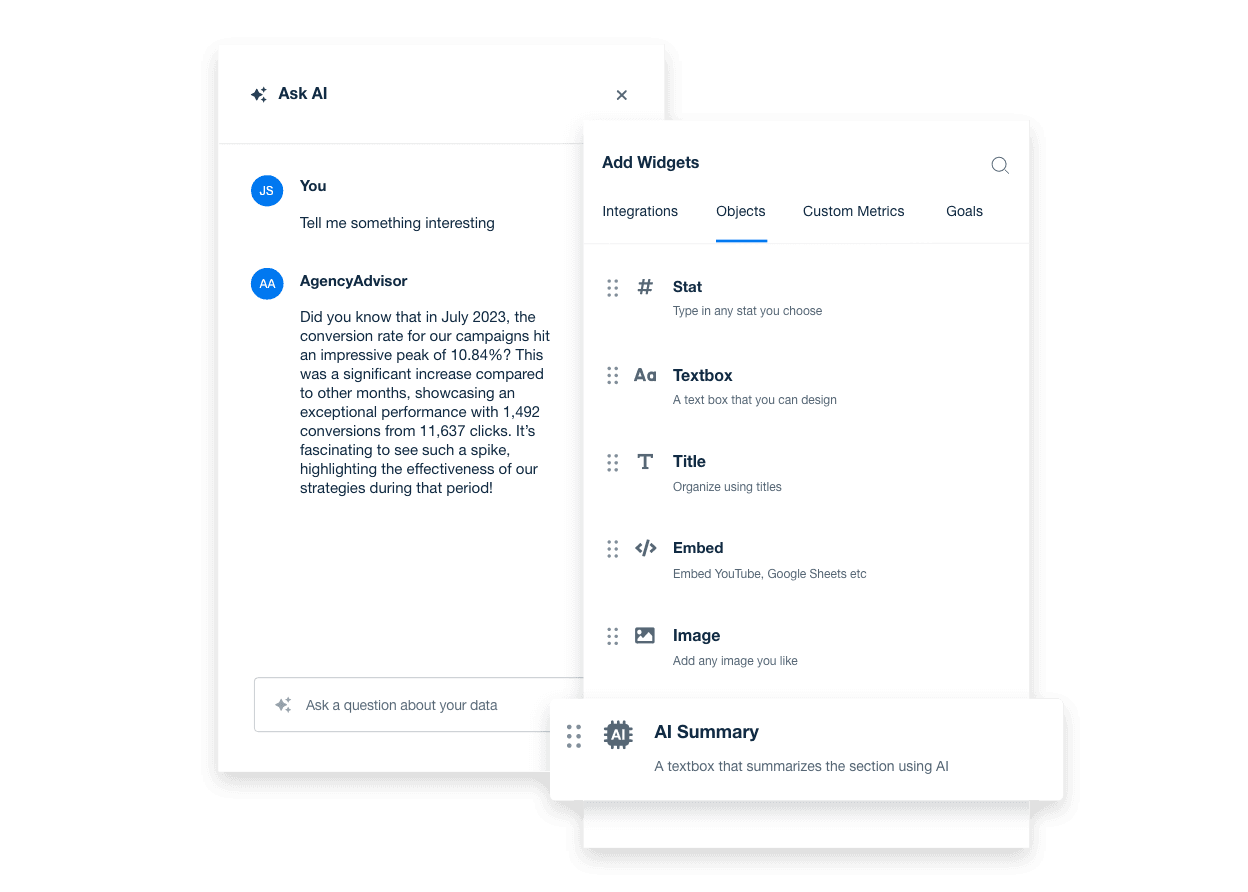
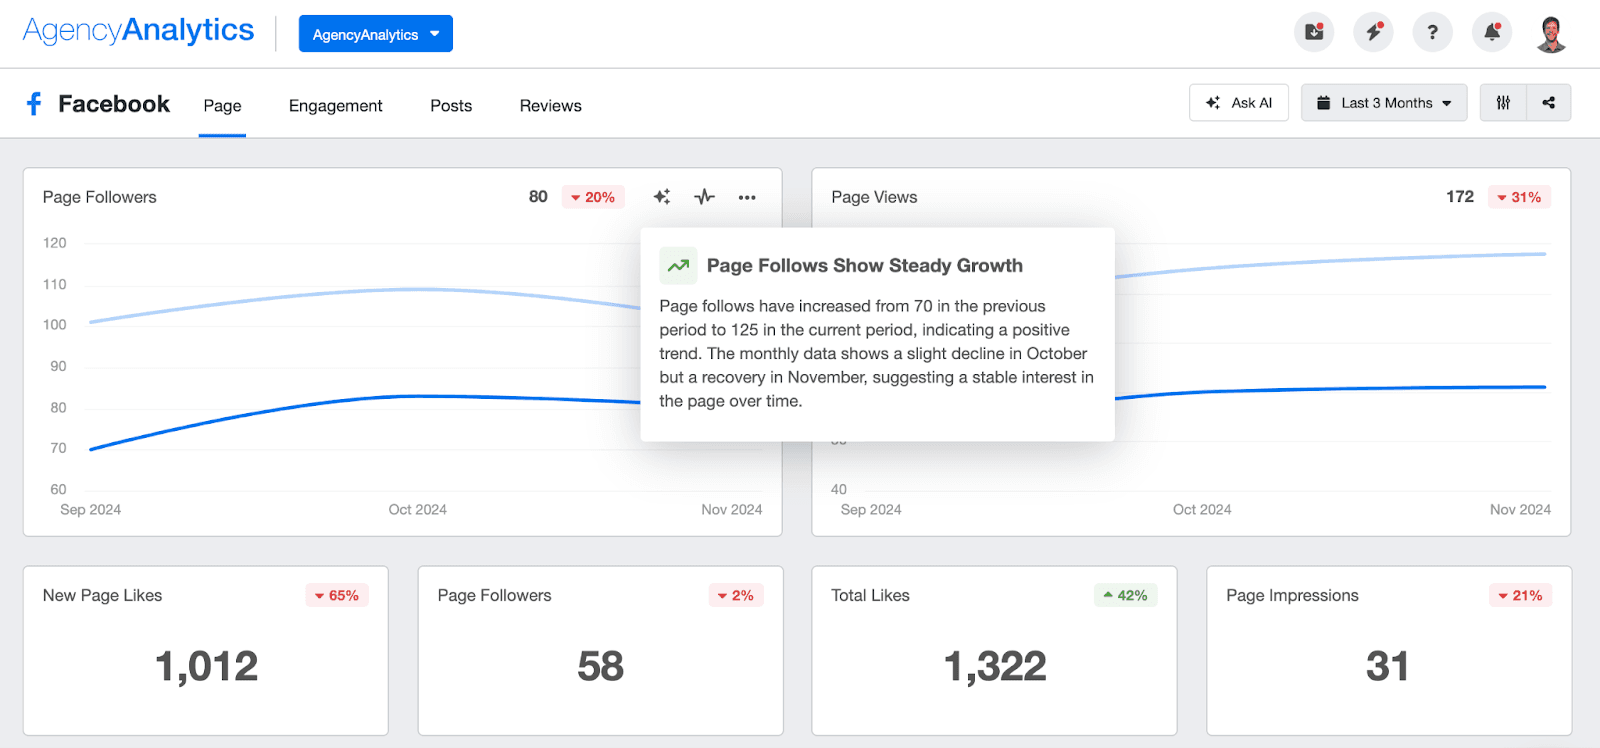
That’s not all–we’ve also rolled out AI-powered Widget Summaries! It’s an automatic way to analyze the data within each widget and generate concise, actionable takeaways. This unlocks more granular insights, saving time on data interpretation and enabling faster decision-making.
3. Benchmarks
How do you know if client campaigns are truly hitting the mark?
Introducing our new Benchmarks feature—a powerful way to gain a macro view of performance. With data sourced from our 7,000+ customer base, this feature is a part of our Marketing Performance Insights suite, which leverages a wealth of first-party insights.
With up-to-date marketing performance benchmarks, instantly see how client performance compares to others across industries and platforms. The best part? It’s integrated within your AgencyAnalytics account—no extra tools or data wrangling required.
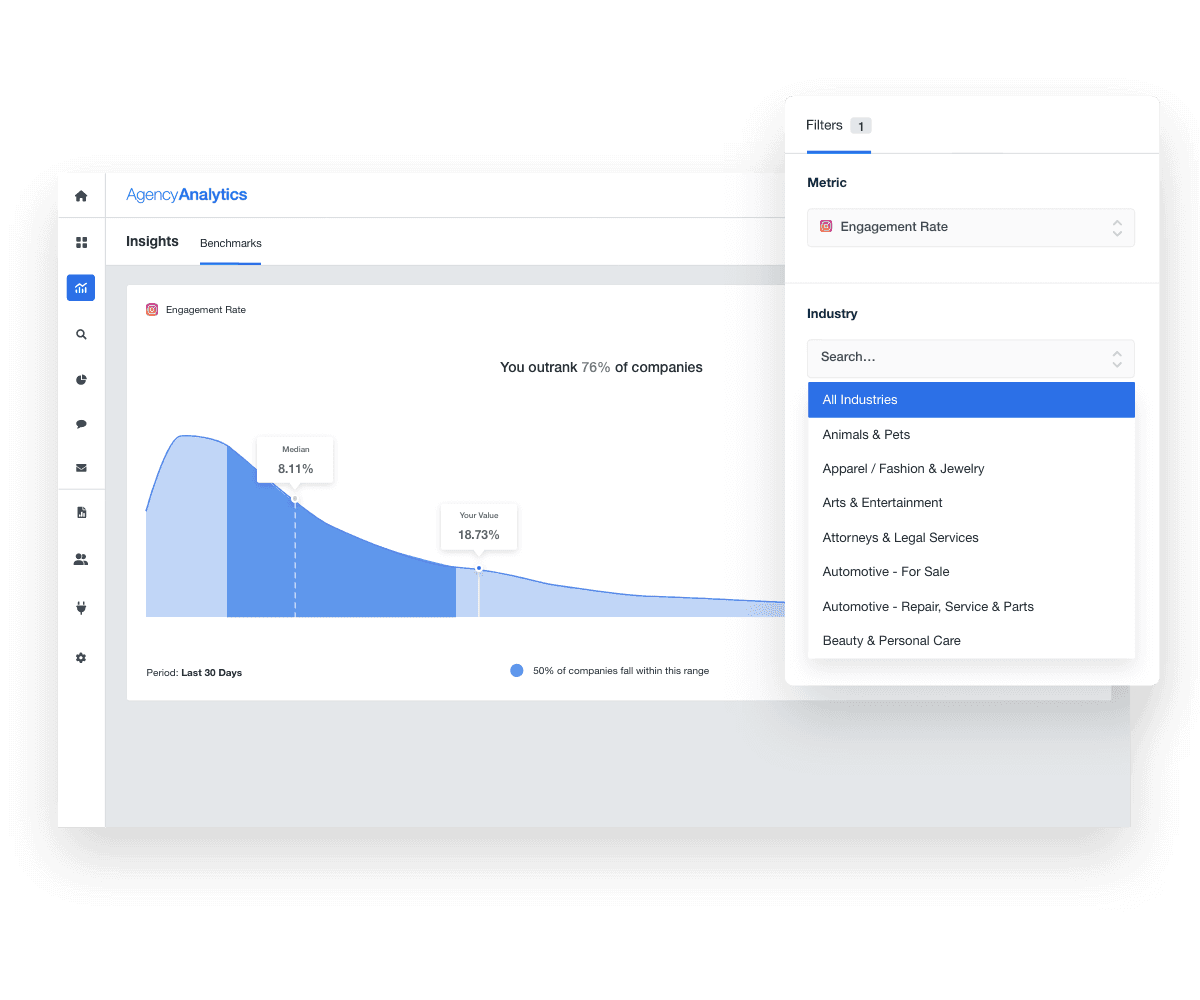
Benchmarks display the middle value (median) of performance metrics from similar campaigns. This helps your agency see what’s “normal” for a client’s platform. You’ll then have the option to segment this data by industry, which provides tailored insights for specific verticals.
Plus, data is based on performance from the last 30 days, keeping the comparison relevant to current trends. Lastly, each Benchmark includes a confidence level; here’s how it applies to client campaigns.
High Confidence
What It Means: The benchmark is based on a large number of campaigns, which are then evaluated based on industry. This makes it highly reliable for evaluating your client’s performance.
Example: If an ecommerce client’s click-through rate (CTR) is 3.2% and the industry median CTR is 2.6% (with high confidence), you’re in an optimal position to state that their campaign is performing better than the norm.
Medium Confidence
What It Means: The benchmark is based on fewer campaigns or slightly more varied data. It’s still reliable enough to show trends but may not capture nuances specific to niche industries or unique strategies.
Example: If a SaaS client’s lead gen campaign has a conversion rate of 8% and the industry median is 7% (with medium confidence), share the comparison while noting some variability in the data.
Low Confidence
What It Means: The benchmark is based on limited data points or campaigns with significant variability. It’s best used as a directional insight rather than a definitive comparison.
Example: If a local restaurant’s ad has a cost per thousand (CPM) of $5.50, and the industry median is $6 (with low confidence), it indicates that the campaign may perform well over time. However, caution the client that the comparison is simply a guideline due to limited data.
Sound like a lot? No need to remember this by heart; just click “How to read a benchmark” at any time.
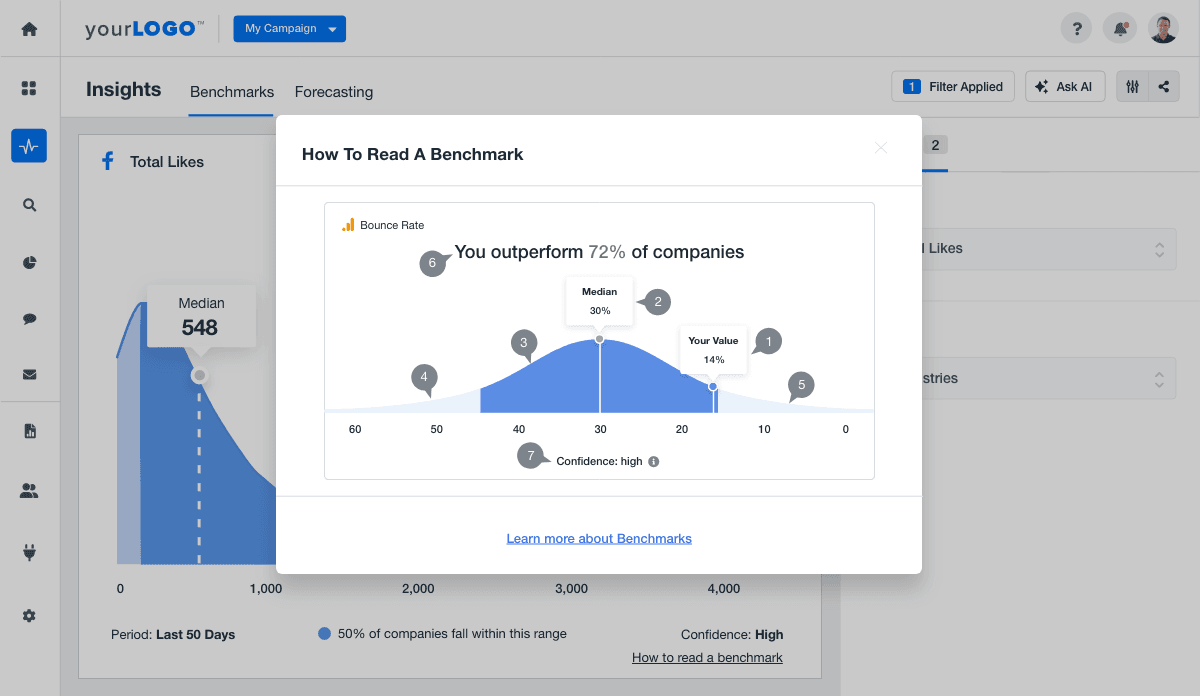
To sum up, Benchmarks aren’t just about numbers—they provide critical "big picture” thinking, allowing you to have more insightful conversations with clients.
Agency Tip: Use Benchmarks to identify hidden opportunities. If your client’s results are slightly below the industry standard, it’s a great starting point for suggesting improvements to help them outpace competitors.
4. Anomaly Detection
Picture this: A client’s ad campaign has performed well for weeks. Suddenly, there’s a drop in click-through rate, which goes unnoticed (unfortunately). At the end of the month, it’s led to wasted ad spend, fewer incoming leads, and reduced confidence in your ability to drive results.
It’s not an ideal scenario by any means. Luckily, we’ve got a solution to these types of woes: Anomaly Detection. This feature automatically flags potential issues, allowing you to troubleshoot issues, identify campaign hiccups, and make timely adjustments. Use it to detect:
Sudden Drops in Key Metrics: Spot unexpected declines (e.g., dips in CTR, conversion rates, or other KPIs) before they impact overall performance.
Unusual Spikes in Performance: Identify impactful anomalies, such as overspending or minimal impressions. This may indicate inefficiencies (e.g., a cost-consuming bidding strategy) or errors in campaign settings.
Anomaly Detection helps your agency stay proactive, maximize resources, and consistently deliver strong results.
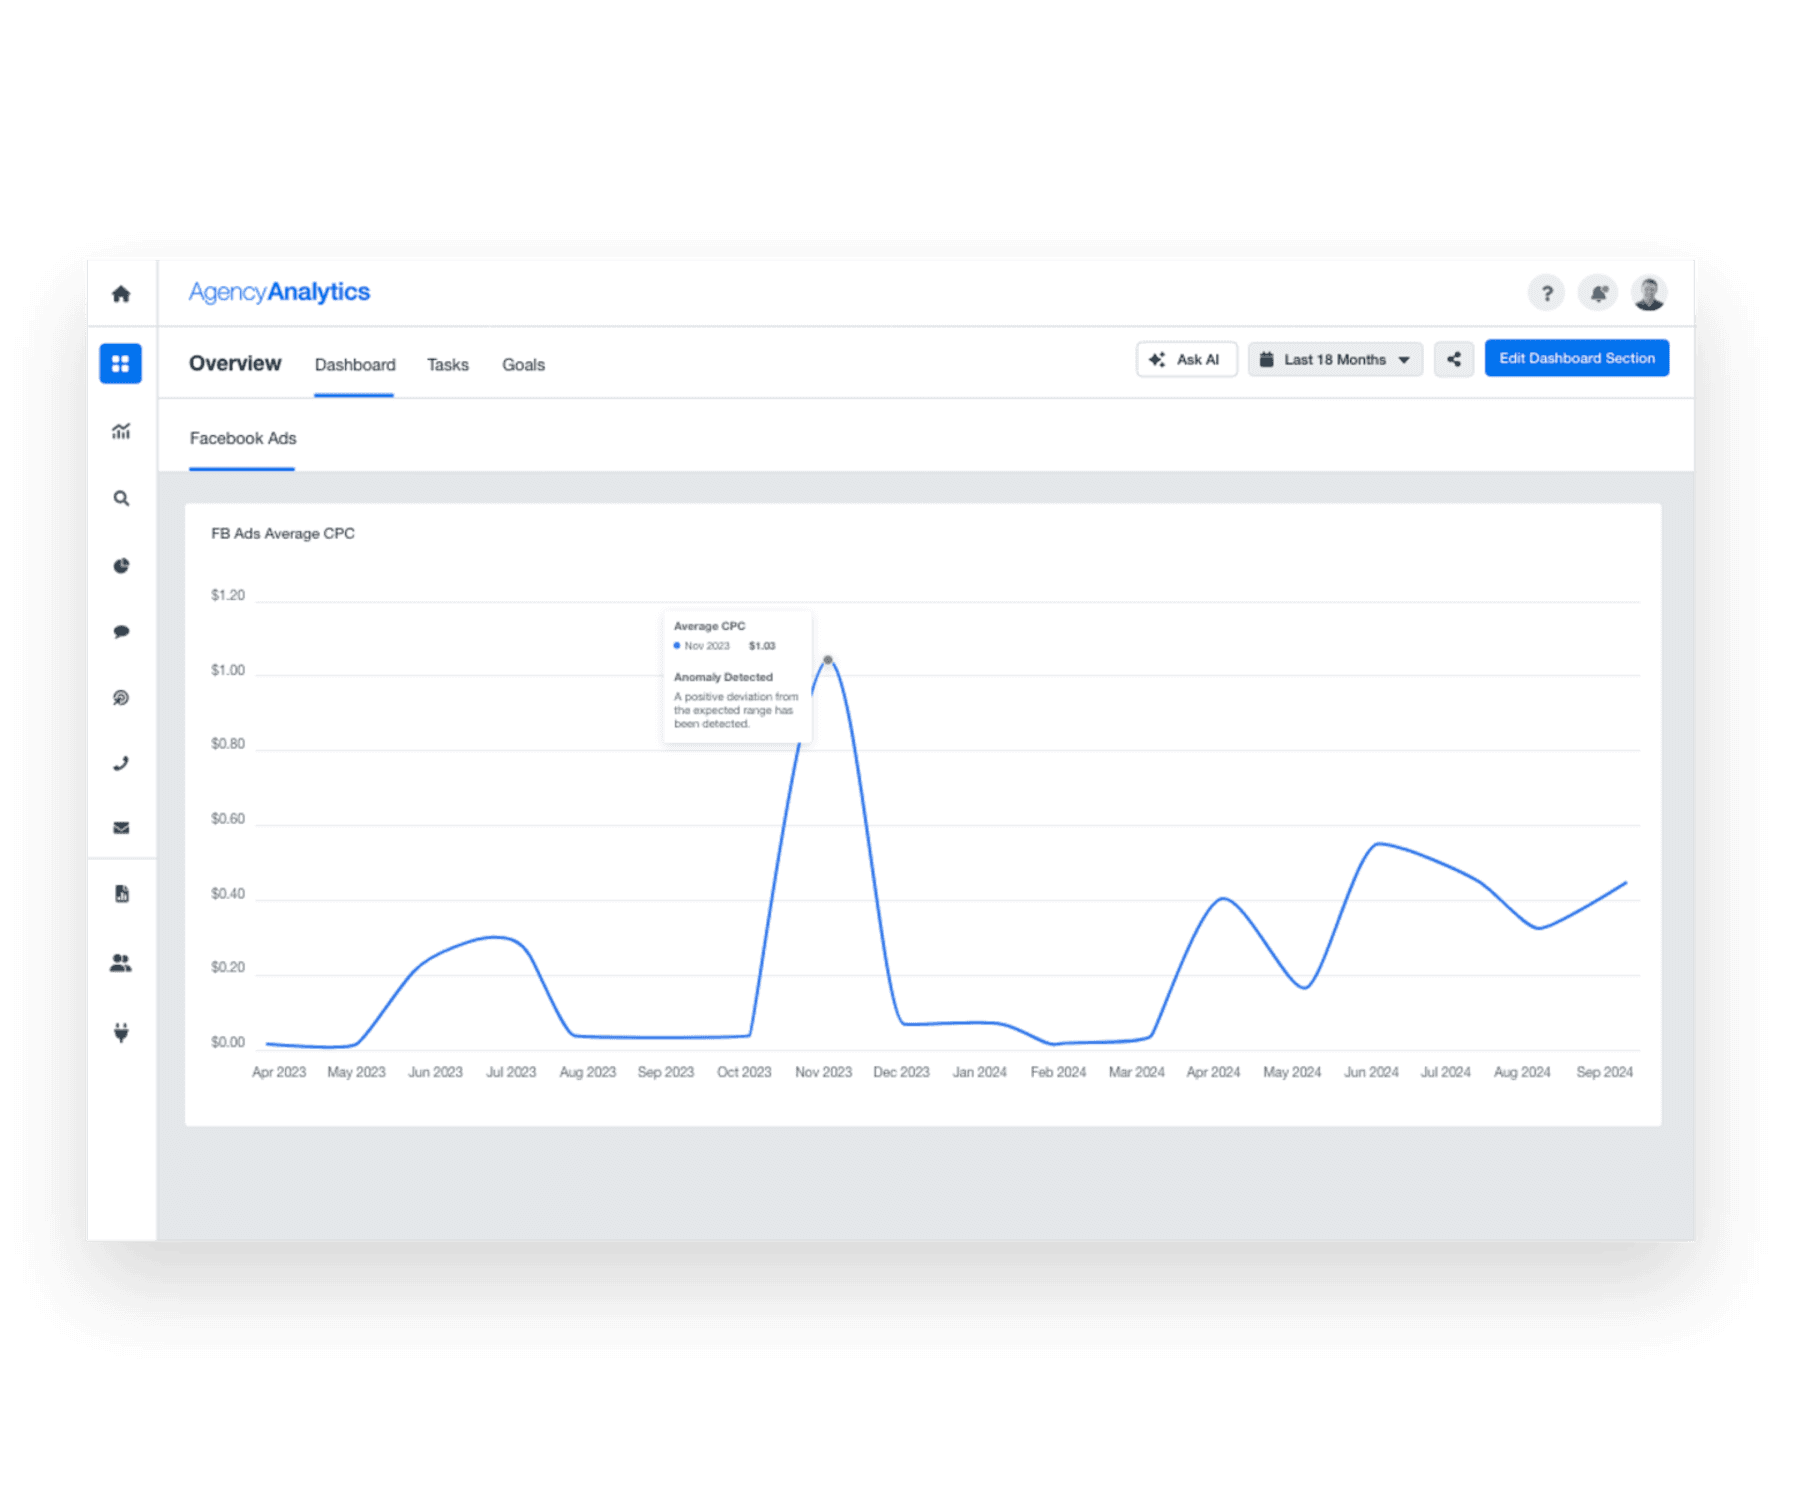
Pinpoint potential issues, demonstrate your proactive approach, and ensure campaigns yield positive results. Check out the data-driven Marketing Performance Insights in AgencyAnalytics–sign up for a free 14-day trial today.
5. Forecasting
What if there was a way to predict the future?
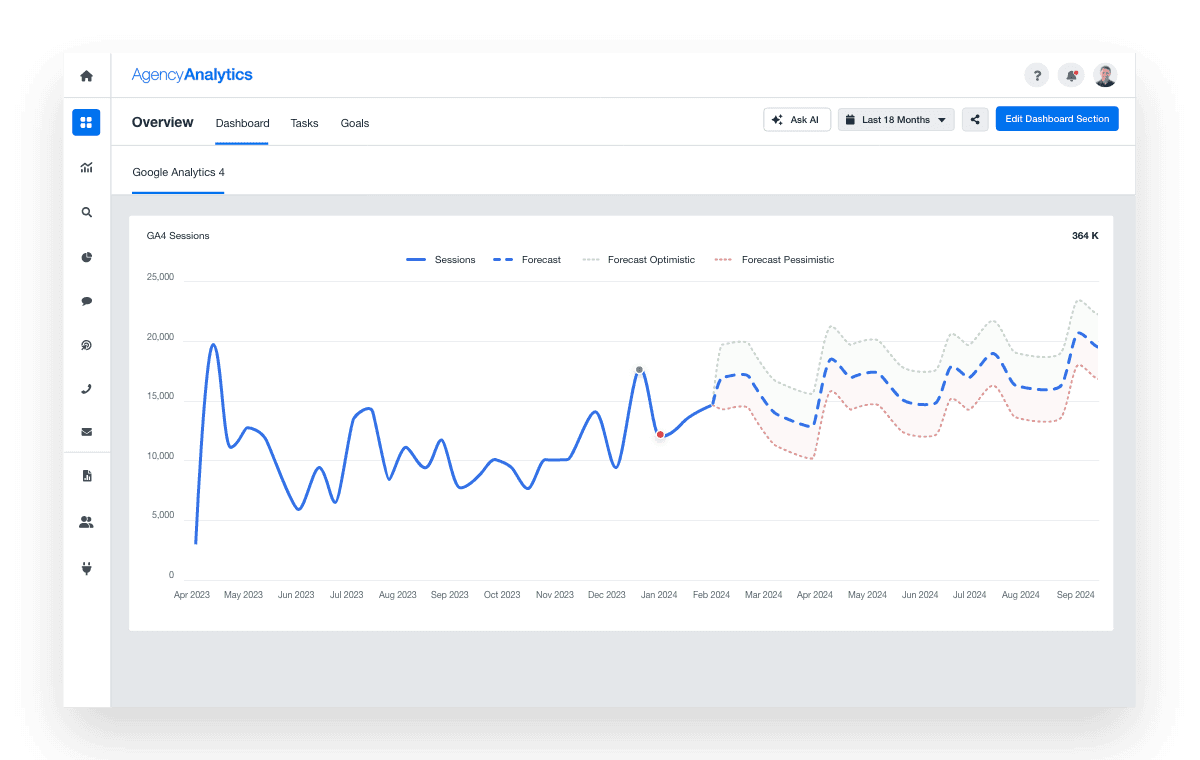
Well, we don’t exactly have a crystal ball, but we do have something almost as good: Forecasting. It’s a way to understand where client campaigns are headed, make informed predictions, and plan for upcoming opportunities or challenges. After all, looking at past data is only one part of the equation.
Essentially, this feature provides clients with a visual performance trajectory, helping them understand whether they’re on track to meet their goals and objectives. It reinforces the value of your work, too. Tie these projections to the strategies you’ve implemented and show how they’ll potentially lead to positive, long-term results.
6. Data Aggregation
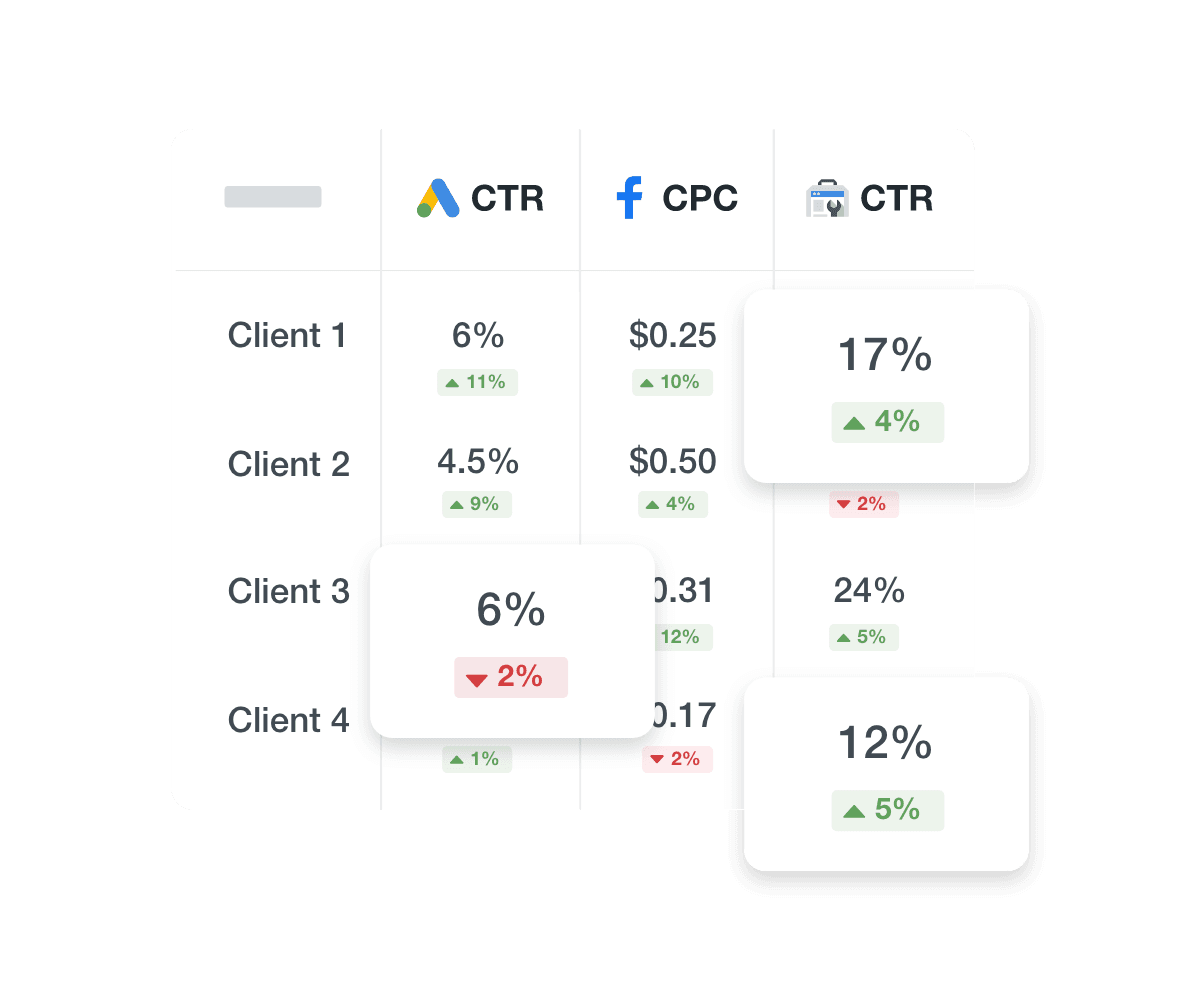
Quickly access multi-client performance summaries with the new Data Aggregation feature!
Instead of diving into each individual campaign, easily compare key metrics across clients, spot trends, and make informed comparisons.
Running PPC ads for multiple clients? Quickly see click-through rates across the board. Managing a slew of SEO campaigns? Instantly review organic traffic, keyword rankings, and backlink data for all clients in one view.
With up to three years of historical data, it’s easy to uncover long-term trends, assess multi-client performance, and keep a bird’s eye view of campaigns.
Also, think of your clients with multiple brands or locations (e.g., a clothing retailer or restaurant franchise). Oftentimes, they run multiple accounts within a single integration, each targeting a specific region, store, or product line.
The Data Aggregation feature combines metrics from all of these accounts into one unified view, showing totals or averages for the client as a whole. This makes it easier to analyze overall performance.
7. Alerts
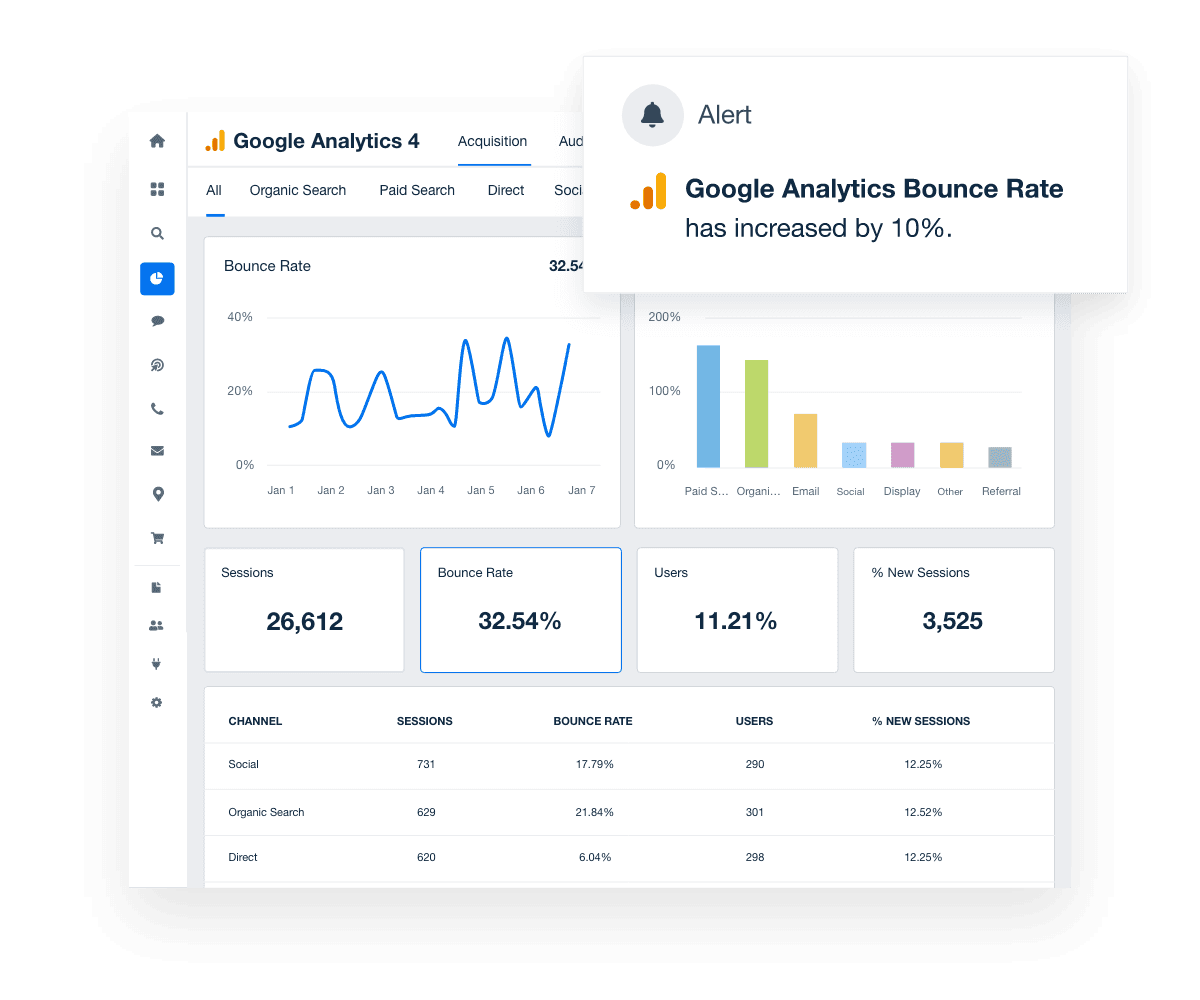
No more surprises. With Alerts, receive real-time notifications when something critical occurs. This lets your agency stay on top of client campaigns without constant monitoring.
Whether it's a budget nearing its limit, a sudden drop in conversions, or a significant change in performance, the Alerts feature ensures you’re always in the loop. This proactive approach empowers your agency to take immediate action, optimize campaigns, and prevent minor issues from becoming significant problems.
In addition to catching potential issues, use the Alerts feature to track key milestones toward larger performance goals. It highlights positive trends and smaller wins, which keeps progress on your radar.
8. Bulk Operations
Scaling your agency often means managing dozens—or even hundreds—of client accounts.
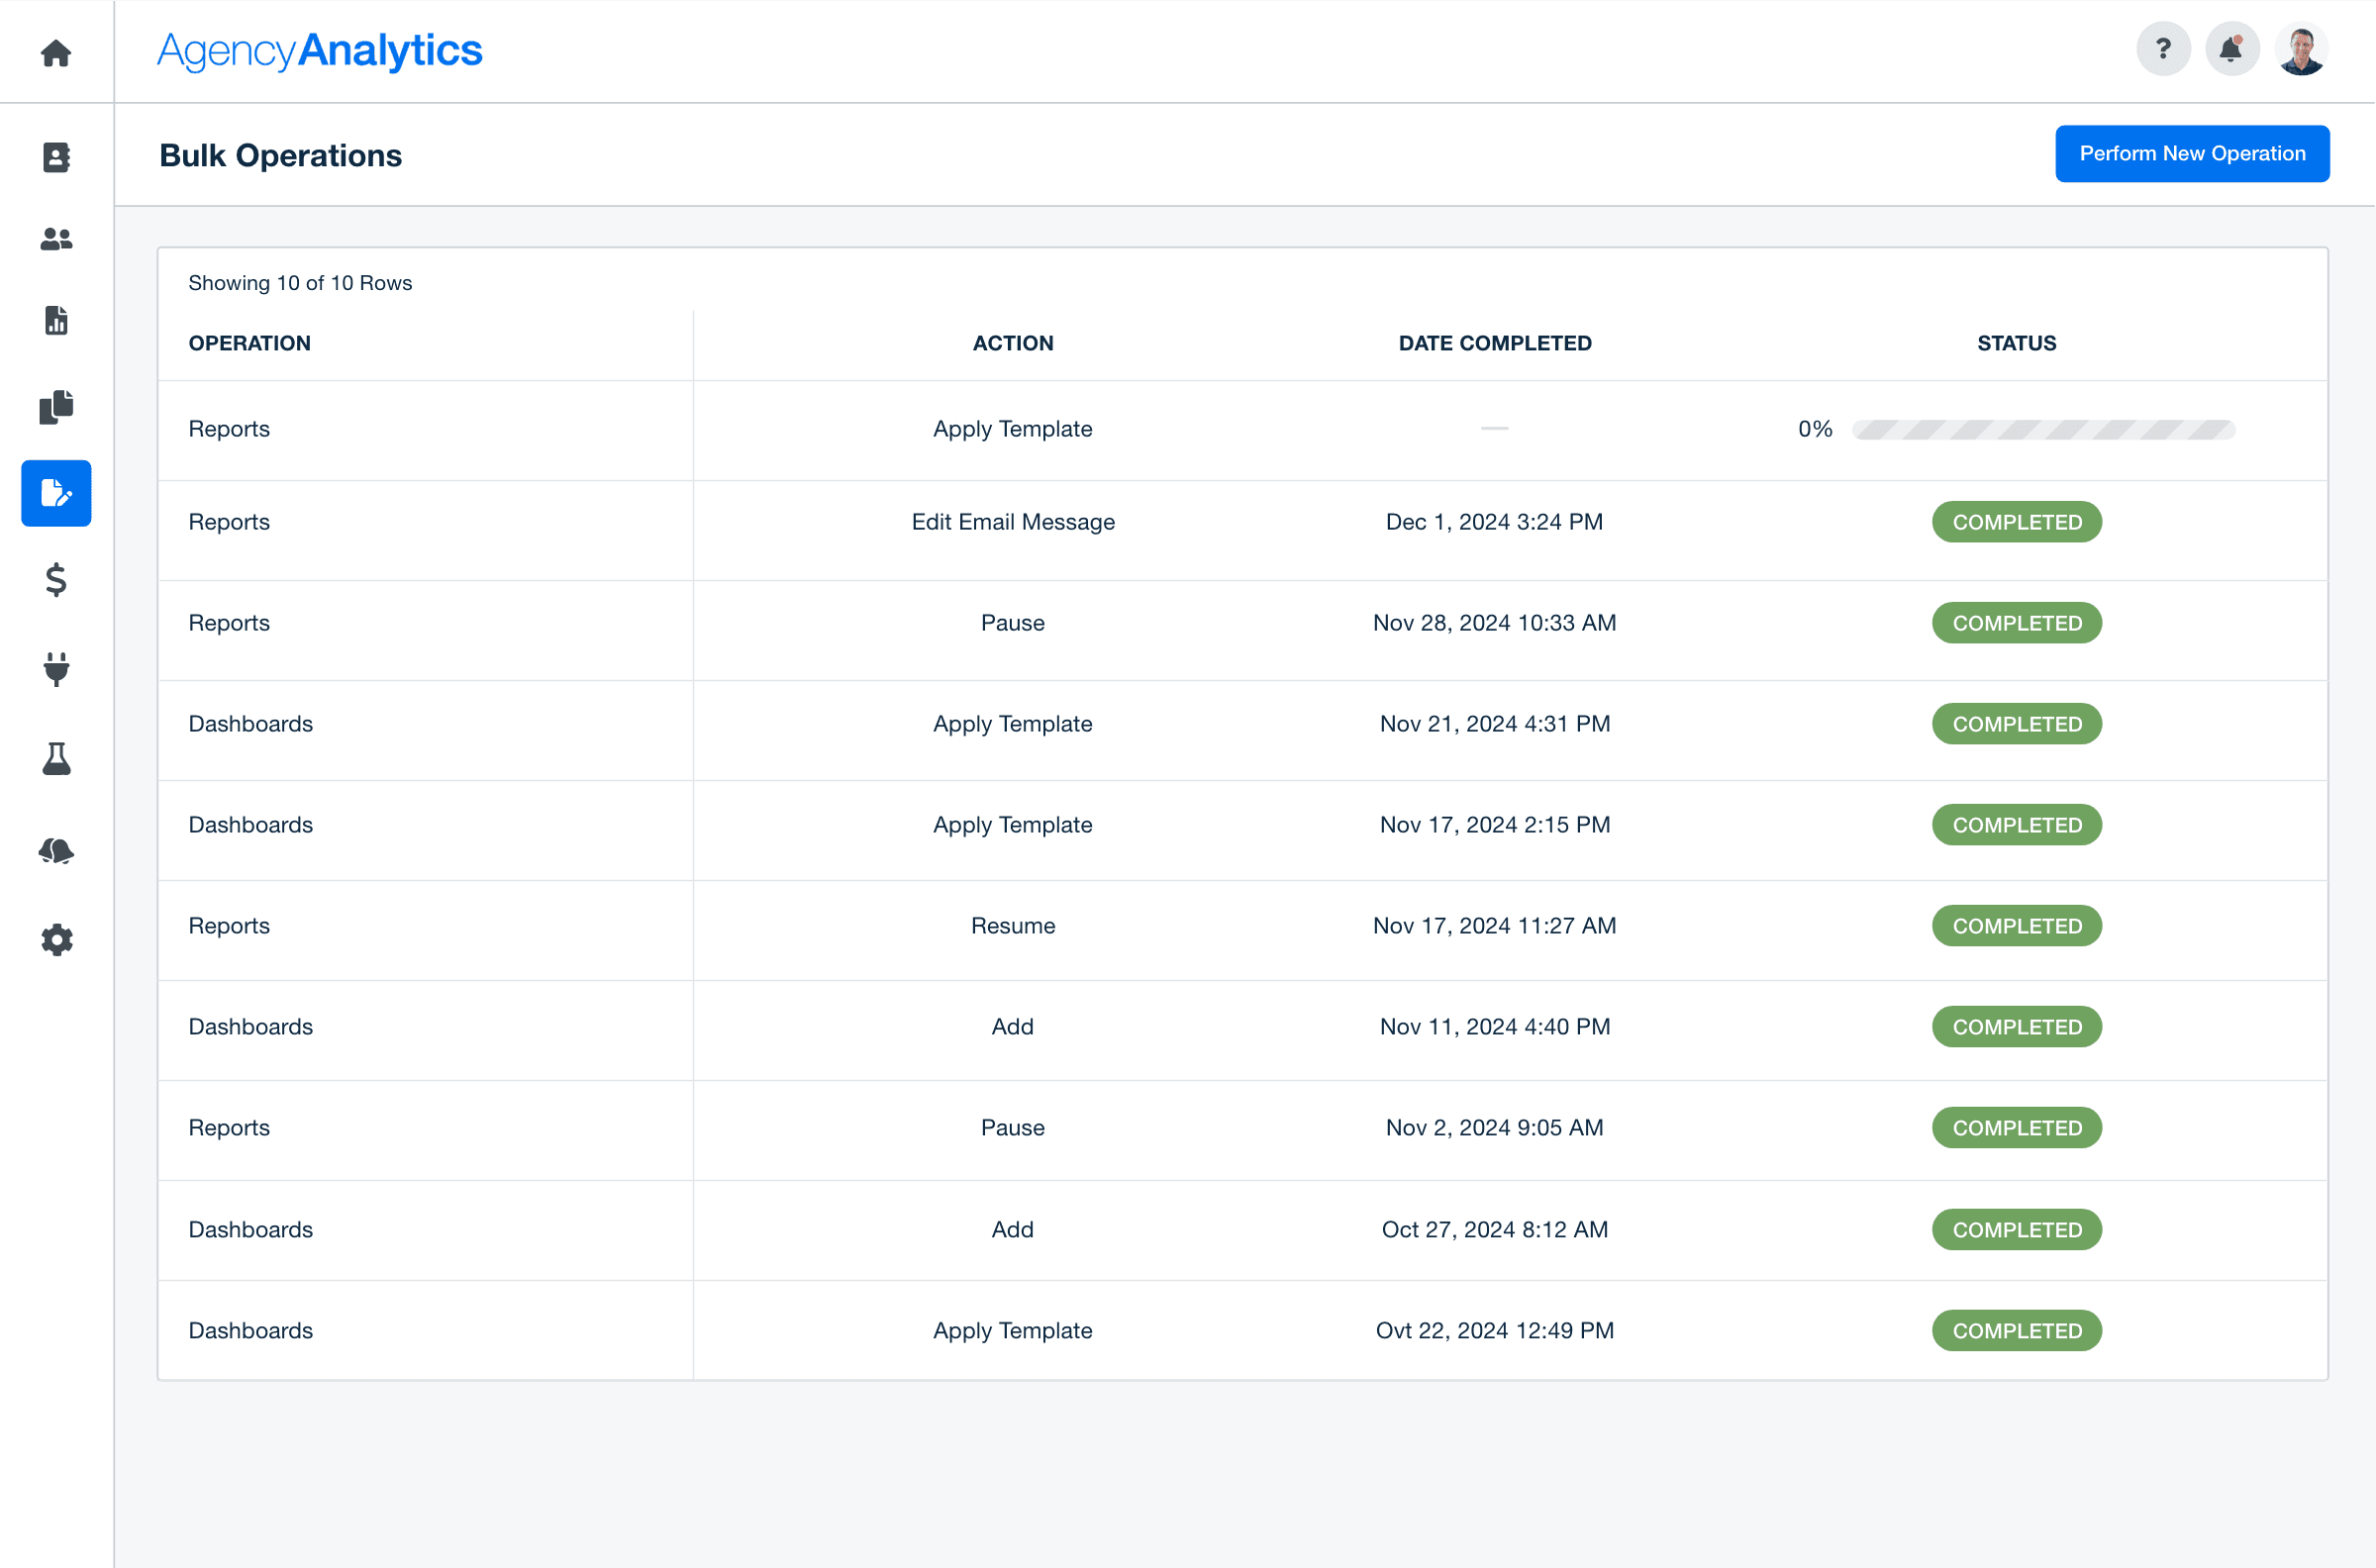
Naturally, this could mean more administrative work. No need to worry about too many repetitive tasks though–check out the Bulk Operations feature. This handy tool removes some of that manual grunt work and optimizes the reporting process even more.
Use it to quickly add or delete templates across multiple dashboards or reports–even replicate specific sections. It’s also a neat way to pause or resume automated report schedules across client campaigns. This gives you extra time to review your work, make tweaks (e.g., customizing a standard year-end email across reports), and ensure everything is client-ready.
9. Smart Dashboards
Just a few clicks, and you’re ready to wow your clients.
In 2024, we rolled out the brand-new Smart Dashboard feature, which complements the Smart Report tool introduced last year. In a few seconds, watch a professionally designed interface auto-populate with your client’s unique metrics. Keep on the pulse of real-time performance and create something tailored—all with minimal hassle.
With the option to build a custom dashboard, use a pre-built template, or even replicate existing ones, it’s our fastest option yet!
10. New Integrations
New integrations, who dis? 😎
This year, we welcomed a few heavy hitters to our already extensive list of 80+ platforms–here’s a rundown.
Semrush Keyword Ranking Data: We’ve revamped the Semrush integration to include a key piece of the puzzle–keyword rankings. Now, you have the ability to easily track your clients’ keyword performance, search visibility, and position trends directly in dashboards.
Matomo: This new integration brings detailed website performance data right into your reporting. Track key metrics like page views, user behavior, and conversion rates in a white label Matomo dashboard or customizable Matomo report template.
Amazon Redshift: Import your client’s data warehouse straight into reports and dashboards. Quickly pull in large datasets, run complex queries, and view those insights in a visual format.
MySQL: Similarly, the MySQL integration allows you to connect directly to your client’s database and pull in key insights. Monitor order statuses, update data queries, and more.
Google BigQuery: Pull in detailed Google BigQuery data, like sales metrics, inventory insights, or whatever your client is tracking. Use intuitive visualizations to bring these numbers to life, all in a few clicks.
Google PageSpeed: Page load time isn’t just a technical metric—it’s a critical factor for SEO and the user experience. Use the Google PageSpeed integration to ensure client websites are in tip-top shape.
TikTok: You asked, we answered. The TikTok integration is now live in AgencyAnalytics, giving your agency the ability to track audience engagement and identify top-performing organic videos.
How AgencyAnalytics Remains Committed to Your Growth and Success
Helping agencies succeed is at the heart of everything we do.
From building intuitive tools to offering hands-on support, we always look for ways to make your job easier. Here’s how we keep our platform—and your agency—running smoothly.
✅ System Usability Surveys (SUS)
We don’t just guess what works—we ask.
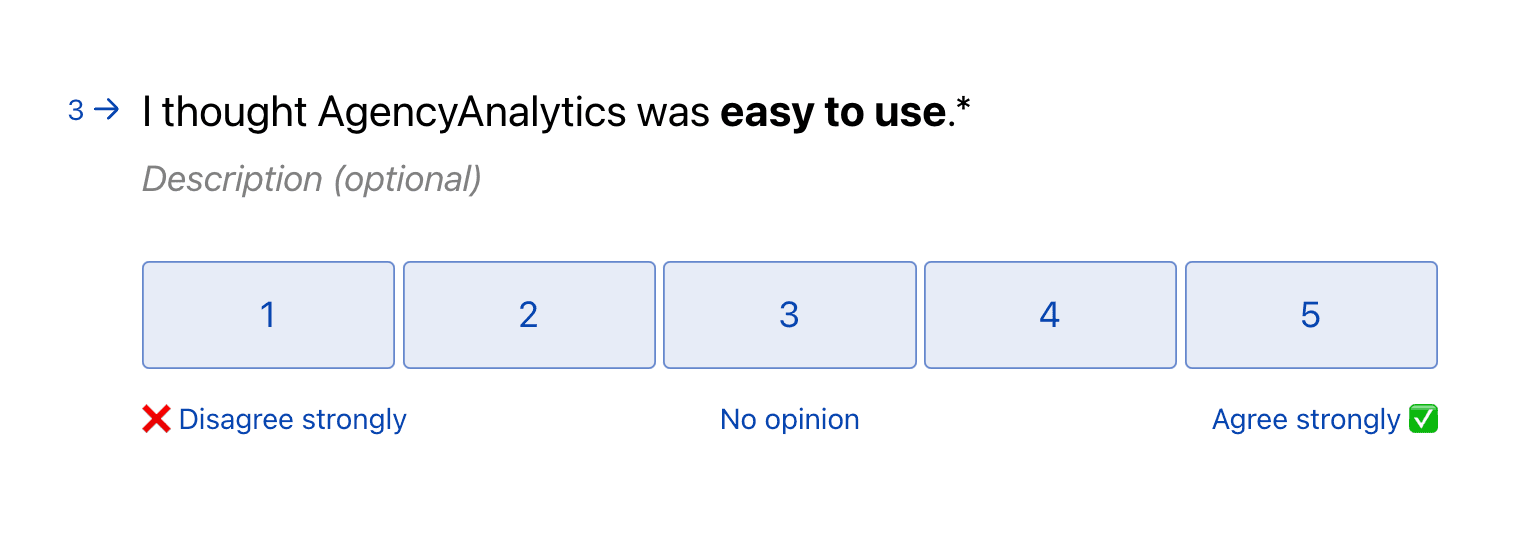
Regular System Usability Surveys (SUS) help us understand how agencies use the platform and what could be better. We listen to your feedback, stories, and even pain points. It’s all about making sure every click feels intuitive and purposeful.
We’re always listening to input from our customers, whether it’s provided through votes on our product roadmap for new features and functionality or through chats with our sales, customer success, and support teams. AgencyAnalytics also has a team of product design experts dedicated to making our platform easy, efficient, and enjoyable to use.
Daniella Ingrao, Product Marketing Manager, AgencyAnalytics
✅ Seamless Information Architecture (IA)
Navigation matters, especially when you’re managing multiple clients. That’s why we focus so much on getting our Information Architecture (IA) right.
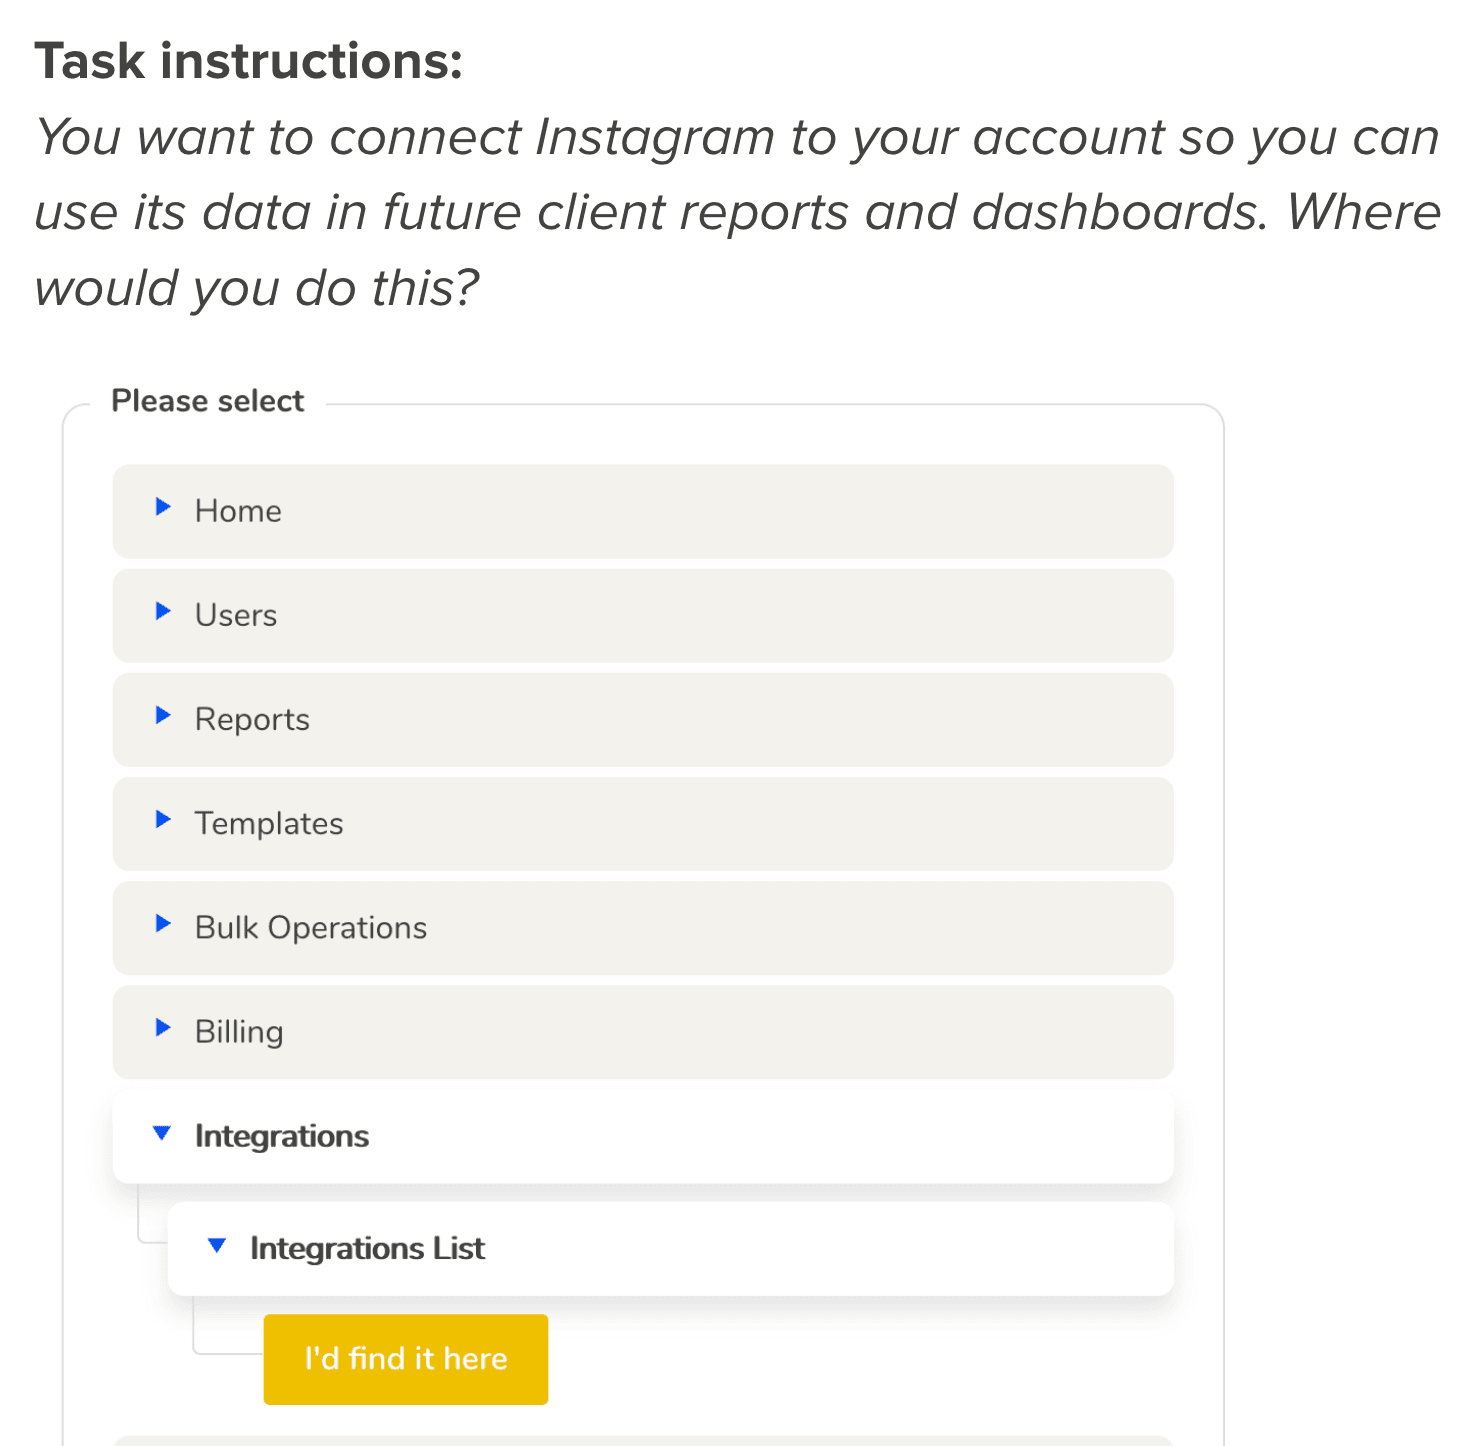
One tool we use is Tree Testing, which ensures the platform feels organized and intuitive.
Here’s how it works:
First, we map out pre-defined common workflows (like connecting integrations or building dashboards, for example).
Next, we run tests where users interact with a simplified version of the platform to complete tasks. This eliminates any extra variables, allowing us to zero in on the core structure and organization.
Finally, we assess how easily users find what they need, where they get stuck, and what changes could simplify the experience. Then, we use that data to make improvements.
✅ The User Experience (UX) Team Triad
Behind every feature is a powerhouse team comprising a Product Manager, Product Designer, and Engineering Manager.
This trio works together to ensure every update or feature is practical, efficient, and intuitive. More specifically, they take ownership of key aspects like User Navigation (UX), Information Architecture (IA), and platform design.
Together, they focus on delivering solutions that seamlessly integrate into agency workflows.
✅ 24/5 Customer Support That Has Your Back
Need help? Our customer support team is available 24/5 to answer questions, troubleshoot issues, or guide you through features.
Think of them as an extension of your team, always ready to jump in when needed. All you have to do is click the message icon in your AgencyAnalytics account–no runaround, no extra steps. Alternatively, explore our extensive, regularly updated Knowledge Base.
I love Agency Analytics' customer support. I know that they have my back–with new integrations, tech issues, or even best practices for reporting. The customer service keeps me confident that our team has what it needs in order to execute for our clients.
Ryan Burch, Owner, Tobie Group
Our Platform Is Built to Support Agencies Every Step of the Way
At the end of the day, it’s about eliminating friction and empowering your agency to deliver outstanding results. By blending your feedback with data-driven insights, AgencyAnalytics remains a platform you can rely on.
We’re all about creating tools that help agencies save time, scale smarter, and deliver better results. From powerful new features to regularly gathering user feedback, our team is committed to your success.
It doesn’t stop in 2024 either–we’ve got more exciting developments coming in the new year ahead. That way, you’ll have more bandwidth to focus on what truly matters: Scaling your agency and driving client success.
If you haven’t explored everything AgencyAnalytics has to offer, here’s your sign! Discover how our platform streamlines the entire reporting process–sign up for a free 14-day trial today.
Impress clients and save hours with custom, automated reporting.
Join 7,000+ agencies that create reports in under 30 minutes per client using AgencyAnalytics. Get started for free. No credit card required.

Written by
Faryal Khan is a multidisciplinary creative with 10+ years of experience in marketing and communications. Drawing on her background in statistics and psychology, she fuses storytelling with data to craft narratives that both inform and inspire.
Read more posts by Faryal KhanSee how 7,000+ marketing agencies help clients win
Free 14-day trial. No credit card required.


