Table of Contents
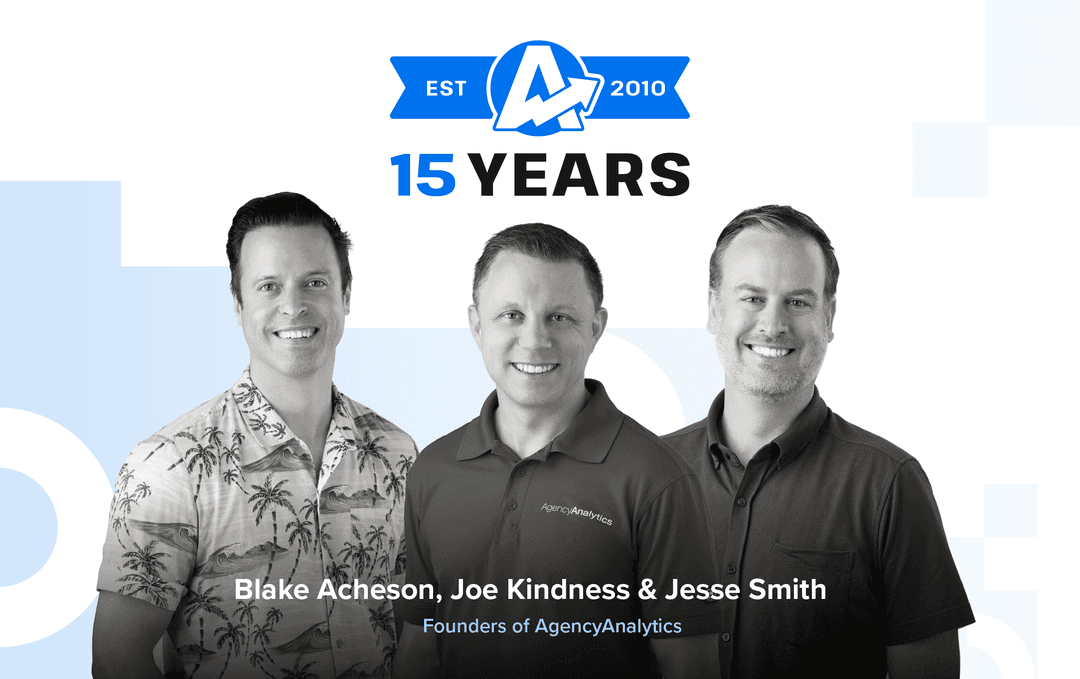
Fifteen years ago, Blake Acheson and I launched a SaaS startup.
Back then, we were just two developers working out of a kitchen, with no paychecks, and a product called My SEO Tool. We gave ourselves one year to come up with something that worked–before we both ran out of money! Somehow, that turned into a decade and a half of building, learning, and growing.
So much has changed since the early years. The platform has evolved, the team has grown, and what started as a small product has become something much bigger. We’re a company with our own culture, values, and strong momentum.
Today, in celebration of our 15th anniversary, I’ll be taking a look back at each year’s biggest milestones. It’s a glimpse at how far we’ve come, from those early days to everything we’ve built together in 2025.
2010
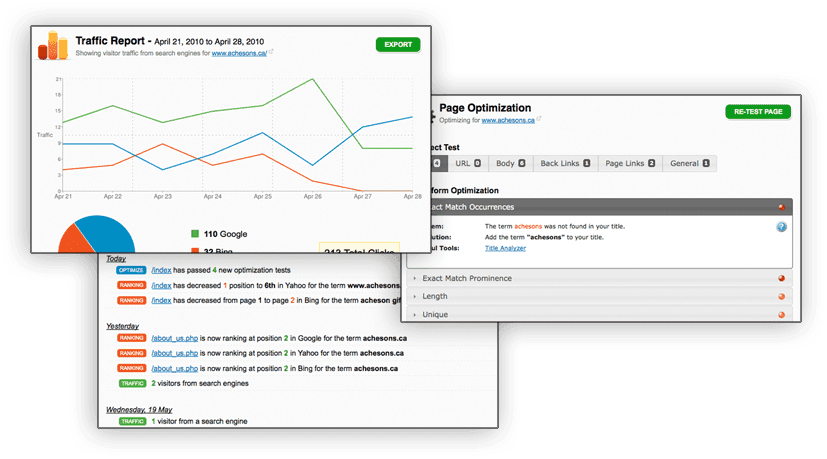
After only three months in beta, we officially launched My SEO Tool on July 14, 2010. The idea was simple: We wanted to automate basic SEO tasks so users didn’t need to read through technical documentation or hire a consultant just to get started.
It wasn’t flashy, but it worked. We almost abandoned this project in favour of another idea, which would represent the number of visitors you had as fish. We’re glad we didn't pursue that one!
That decision kicked off everything that followed.
2011
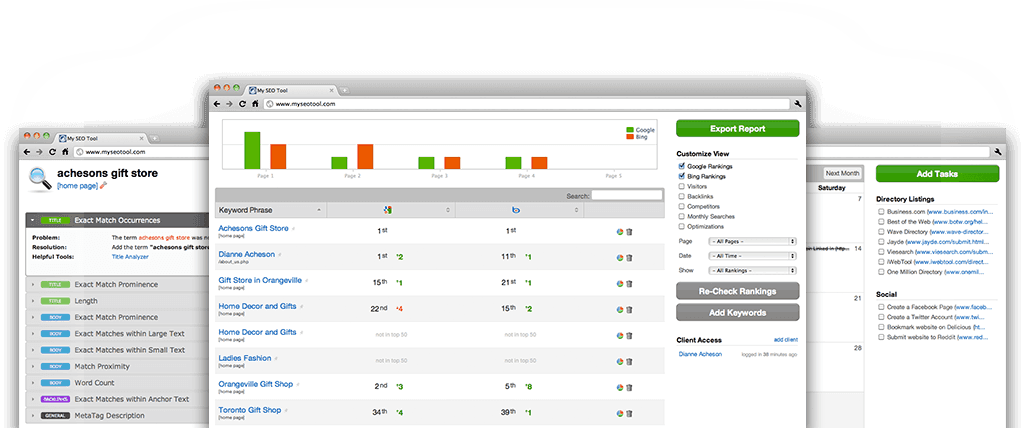
Initially, our growth was happening through word of mouth, and we stayed focused on building the product. At the time, there weren’t many SaaS options offering rankings and SEO page optimization in one place, which made the platform stand out early on.
We launched our first integration with Google Analytics, a key step in expanding the data marketing agencies could access, and began to scale the product more meaningfully.
2012
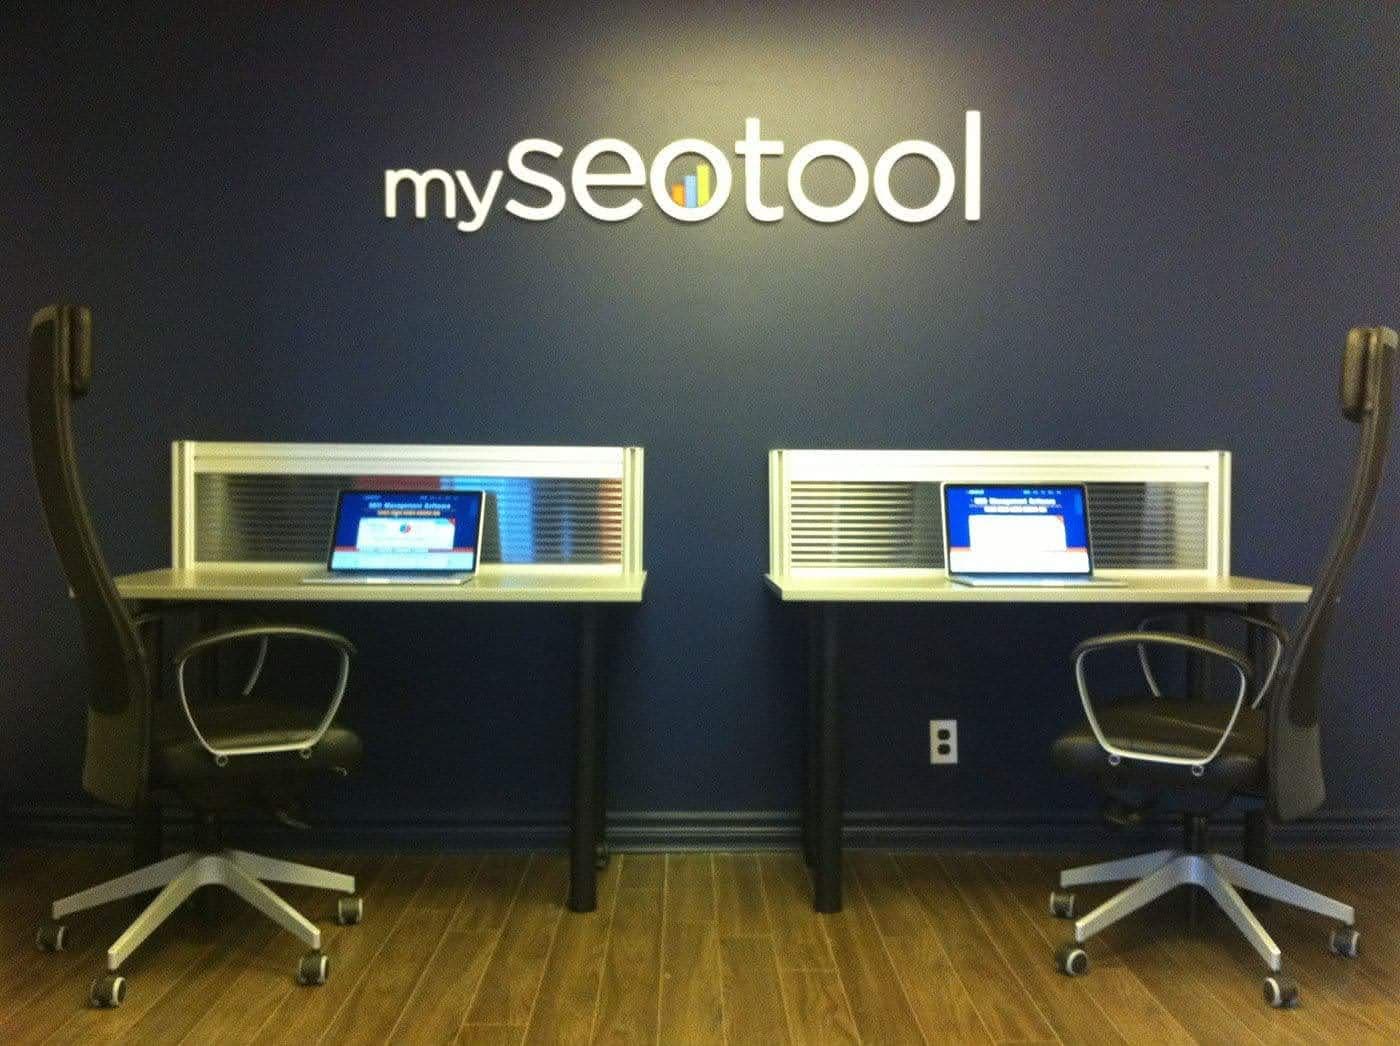
In 2012, we moved from Blake’s kitchen table to our first office in downtown Toronto. The move signaled that we were ready to grow, but we kept our focus on the product. Expansion could wait. Getting it right couldn’t.
This year, our goal was to clarify who our ICP was and who we were building for. We knew we wanted to build a tool that would help marketing agencies deliver better results and stronger communication to their clients. This meant making the data easy to access, easy to share, and reliable.
Rather than packing in features for the sake of it, we stayed committed to building what agencies were actually looking for: speed, accuracy, and automation. That focus laid the groundwork for the platform’s next stage.
2013
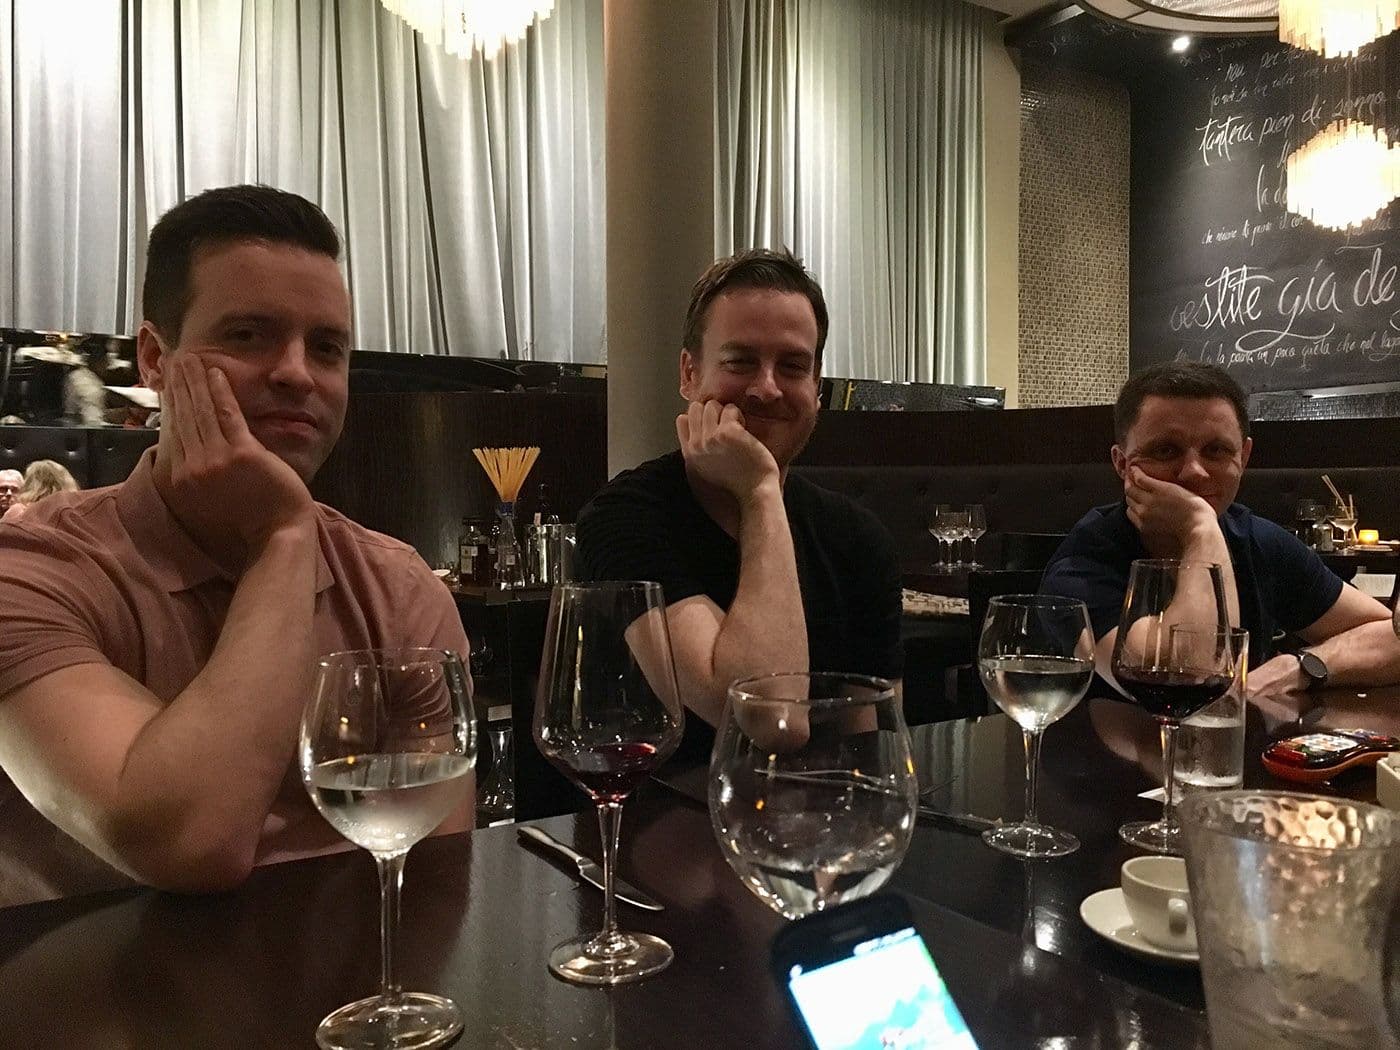
We hired our first employee, Jesse Smith, who remains with us today as our Chief Product Officer. It was a milestone year in more ways than one, as we also reached 1,000 customers!
At the time, the platform was focused on rank tracking and backlink monitoring. However, new integrations with Google Ads, Facebook, and YouTube started expanding our tool’s reach.
We also introduced white label login, letting agencies give clients a branded experience that felt like their own. Behind the scenes, we began building messaging tools to help marketers better communicate progress inside their client reports.
2014
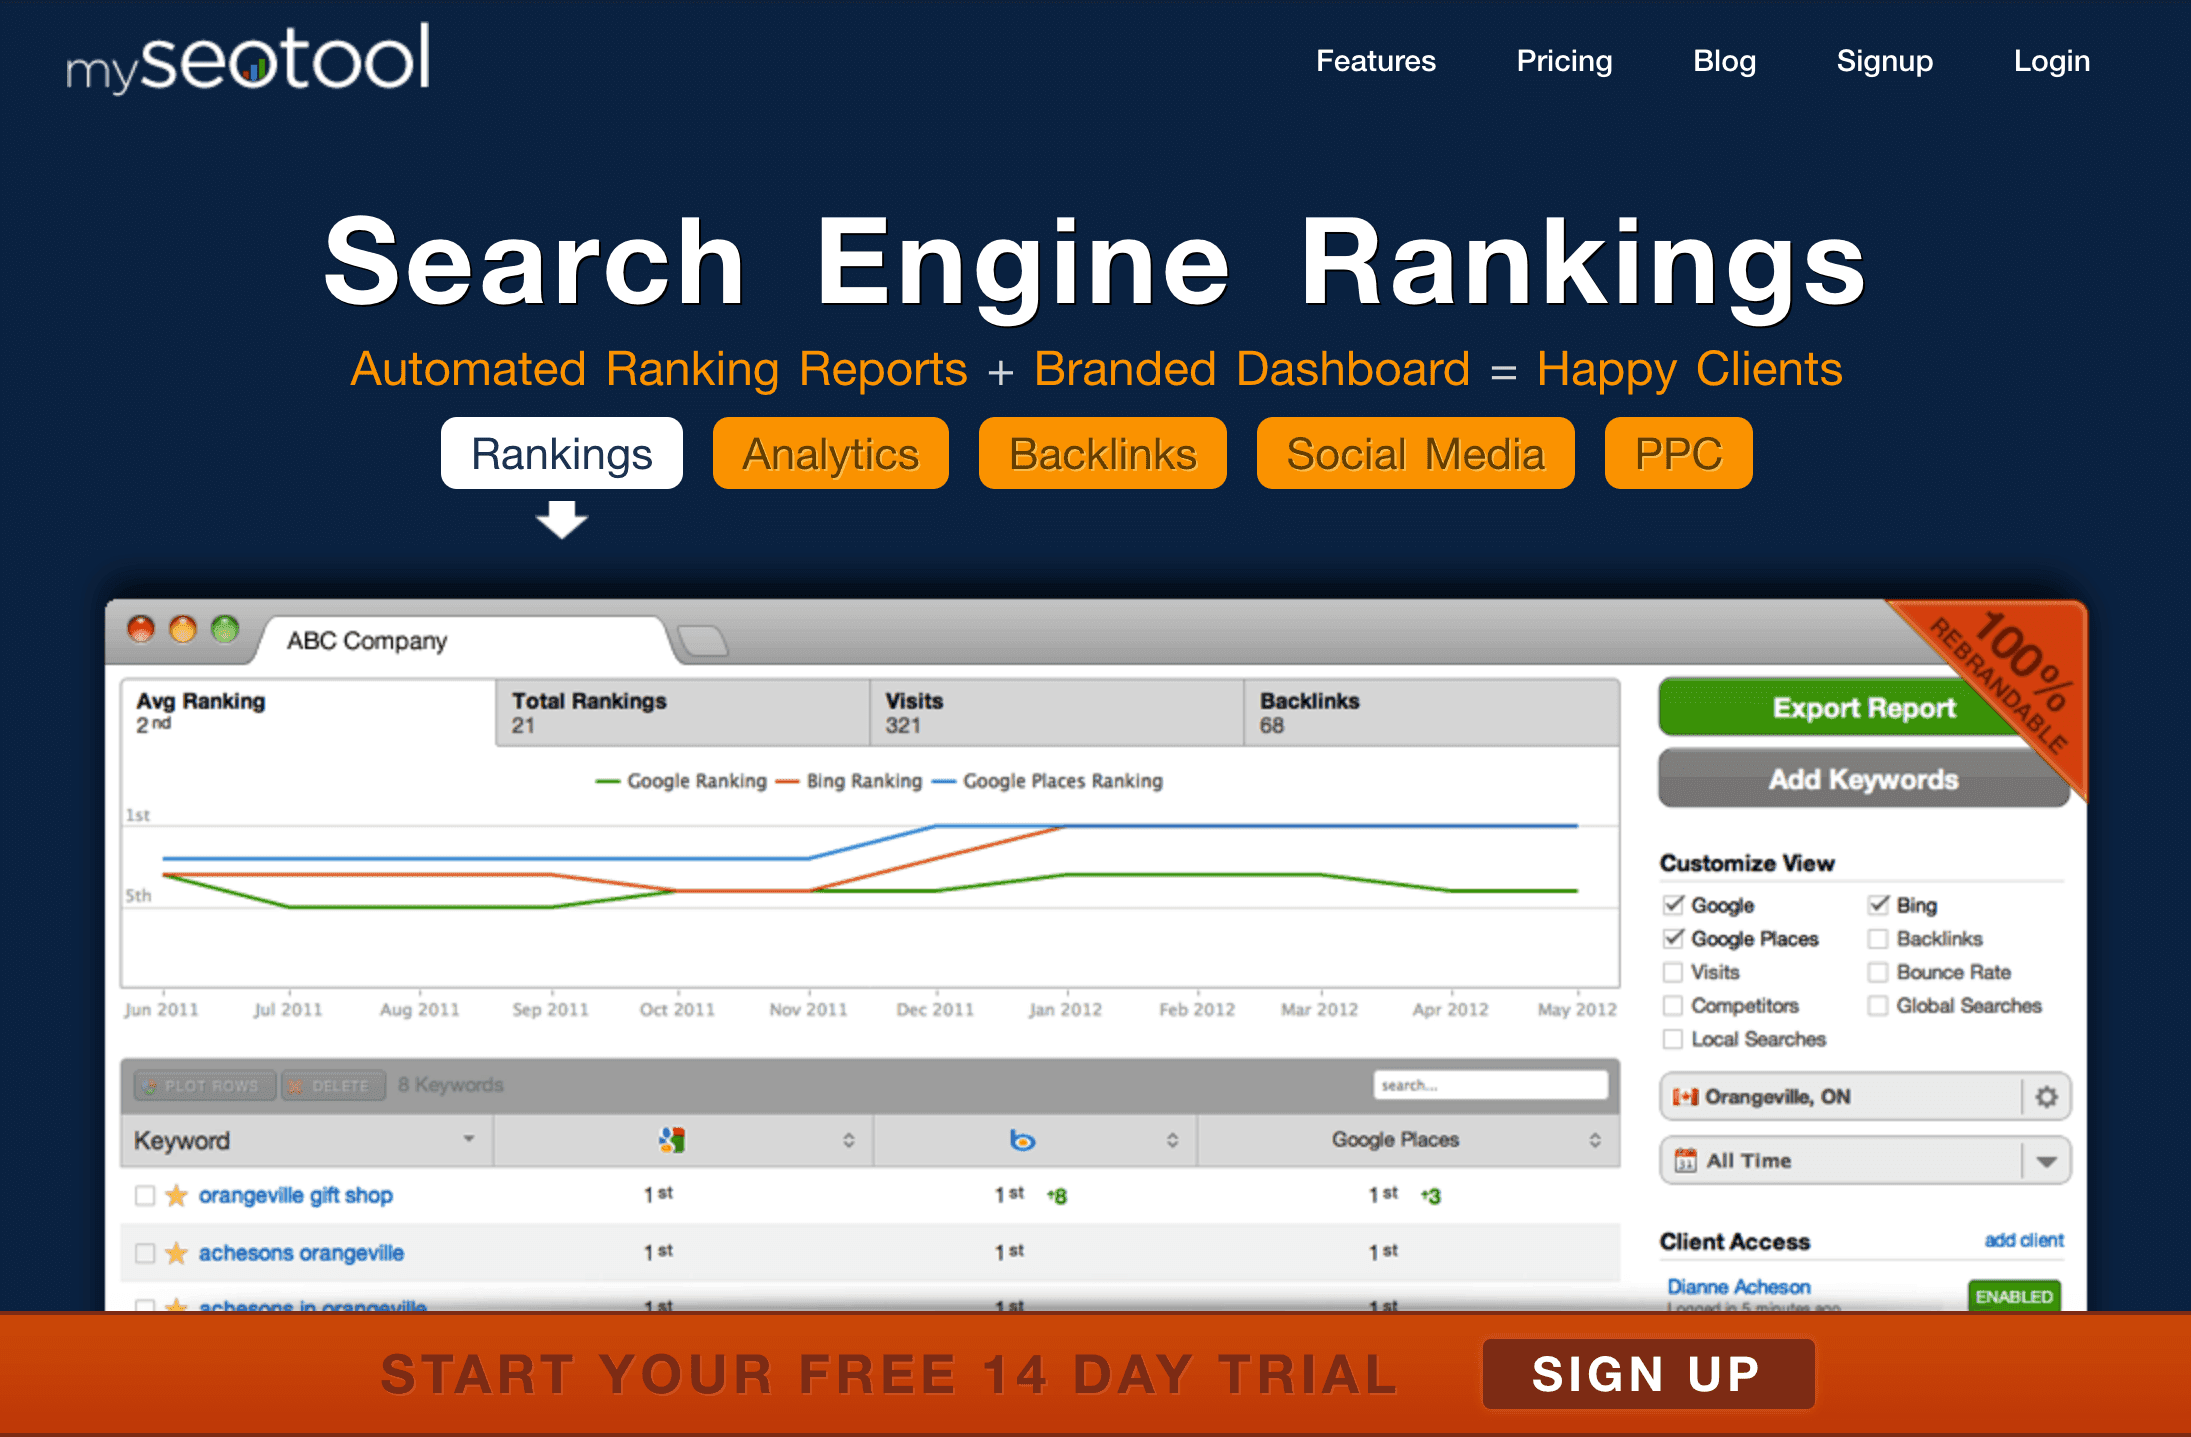
In 2014, we launched a new interface that prioritized reporting. A cleaner layout and updated menu functionality marked a shift toward giving agencies more control over how they present client results.
That same year, we took another major step forward by introducing automated reporting. Our users could now schedule PDF reports to send daily, weekly, or monthly directly to their clients. With the new visual report editor, they could see exactly what was being sent, customize layouts, and build reports that told the right story.
It was still just the three of us handling development and support, but from the beginning, we took a very human approach to customer service. That mindset hasn’t changed. Even as we’ve grown, being responsive and personal in how we support agencies remains a core part of who we are. It’s something our customers still mention to this day.
2015
2015 marked a huge turning point. As the platform expanded beyond SEO, it was clear the name needed to reflect that evolution. We retired My SEO Tool and officially became AgencyAnalytics. We had explored many different names, but in the end, simple just made sense: AgencyAnalytics captured exactly who we were building for and where we were headed.
As the product grew, so did its value. We introduced Campaign Dashboards to help agencies summarize data across multiple integrations. Google Search Console and LinkedIn joined the platform, bringing us to seven integrations and expanding what agencies could track and report.
It was also the start of a more intentional approach to customization and control, giving agencies better ways to tailor how they presented data and offering support for the platforms their clients already relied on.
2016
In 2016, we took a team trip to the Cayman Islands to celebrate our growth and what was yet to come. This was the year we realized that great support doesn’t have to come from developers alone.
We hired our first dedicated support agent and brought on our first marketing manager, both of whom played a key role in shaping the next stage of growth. With these two new team members we were able to formalize our marketing strategy and expand our commitment to providing a world-class customer support experience–something that continues to be a differentiator for our brand.
Behind the scenes, we built a new framework to support faster integration rollouts. That foundation led to major additions, including Facebook Ads, Instagram, CallRail, and Call Tracking Metrics, solidifying our shift toward deeper reporting capabilities.
2017
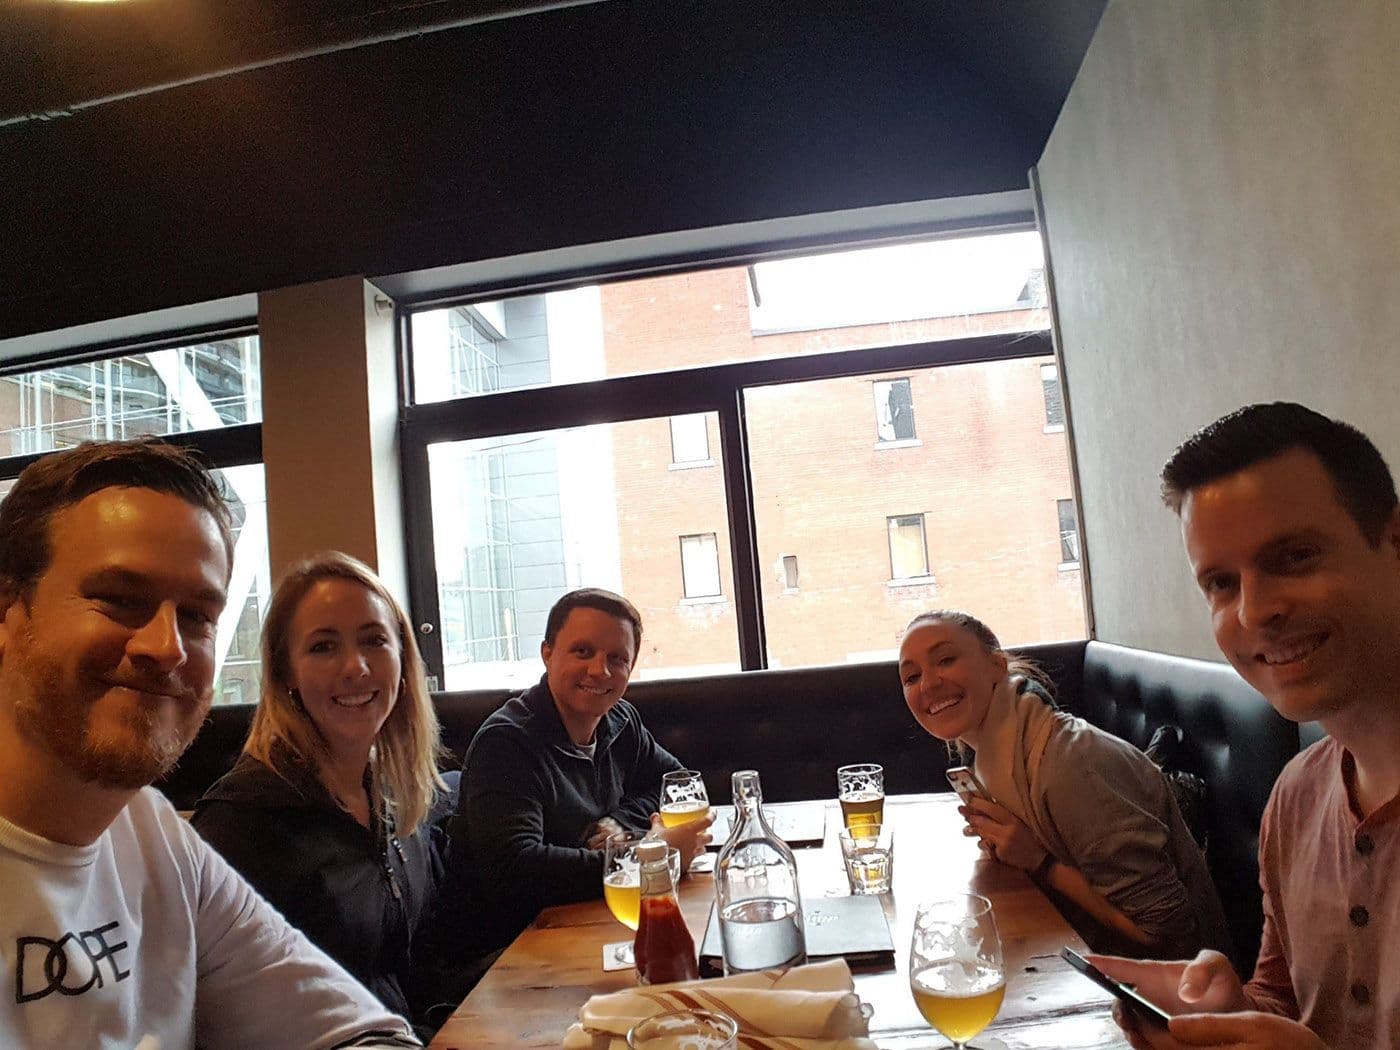
As the team grew to seven, we started focusing more on support and development. That investment paid off. We released over 13 new integrations this year, including MailChimp, Campaign Monitor, WhatConverts, and Bing Webmaster Tools, helping agencies pull in even more campaign data with less manual effort.
We also introduced multi-location SERP tracking, giving agencies the flexibility to monitor search performance across multiple regions in a single campaign. And with the new comment sections in reports, agencies could add context, explain key data points, and tell a clearer story to their clients.
2018

The platform continued to evolve fast. By 2018, we reached 2,000 customers and marked the milestone with a trip to Las Vegas!
The report and dashboard editor saw major upgrades, with drag-and-drop controls and more widgets that gave users greater speed and flexibility. Agencies could now build custom marketing dashboards tailored to specific client needs and track internal goals with the same level of control. Visual design also took a leap forward, making reports clearer, cleaner, and more impactful.
As more SaaS tools adopted this style of editor, AgencyAnalytics was already ahead, building the tools agencies needed to show results and stand out in their industries.
2019
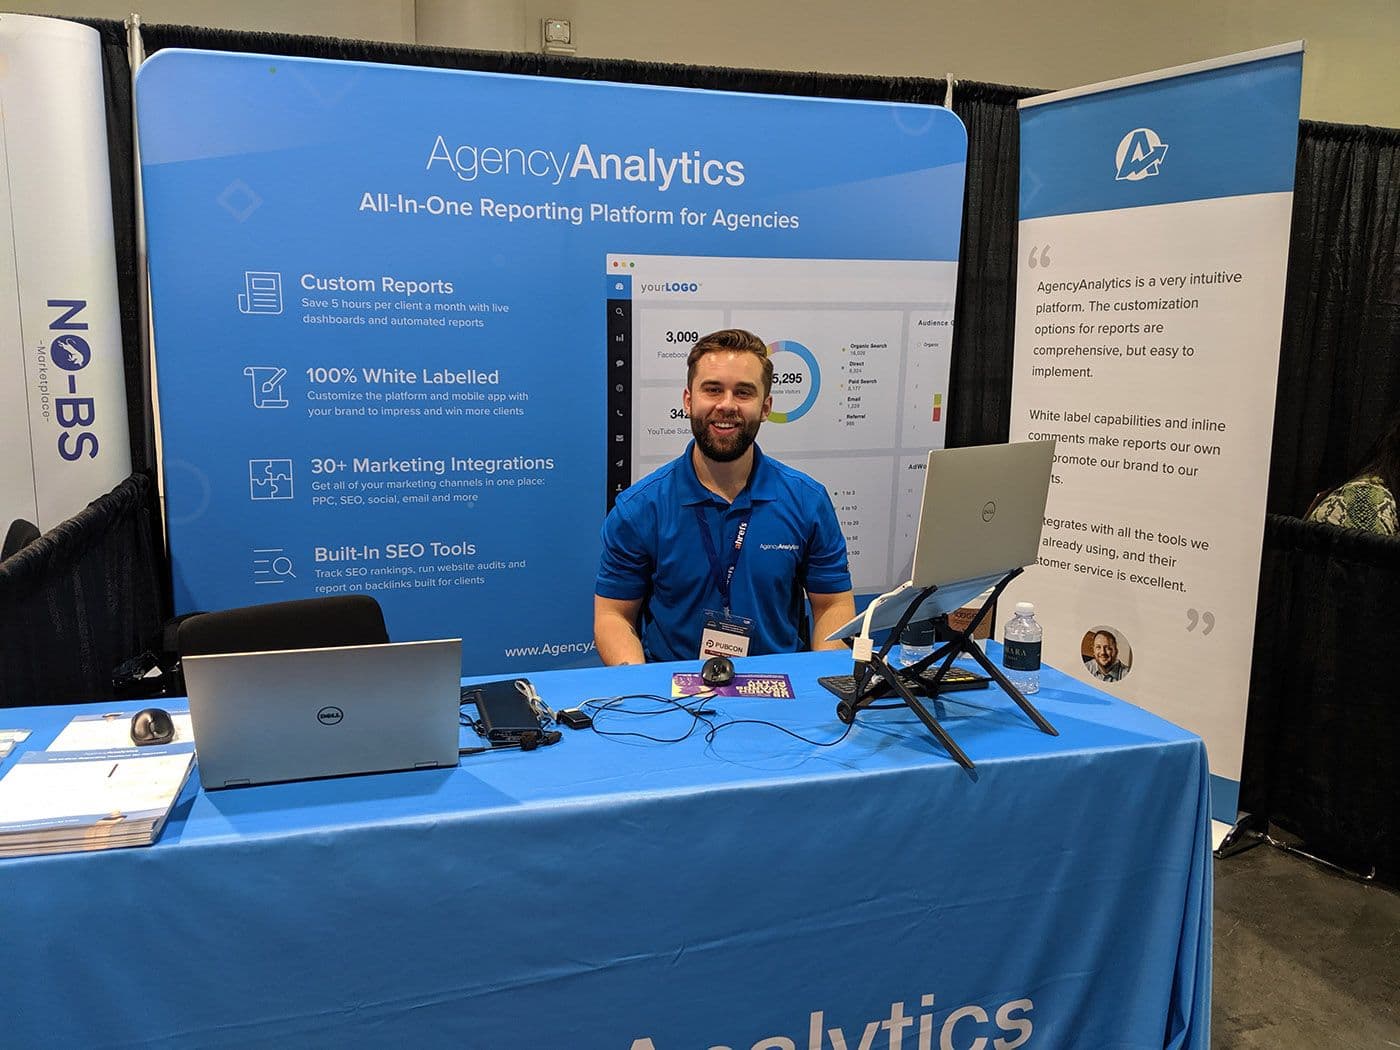
This was the year we stepped into the spotlight. We hit the trade show circuit with stops at PubCon and SMX East in New York, giving us a chance to connect face-to-face with agencies and share what we’d been building. The exposure helped us reach another milestone: 3,000 customers. We celebrated with a well-earned trip to Costa Rica.
This is also the year we rolled out PPC markup, giving agencies the ability to apply margin percentages directly to their reports, so clients see the right numbers without manual edits. Shareable dashboard links also went live, making it easier to send real-time data without requiring a login.
2020
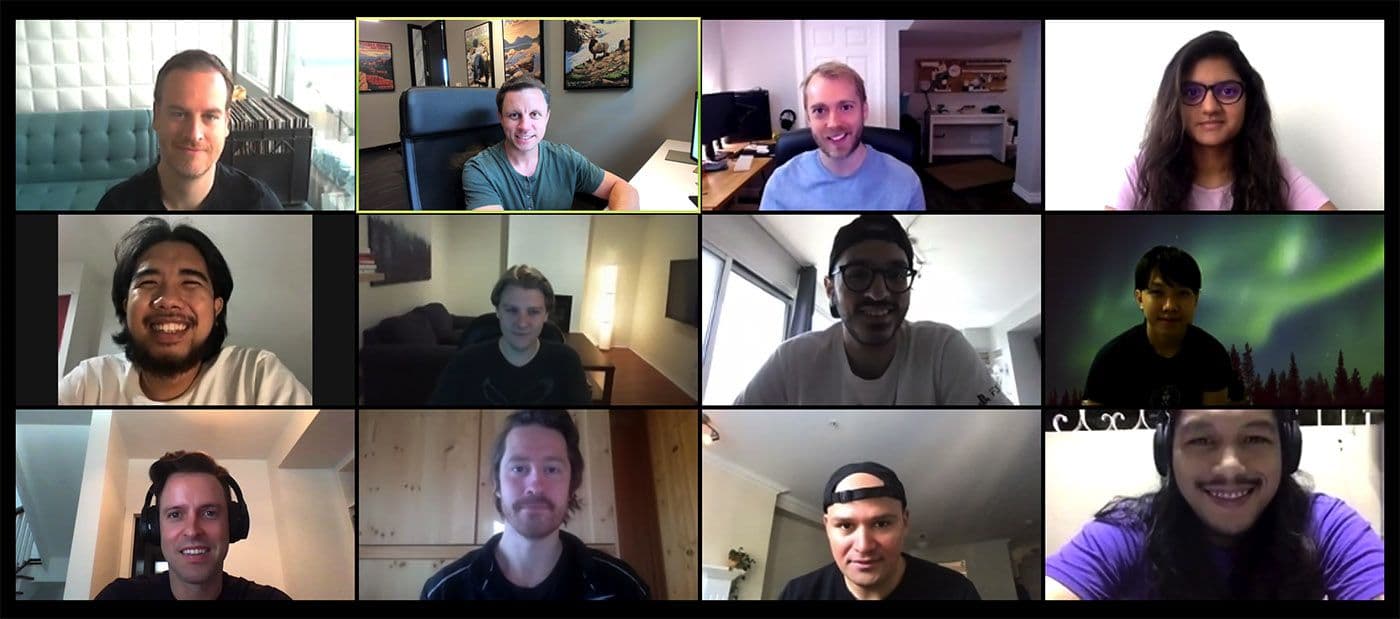
With a growing team of 22 and over 3,500 agency customers, 2020 was a year of unexpected challenges.. but also serious momentum. As the world shifted, our company was already built to work remotely. Daily Zoom calls, Slack chats, and Friday happy hours kept the team close, even from a distance.
We expanded our integration library to more than 50, including new additions like Unbounce, Delacon, and Vimeo. These updates helped agencies pull in even more data without adding manual work to their plates.
We also leveled up the dashboard experience. Agencies could now embed any URL directly into a dashboard, share individual widgets across platforms, and compare date ranges on line graphs. This provided our users with more flexibility, more insight, and more control.
2021
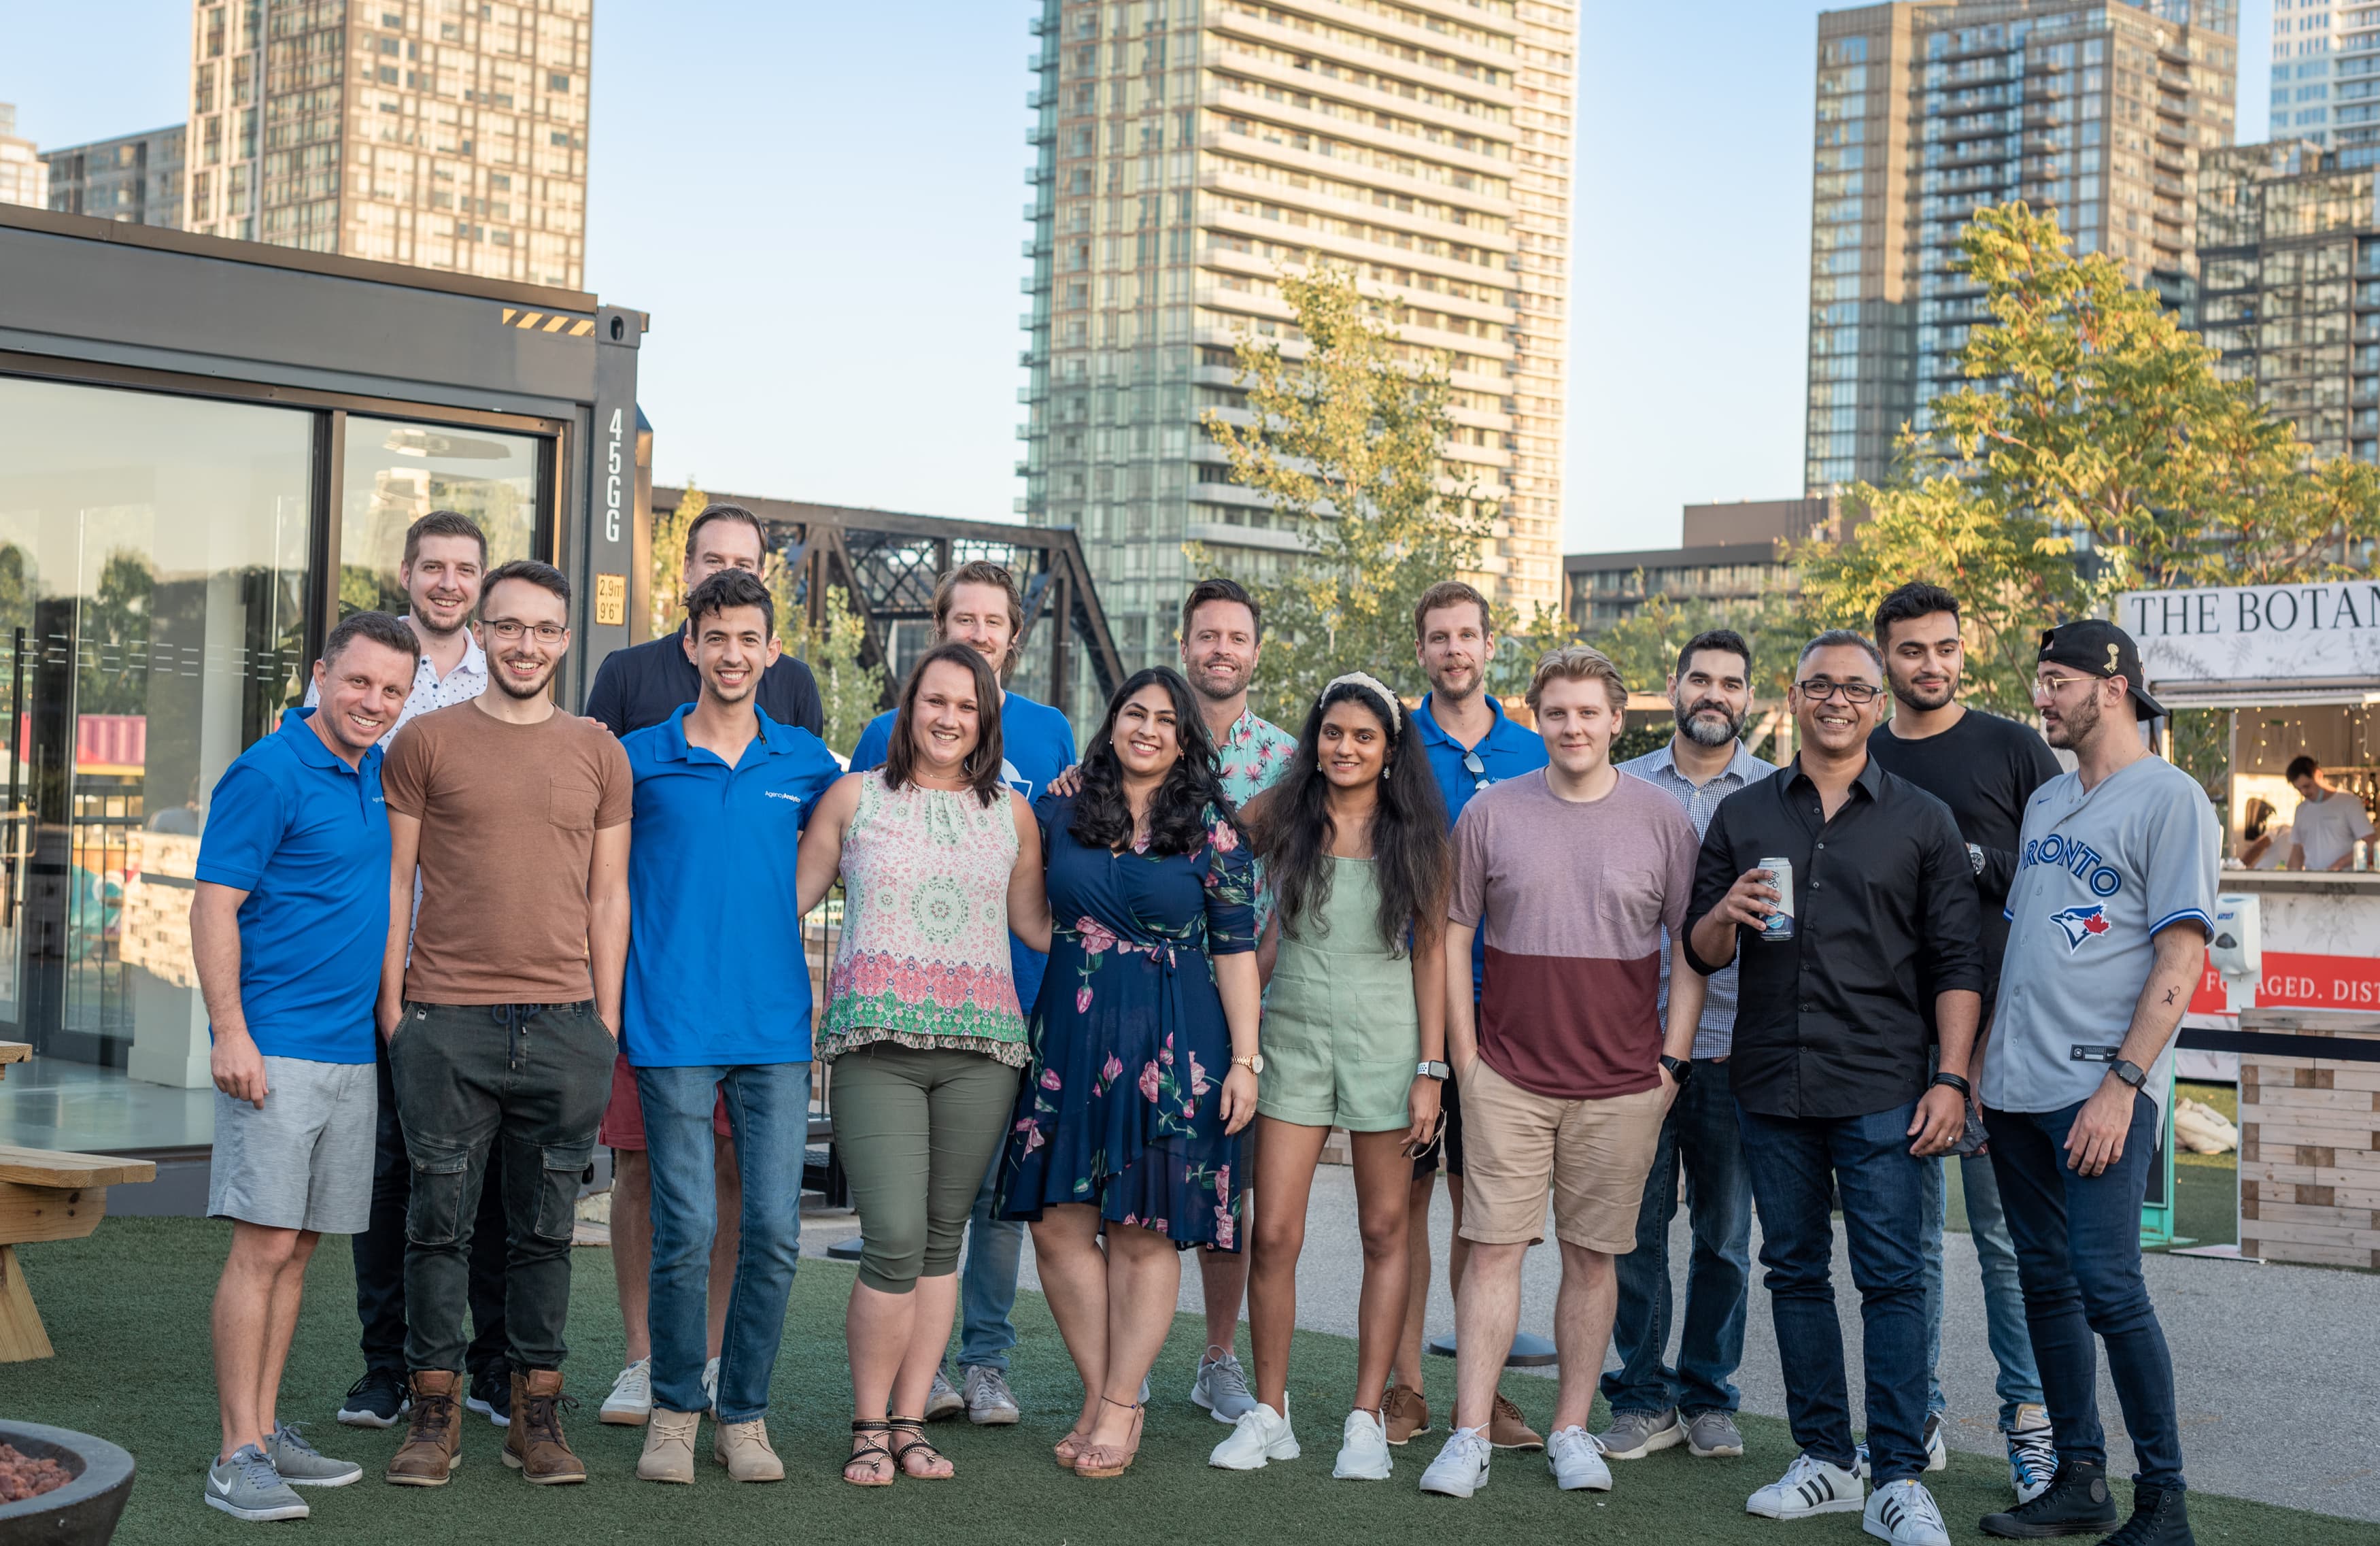
After a year of remote connection, we doubled down on building in-person relationships again. We hosted three meetups this year: Amsterdam Brewery, Stackt Market, and TacoTaco for the holiday season. Each one helped us reconnect, and it marked the beginning of a new chapter in our company culture; one that was focused on presence, community, and face time (the real kind).
We also crossed a major milestone, growing to support more than 5,000 agency clients!
On the product side, we launched Presentation Mode, which gives agencies a cleaner, full-screen view that highlights only the most important dashboard data. It was built for meetings, pitches, and client conversations that needed zero distractions.
We continued expanding our integration library with new connections to Amazon Ads, Semrush, WildJar, TikTok Ads, and Yelp Ads, making it easier than ever for agencies to centralize client data in one place.
2022
In 2022, we continued to prioritize in-person meetups, building on the momentum from the year before and making them a regular part of our culture-building efforts.
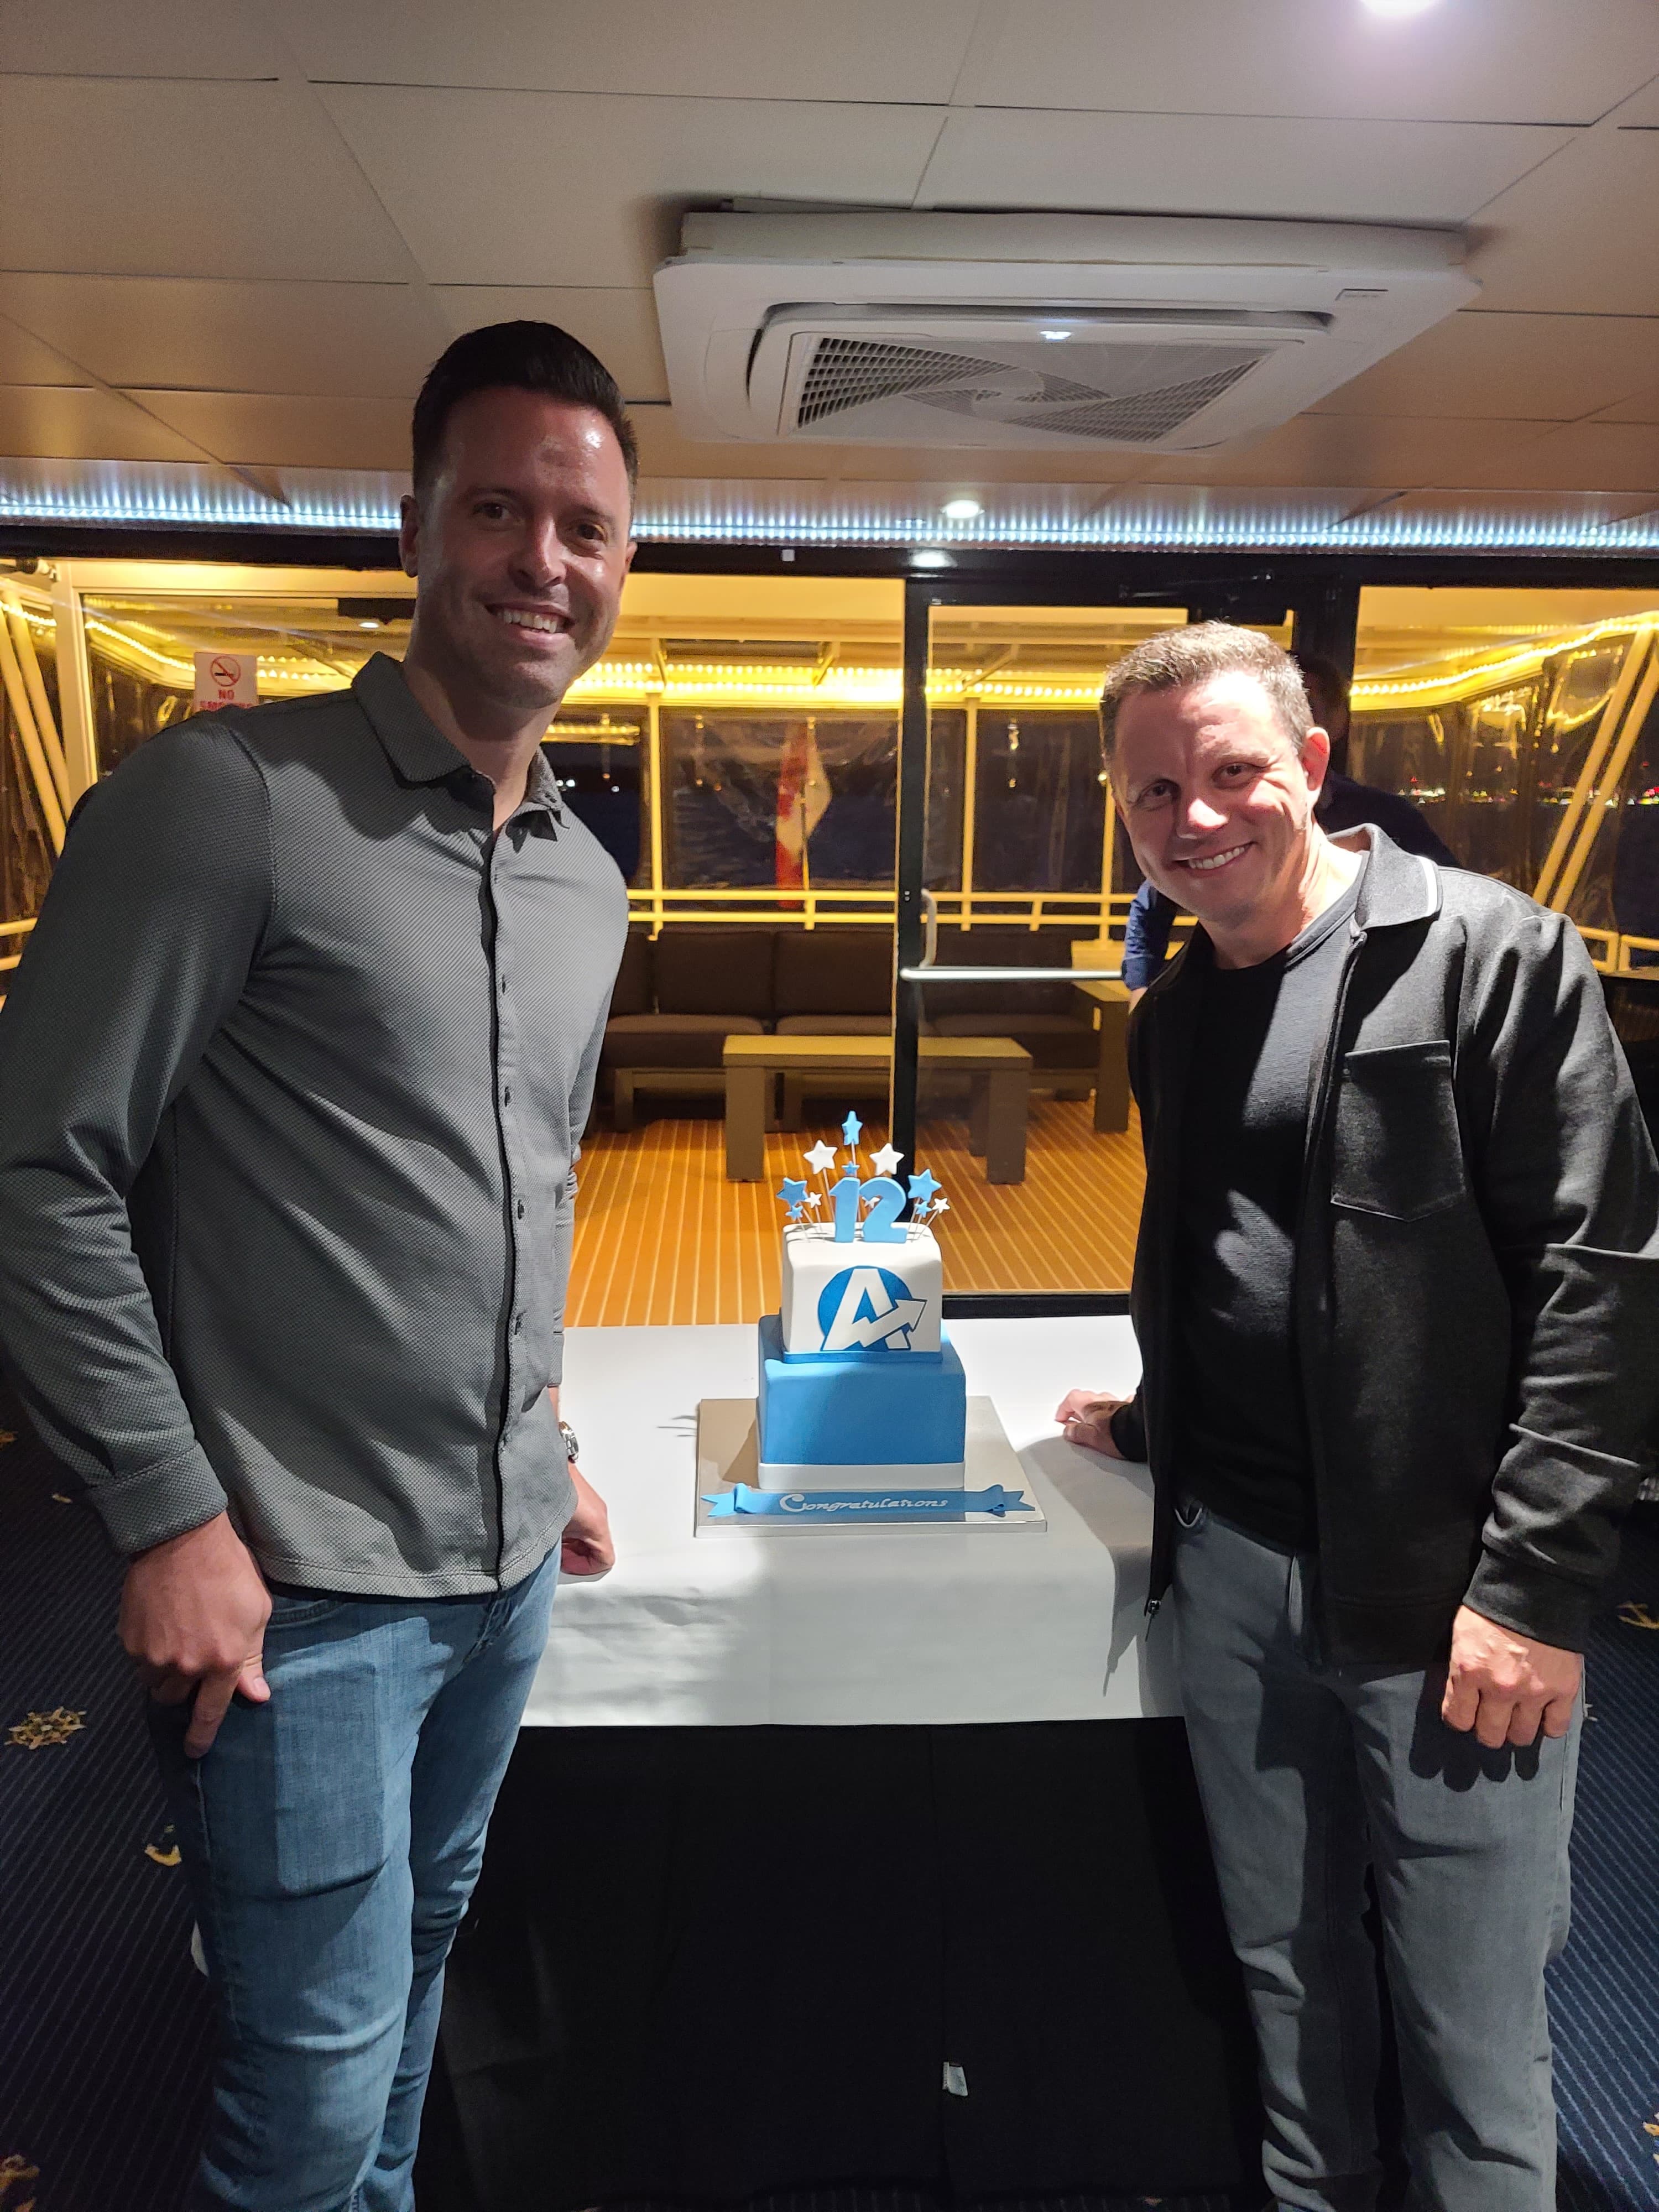
For our 12th anniversary, we flew in more teammates, hosted a rooftop hangout in downtown Toronto, and went on a boat cruise. Our Alberta teammates also met up for an escape room activity, marking our first cross-province gathering. It was all part of a shift to put people first. Strong culture builds strong teams, and strong teams build better products.
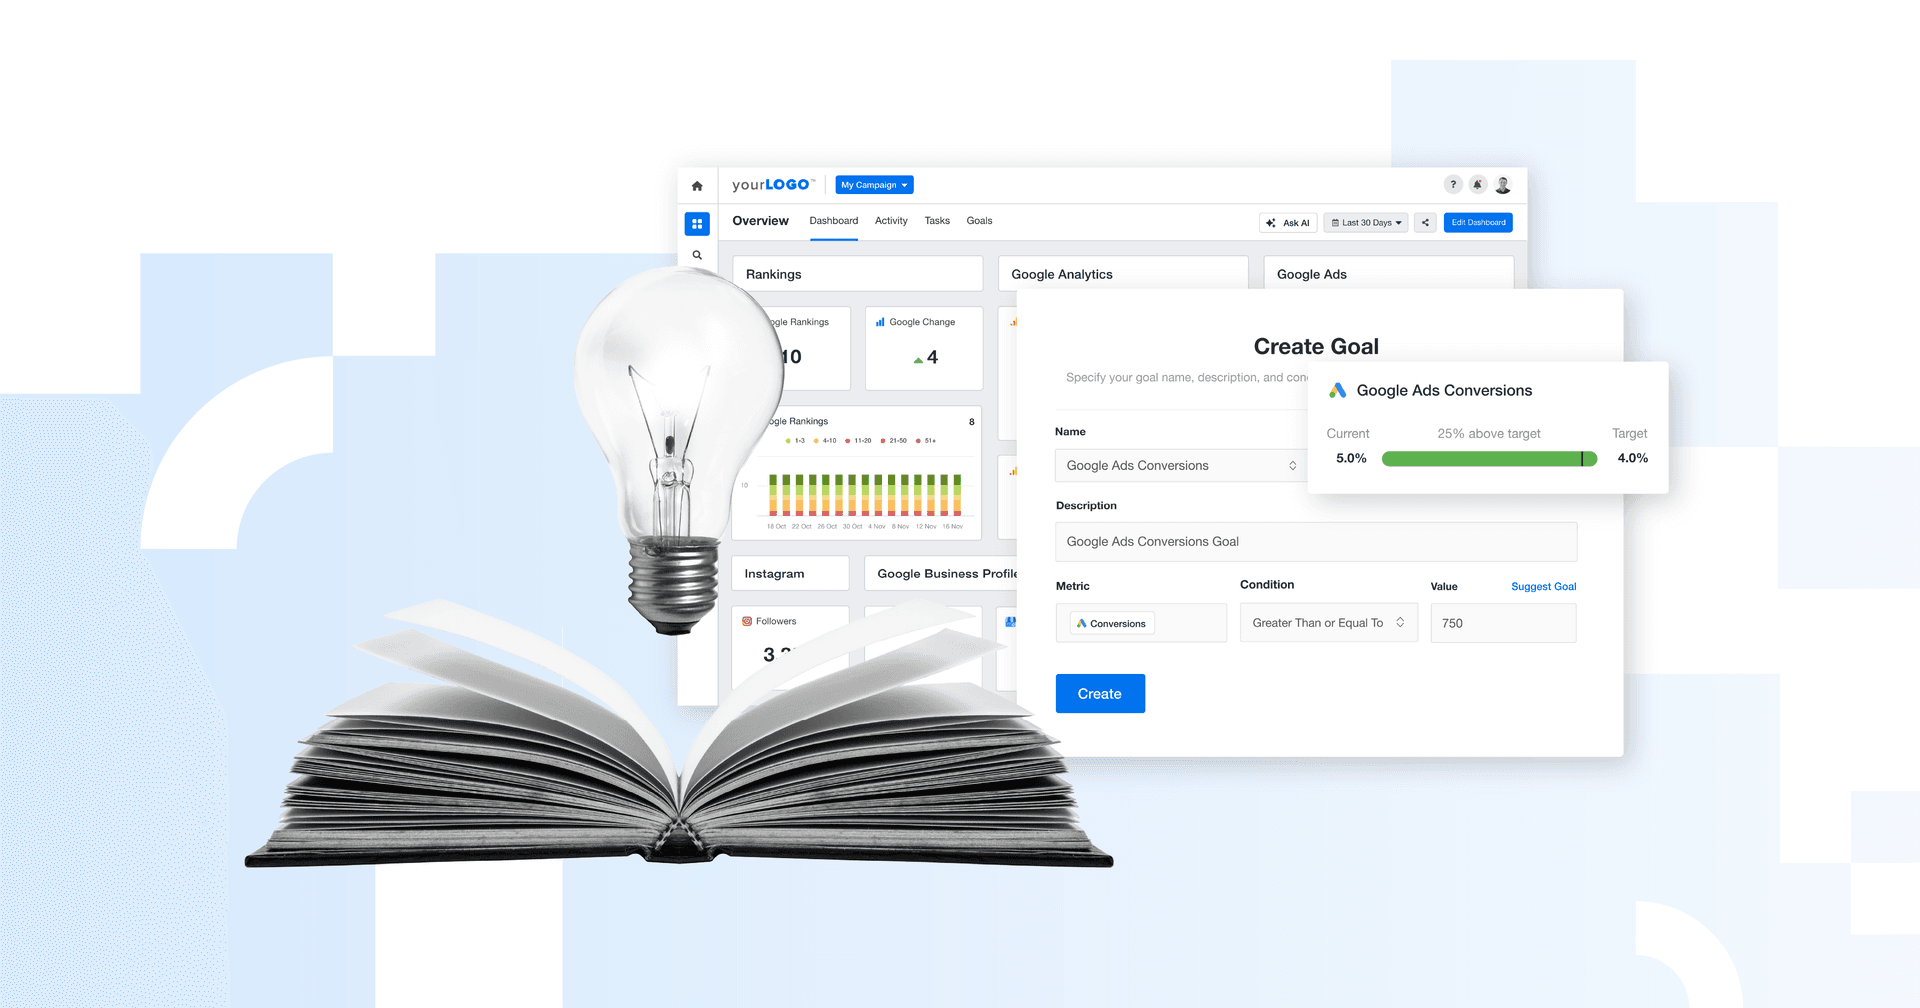
We also introduced Annotations & Goals and Custom Metrics, giving agencies more control and visibility into performance. The platform expanded to over 80 integrations, including Google Local Services Ads, Salesforce, Spotify Ads, and Stripe.
2023
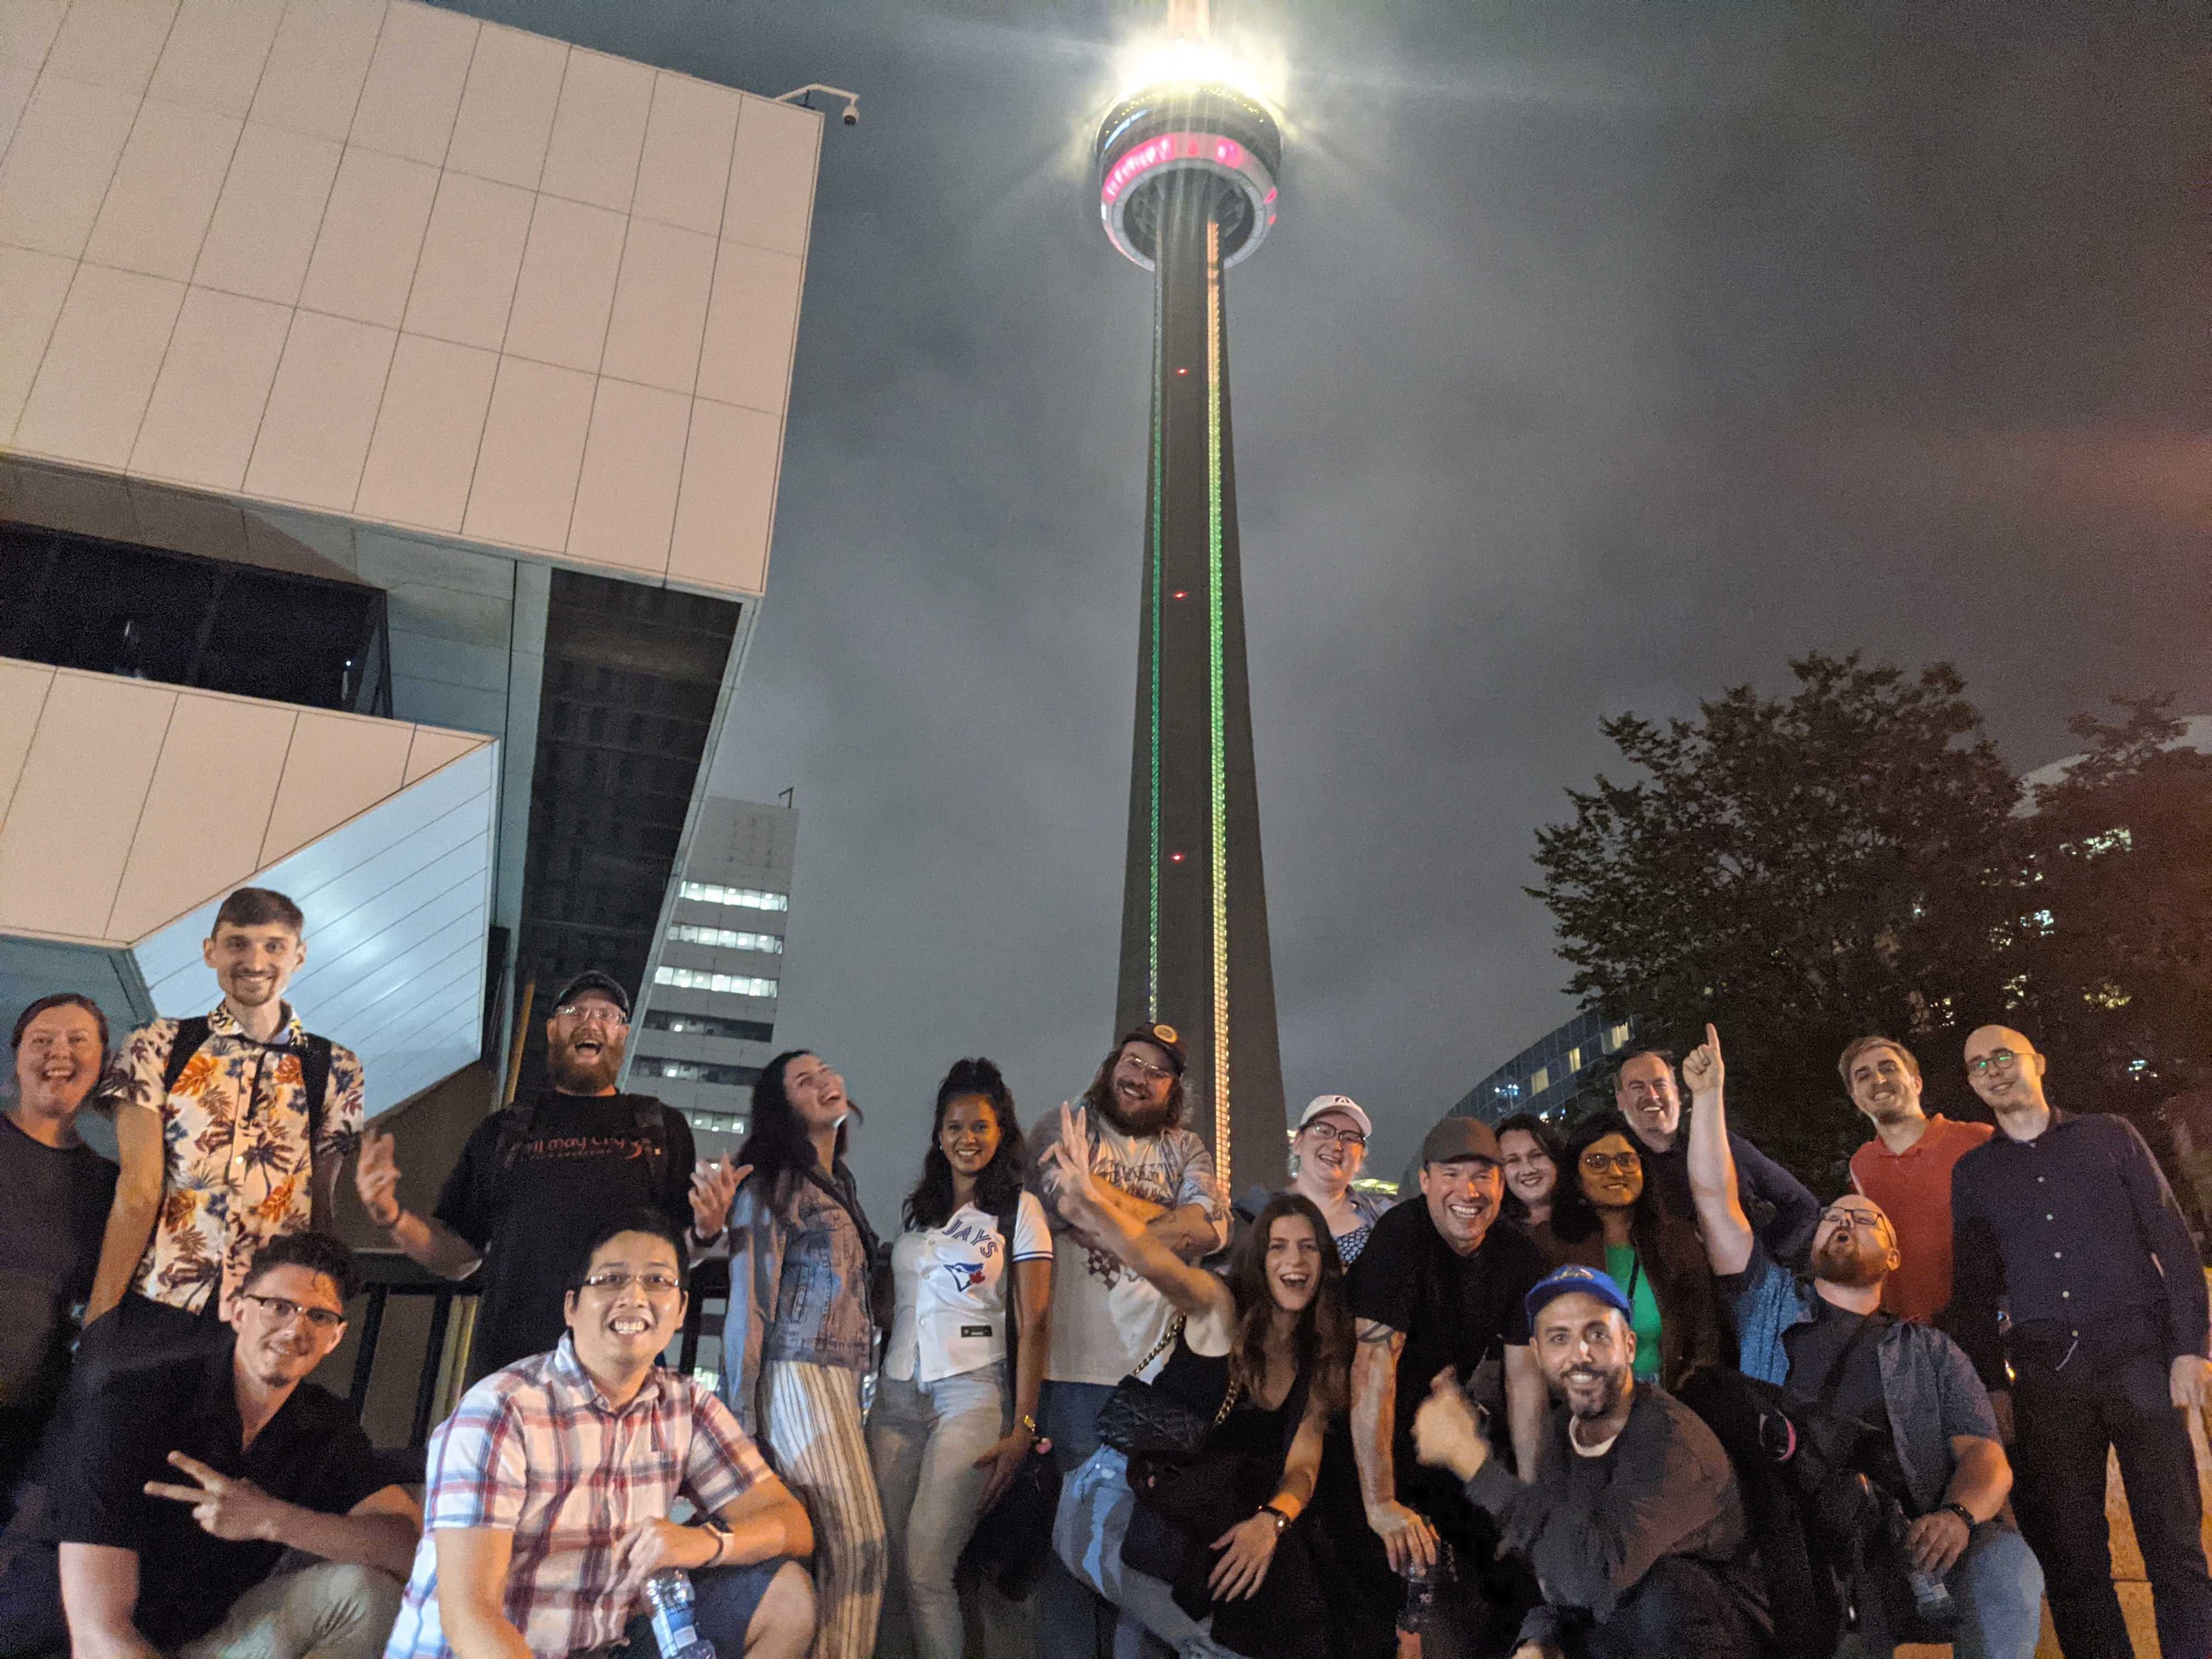
This year marked a few important milestones. We welcomed our 100th team member (!), got together for a Jays Game meetup, celebrated our first retirement, and opened a dedicated office space in Toronto. From cross-province meetups to the year-end holiday party at SPIN (a nod to where Joe, Blake, and Jesse once held their earliest business meetings), we kept strengthening the team in ways that remote calls couldn’t replicate.
The platform kept evolving, too. We launched the Google Sheets app, giving agencies an easier way to dive deeper into their data. Smart Reports made it faster to build client reports with the most commonly used metrics. Labs also went live, offering early access to tools still in development and pushing innovation forward.
2024
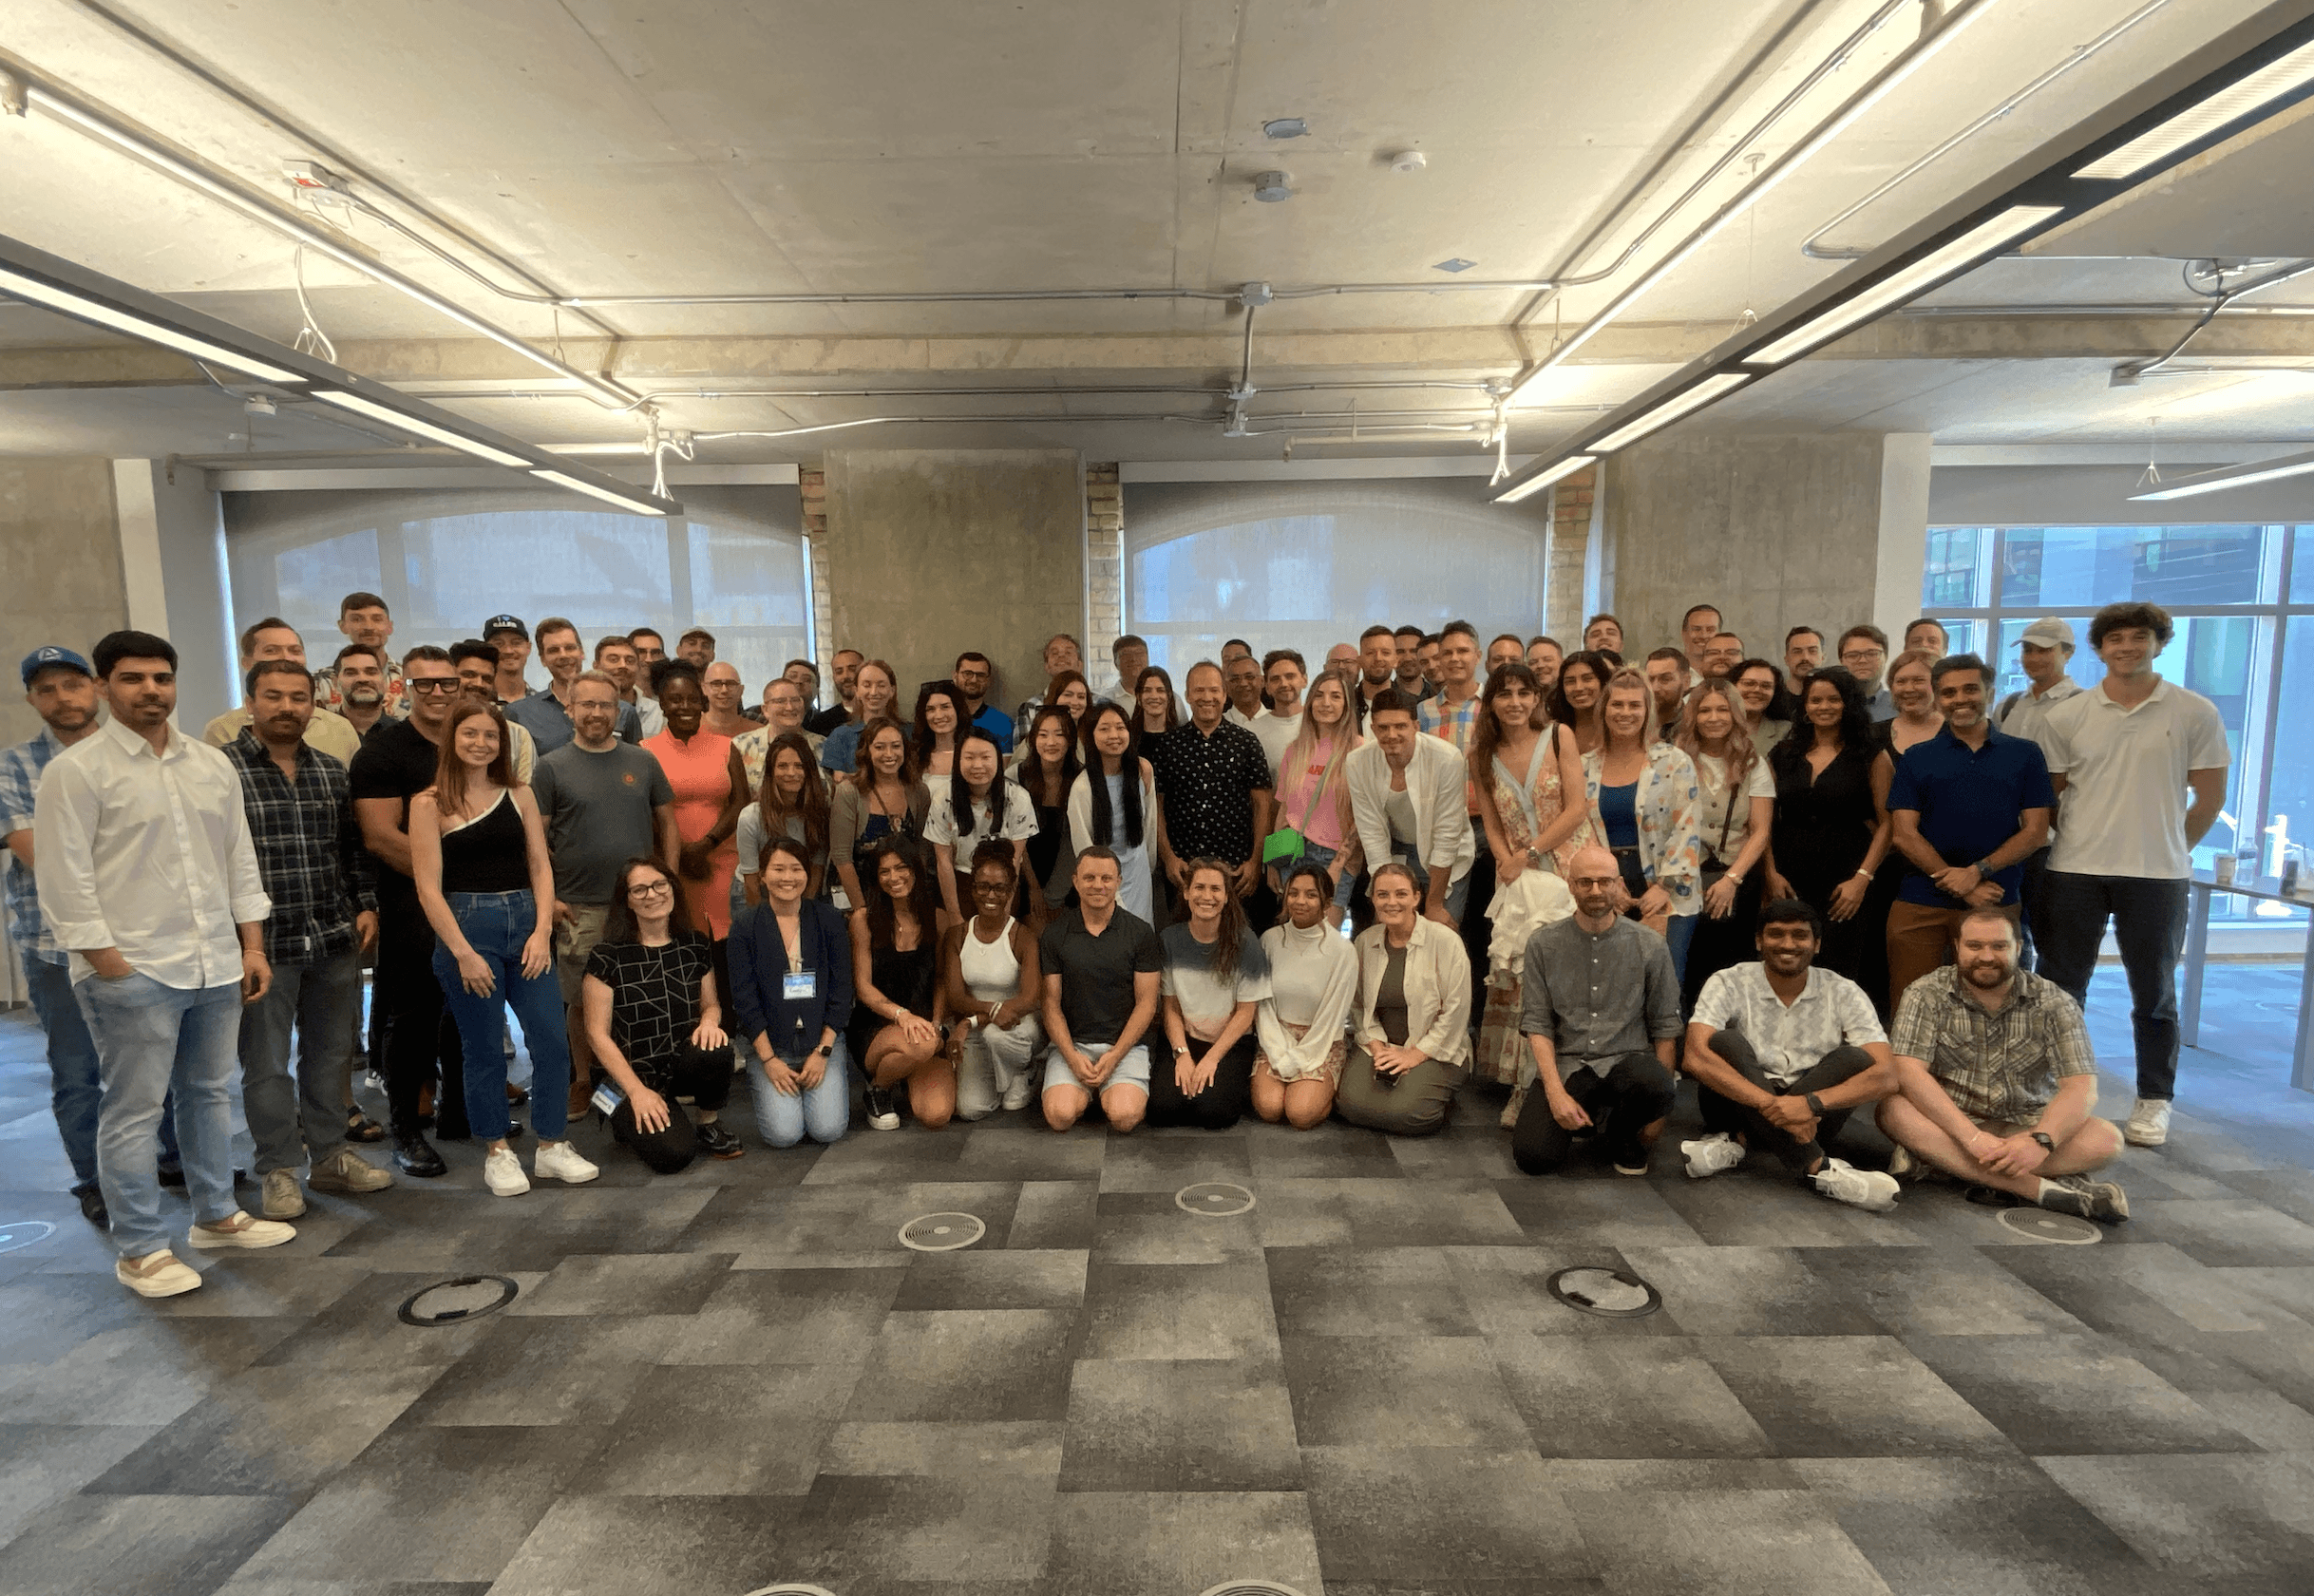
Our June meetup was a multi-day event focused on team building and in-person collaboration. It set the tone for the rest of the year to build stronger cross-team bonds.
We launched our first Employee Excellence Awards to spotlight standout contributors. And we wrapped up the year with a big win for the Pay it Forward Program, raising over $6,700 through wishlist items, gift cards, and more for our Holiday Helpers campaign.
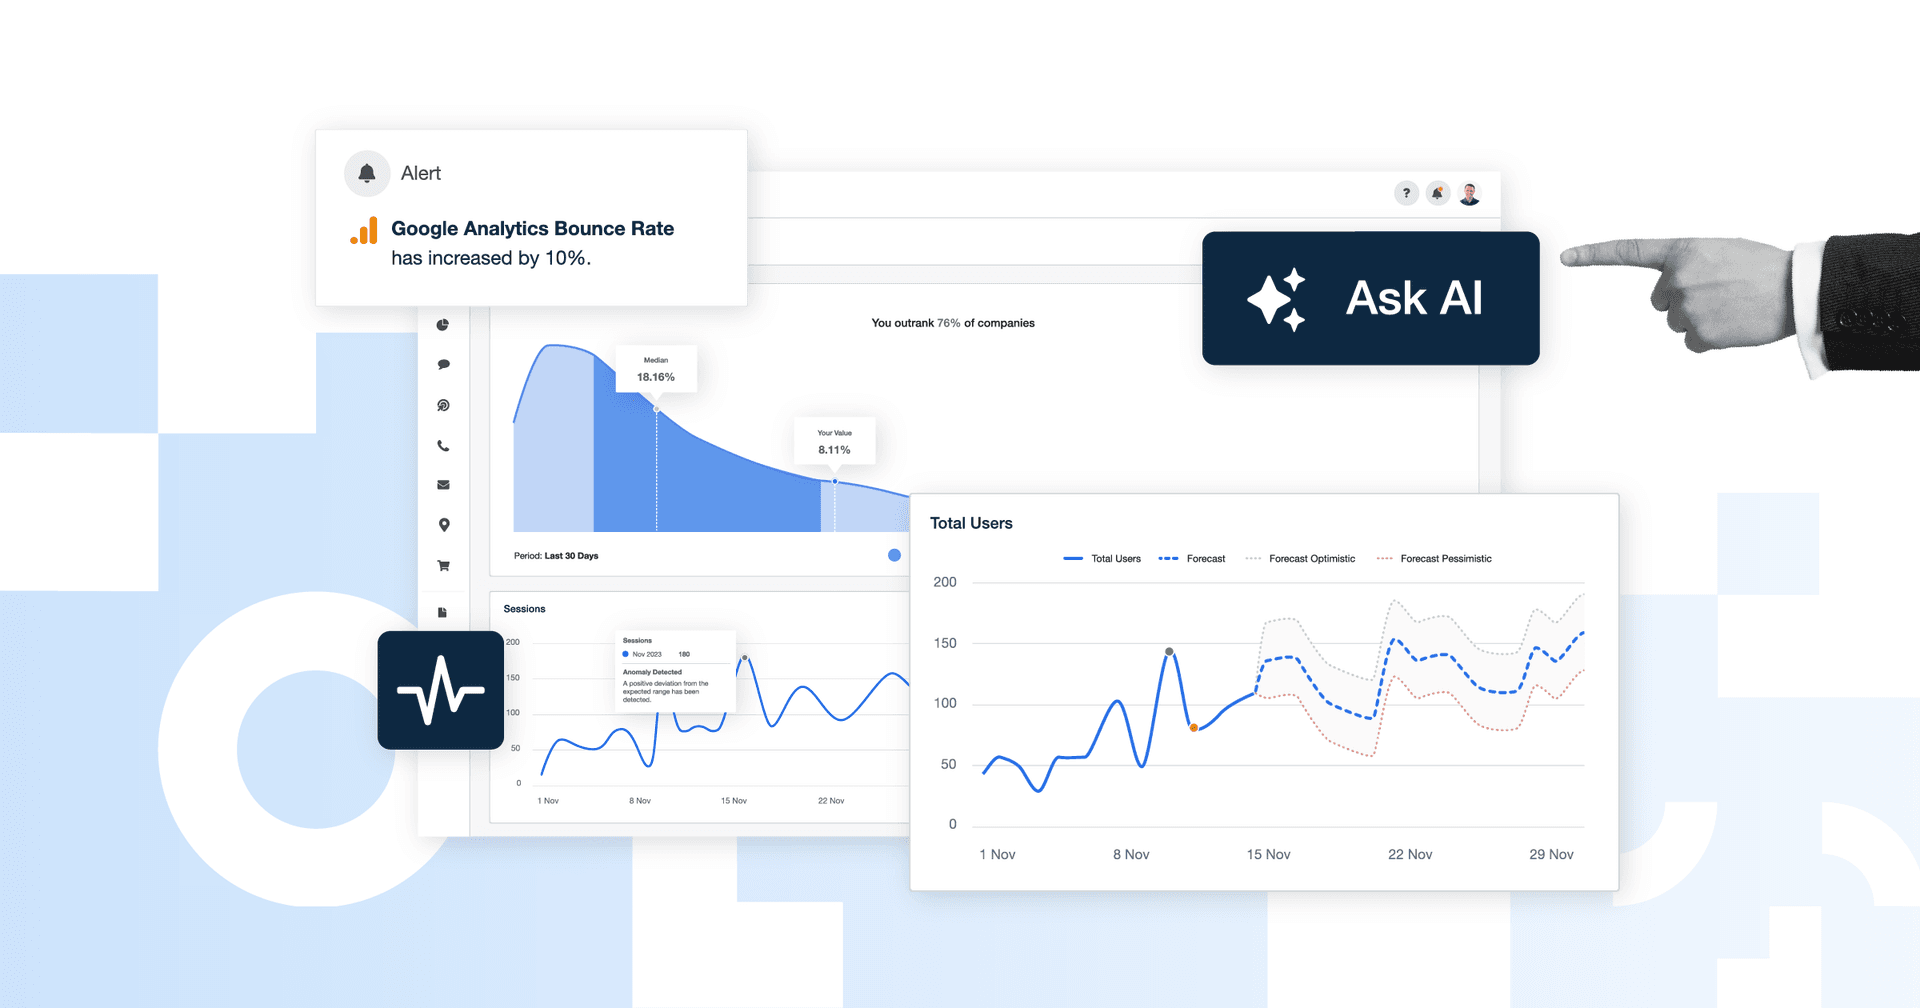
New AI reporting tools, including Ask AI, AI Summary, Benchmark Insights, Anomaly Detection, and Forecasting, were also introduced this year. These updates reflect where the industry is headed and what agencies are asking for: smarter tools that make data more actionable and insights easier to uncover.
A particularly notable event was when we were recognized by The Globe and Mail as one of Canada's Top Growing Companies in 2024, an honor we were thrilled to share with such an impressive list of business leaders.
2025
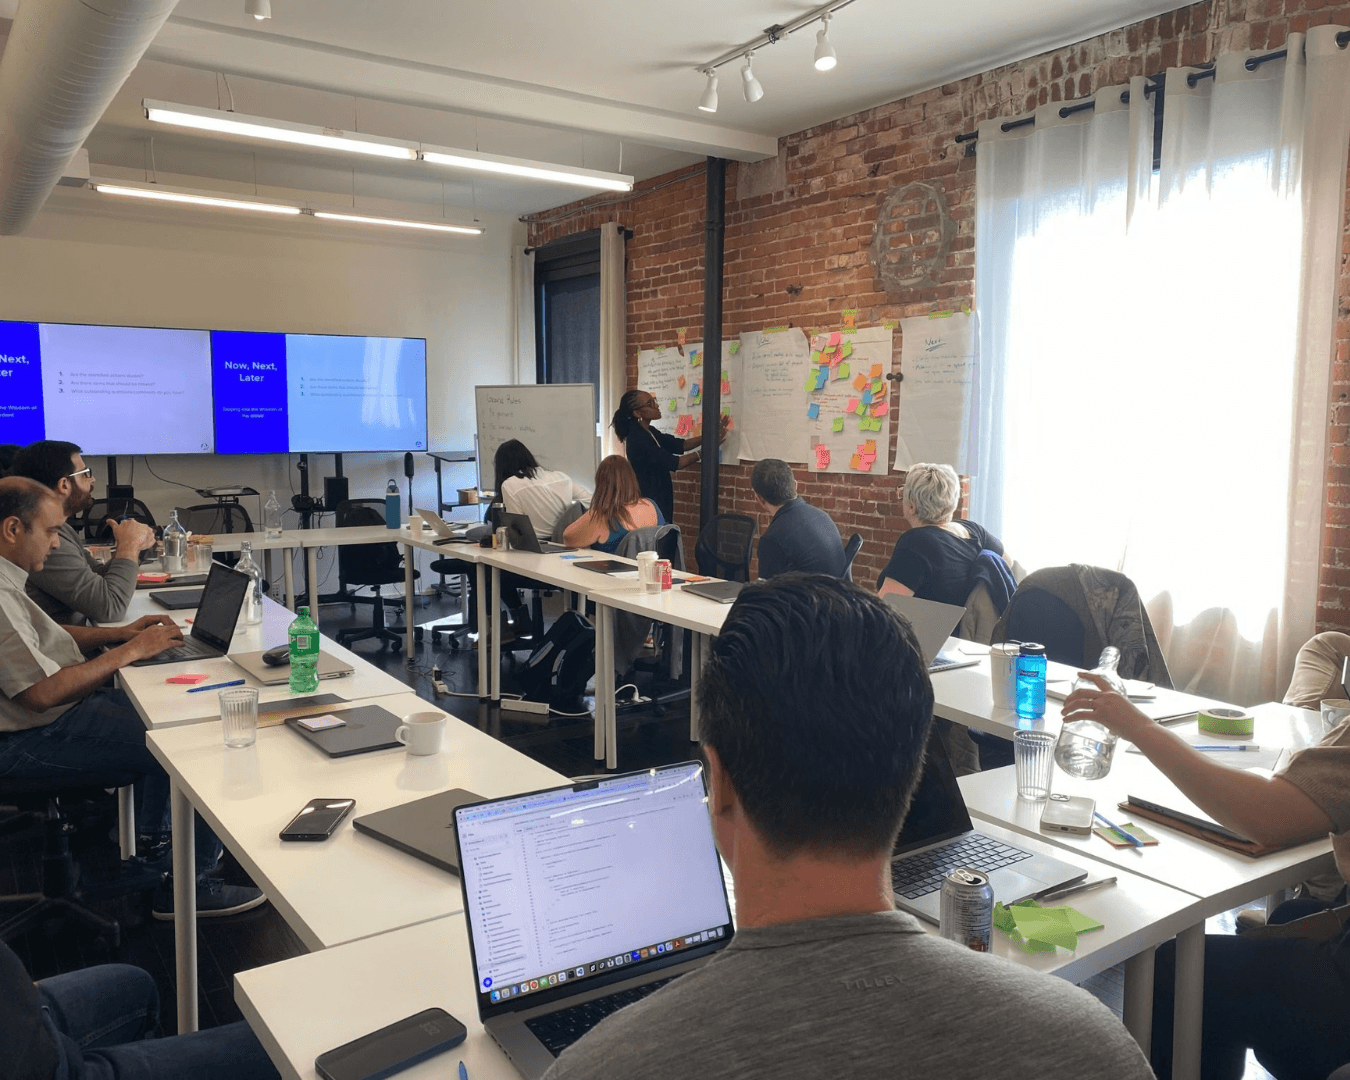
We kicked off the year with local meetups in Vancouver, Victoria, Toronto, and Calgary. Each one gave the team a chance to connect in person and share what they’ve been working on. We also hosted our first Extended Leadership Team meeting and started new ways to bring people together, like the Team Bake Off and our first Munch and Meet sessions.
This year, the number of agencies using the AgencyAnalytics platform rose to 7,000+, with 9 million reports created! Within those agencies, over 50,000 marketing experts use our platform, plus over 100,000 client users who have been given login access to view their agency’s work. AgencyAnalytics users now span across 103 countries worldwide, from Canada to Brazil to Japan and everywhere in between!
On the product side, we launched Slide Deck Reports and Bulk Operations, two major updates that give agencies more ways to showcase their value and streamline processes.
We are looking forward to what comes next, including our first-ever AgencyAnalytics Summit in June 2025. It will be a chance to connect, share ideas, and collaborate across teams.
Fifteen years in, and we’re still doing what we set out to do: build tools that work, and build a team that lasts.
Thank You to Our Customers
To every agency that’s grown with us, shared feedback, and trusted us to make your job a bit easier:
We’re here because of you.
Your support has shaped what AgencyAnalytics is today. It continues to drive us forward as we reimagine the platform with a more intuitive and agency-friendly interface. We are building new tools that go beyond reporting and help manage more of the day-to-day work that makes agencies successful.
As we look ahead to the future, we will remain steadily focused on functionality that helps agencies improve client outcomes, demonstrate their value, and save time in their day-to-day workflows. I’m incredibly proud of what AgencyAnalytics has become.
Thank you for being part of this journey. We’re just getting started.
Impress clients and save hours with custom, automated reporting.
Join 7,000+ agencies that create reports in minutes instead of hours using AgencyAnalytics. Get started for free. No credit card required.

Written by
Joe is the co-founder and CEO of AgencyAnalytics, a marketing reporting platform used by more than 7,000 agencies. With experience creating multiple businesses, he thrives on tackling the challenges of sustainable growth and innovation.
Read more posts by Joe KindnessSee how 7,000+ marketing agencies help clients win
Free 14-day trial. No credit card required.


