Table of Contents
Table of Contents
- Why Use Google Sheets?
- How AgencyAnalytics Helps with Automation
- The Three Main Ways to Import Marketing Data into Google Sheets
- How to Import Marketing Data from Top Platforms to Google Sheets Using AgencyAnalytics
- How To Quickly and Easily Export Data from Google Sheets into AgencyAnalytics
- Google Sheets Widget Types
- Embedding Google Sheets in an Existing Marketing Dashboard
- Benefits of the AgencyAnalytics for Google Sheets Import and Export Integrations
- Practical Ideas for Customizing and Analyzing Marketing Data
- Summary and Key Takeaways
7,000+ agencies have ditched manual reports. You can too.
Free 14-Day TrialQUICK SUMMARY:
Marketing agencies use Google Sheets to automate workflows and streamline data tasks, enhancing efficiency and accuracy. Automating client reporting with Google Sheets reduces manual effort, minimizes errors, and improves data security. This article outlines the quick and easy ways to import or export data using Google Sheets and AgencyAnalytics, highlighting the benefits of streamlining and optimizing data management.
Doing great work that directly impacts the bottom line for clients is a must for successful marketing agencies. And because the proof is always in the pudding, tracking and reporting on data is a huge part of what marketers do on a daily basis.
While most mature agencies use specialized client reporting platforms like AgencyAnalytics to consolidate their client data across countless channels for tracking and reporting purposes, there are times when marketers need to dive deeper into the metrics. It’s times like these that nothing will do quite like a simple and reliable Google sheet.
Digital spreadsheet technology is FAR from new. But even though it dates back to the late 70s, nearly 80% of marketers still say it’s critical to their work, according to a recent MarTech survey.
Extracting, combining, and manipulating marketing metrics in spreadsheets reveals all kinds of new insights and perspectives that take marketing strategy and client reporting from great to ground-breaking. In a spreadsheet, data can be combined, transformed, normalized, or backed up for as long as you and your clients need it. And this really is just scratching the surface of what marketers do with their data.
However, even with the more modern and very user and team-friendly option of Google Sheets, there’s a challenge marketers often face:
How to get all the data you need from all the marketing channels you and your clients use imported and formatted in a way clients will appreciate—and without pulling your hair out?
This one’s for all the data nerds, along with the marketing agency teams out there dreaming of an easier and streamlined data analysis process!
Why Use Google Sheets?
The reason Google Sheets is such a core integration with AgencyAnalytics is that it allows agencies to import, export, manipulate, and display data from any third-party tool and showcase it in a dedicated report or dashboard.
AgencyAnalytics is designed to unify data from all channels into a single location. Sometimes, however, this data may come from a tool that isn’t currently integrated with the platform or additional, custom calculations are needed—this is where Google Sheets comes in.
In particular, a few examples of Google Sheets use cases include:
Data from unsupported integrations that you still want to monitor or report on
In-house data that your agency has collected
Data that originates from custom or manual calculations
Data that is being sent into a Sheet from an automation tool like Zapier
Deeper data analysis or custom calculations
In short, Google Sheets can be incredibly useful for data collection and manipulation, but it typically needs to be combined with data visualization tools to be valuable to clients.
How AgencyAnalytics Helps with Automation
At its core, AgencyAnalytics is designed to save agencies time and money by automating many of their manual reporting tasks. In the context of Google Sheets, this means that the platform will automatically pull in the latest Sheets data, meaning that as soon as you open a dashboard or web-based report, all of the data will be up-to-date.
But data doesn't only go one way! The Google Sheets App makes it easy to extract the automatically collected data from AgencyAnalytics and import it into Google Sheets for deeper data insights.
Another way that the integration helps with automation is with the date range functionality that many of our Google Sheets have. Just like many of our other integrations, this means you can set a Google Sheets widget to automatically follow the date range of the dashboard or report. For example, if you’re sending a monthly report you can ensure that the Google Sheets widgets will only display the current month’s data, even if there is additional data in the Sheet outside of this date range.
With AgencyAnalytics, we cut back the time to create great marketing reports by almost 60%. To be able to service more clients with the same people gives our agency the possibility to grow.
Nico de Jong, CEO of Forward Marketing
The Three Main Ways to Import Marketing Data into Google Sheets
Direct from the Platform
As a marketer, you’d like to get some of the great data that lives inside the tools you and your clients use out of those tools and into Google Sheets.
Maybe you want to add up and display engagement numbers across all of a client’s social platforms.
Or perhaps you’d like to see a side-by-side comparison of how a client’s ad impressions on various platforms impacted their call numbers—all compared to their new customer growth over the same specific time period.
Phew. The reality is, if your agency doesn’t use a data automation tool, you’re going to have to pull all that data directly from each platform—and the process is going to involve some manual effort.

Logging in and navigating from platform to platform to natively export data takes time in and of itself. Then there’s the task of having to sort through and format all that raw data to get at the specific numbers you’re actually looking for. And once you have all the data you need in Google Sheets, formatted just the way you like, it’s immediately outdated.
The entire process just described also involves a lot of manual human intervention. And of course, any time humans are doing things, there’s the potential for errors to be introduced.
All that to say, exporting marketing data directly from platforms and adding it to Google Sheets (or any other spreadsheet platform, for that matter) IS an option.
Is it a good one? Hmmm… we think you can do better than manually creating spreadsheets.
Set up API connectors
A little automation can go a long way when it comes to moving your important marketing data, and using an API connection between your various marketing platforms and Google Sheets is another potential option.
For example, you’ll find plug-ins for both Google Ads and Google Analytics right from the Google Workspace Marketplace. These extensions automatically pull the data you need from one platform to the other. And you may be able to set up API connections between Google Sheets and some of your other marketing platforms too.
In theory, this process could solve your data import problem so long as you’re able to connect all the platforms you need to import data from. However, it also means having to connect and maintain potentially dozens of different apps and connectors.
Seems like a lot of effort for a process you’re trying to automate.
Can we do better, still?
Using a Data Automation Tool
Using a data automation tool like AgencyAnalytics to import marketing data into Google Sheets eliminates many of the challenges and limitations of doing it directly from each platform.
Once installed, the AgencyAnalytics for Google Sheets app connects with all of the client tools your agency is already using for tracking and reporting. You simply need to start building queries to hand-pick the specific data you need.
There are clear benefits to importing your agency’s client data into Google Sheets using a data automation tool.
Your team members:
Stop moving marketing data manually from each platform
Spend valuable time analyzing and manipulating the data instead
Win back billable hours by automating data migration and marketing reporting
Also, say so-long to outdated data, which is HUGE. A quick click of the refresh button gives you the latest numbers directly from your AgencyAnalytics reporting platform.
Automation AND accuracy when it comes to your marketing data?
We think it’s a no-brainer.
If you have to use spreadsheets, automate the data retrieval process to reduce manual effort and the potential for human errors using the Google Sheets app from AgencyAnalytics.
How to Import Marketing Data from Top Platforms to Google Sheets Using AgencyAnalytics
We’ve covered the ‘why,’ but what about the how?
It’s a snap to start automatically importing marketing data from the top platforms your agency and its clients use straight into Google Sheets. Once your agency has its AgencyAnalytics account set up, the Google Sheets app is a quick-to-install extension that helps you transform your data in all new ways.
Don’t have an AgencyAnalytics account yet? Get started today with a 14-day free trial!
Step 1: Install the App

To begin, click here, or navigate to Google Workspace Marketplace, search ‘AgencyAnalytics,’ and hit the Install button in the top right corner of the page.
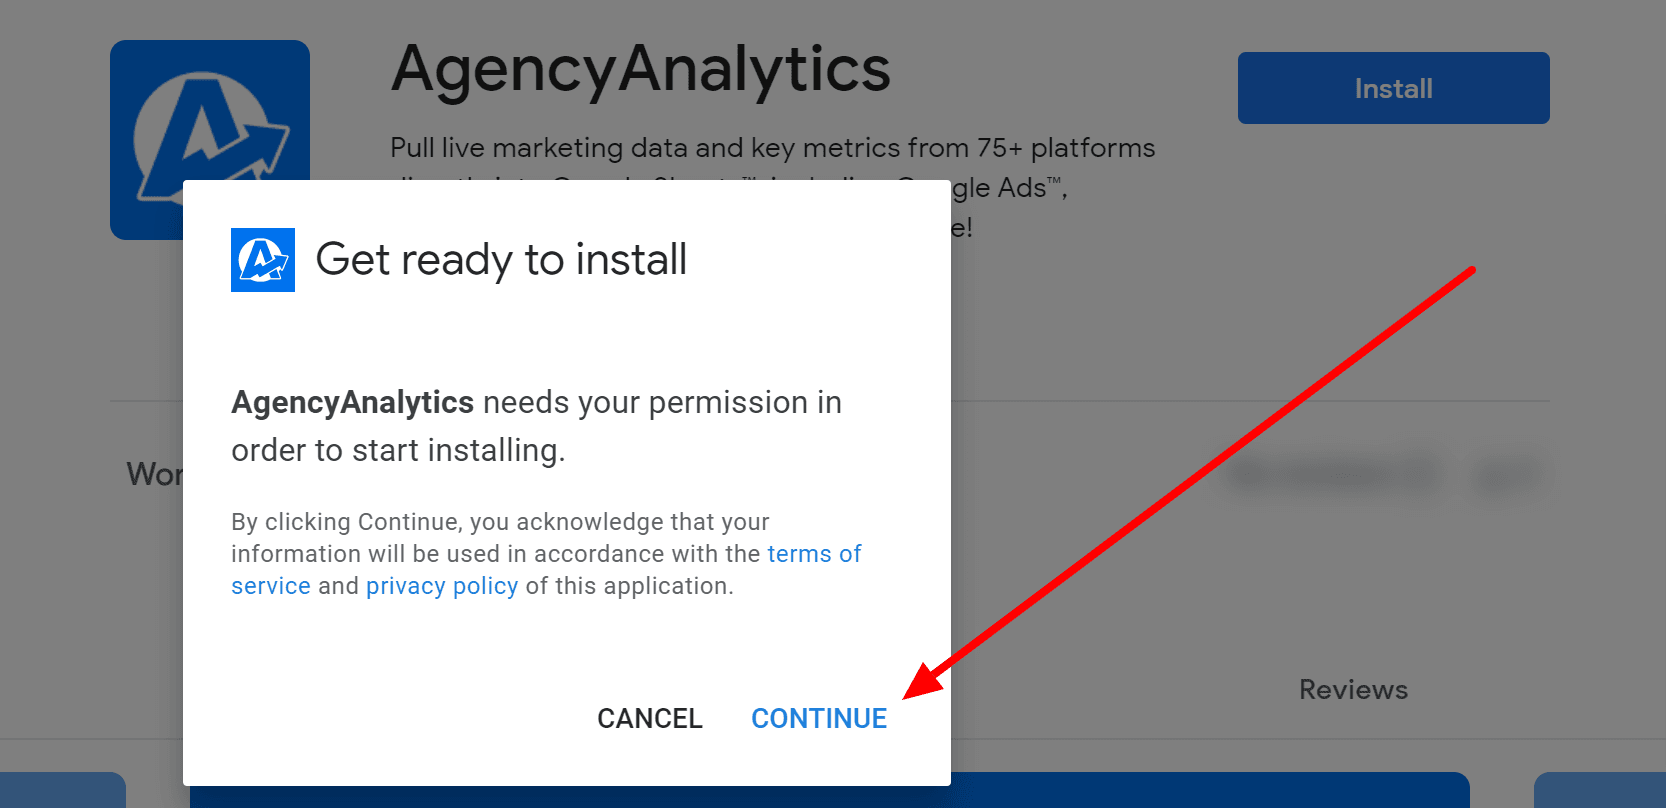
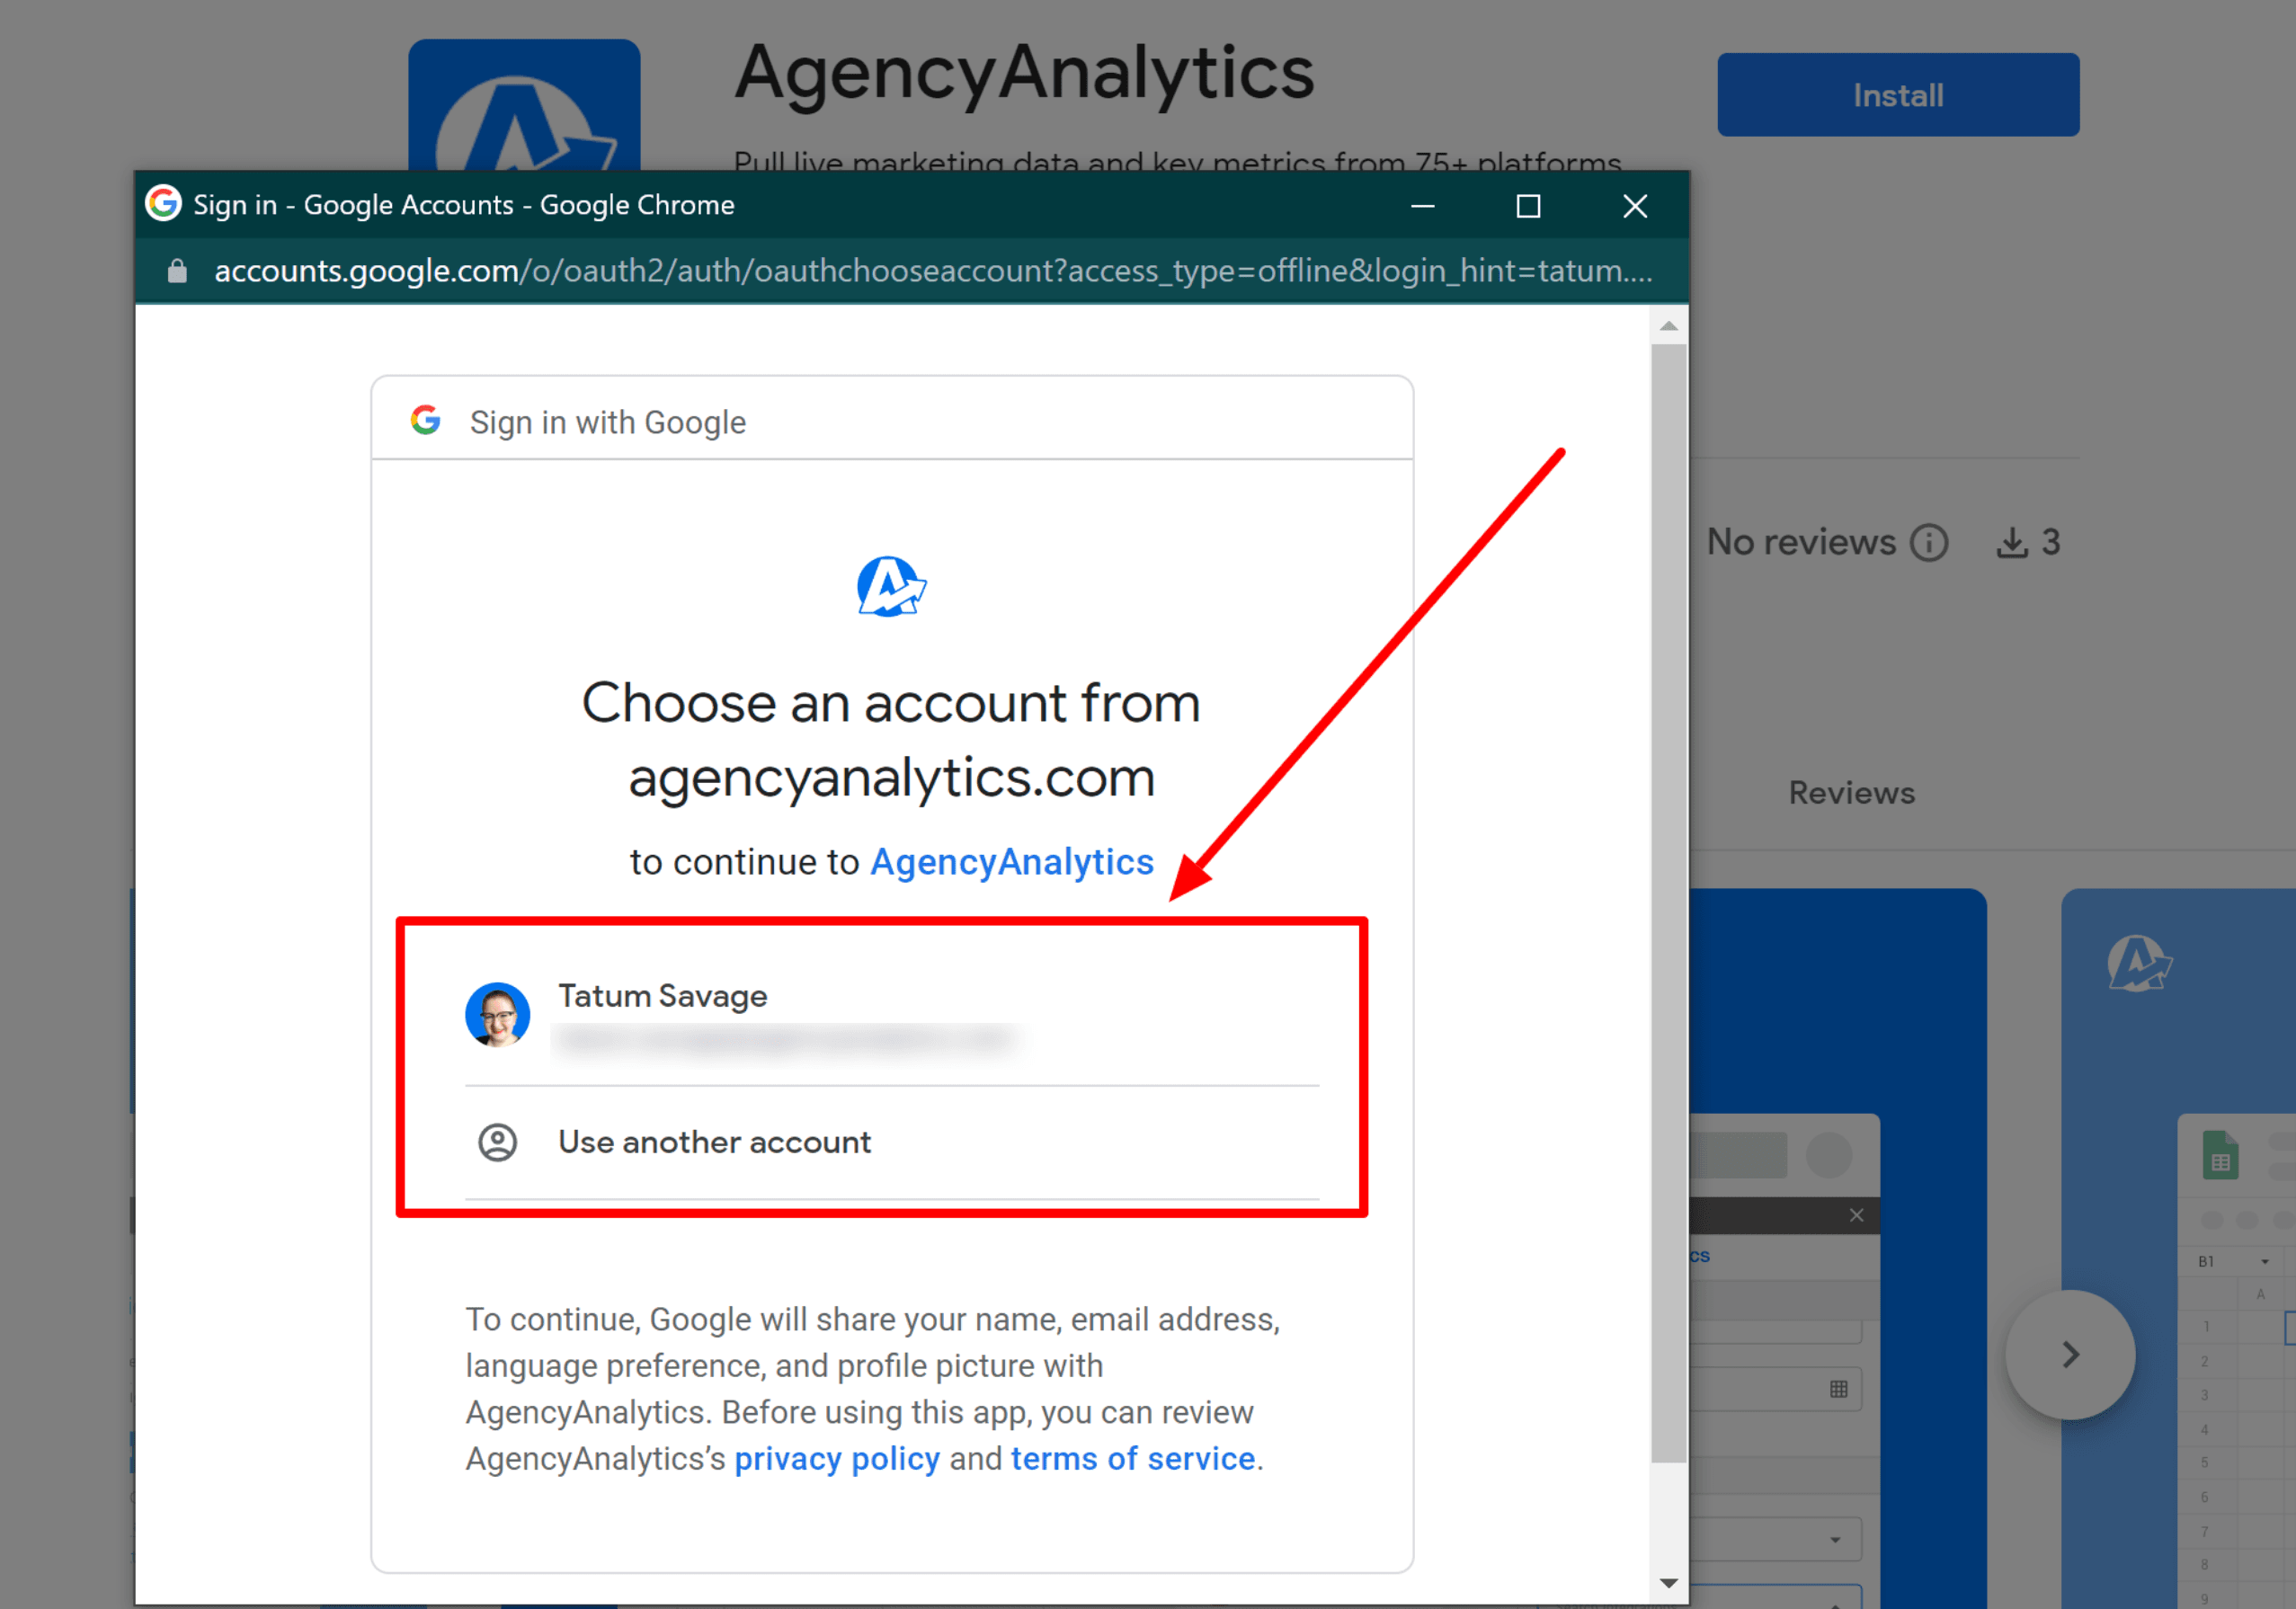
After confirming your permission to start the installation process, select which account you’d like to use with the AgencyAnalytics for Google Sheets app.
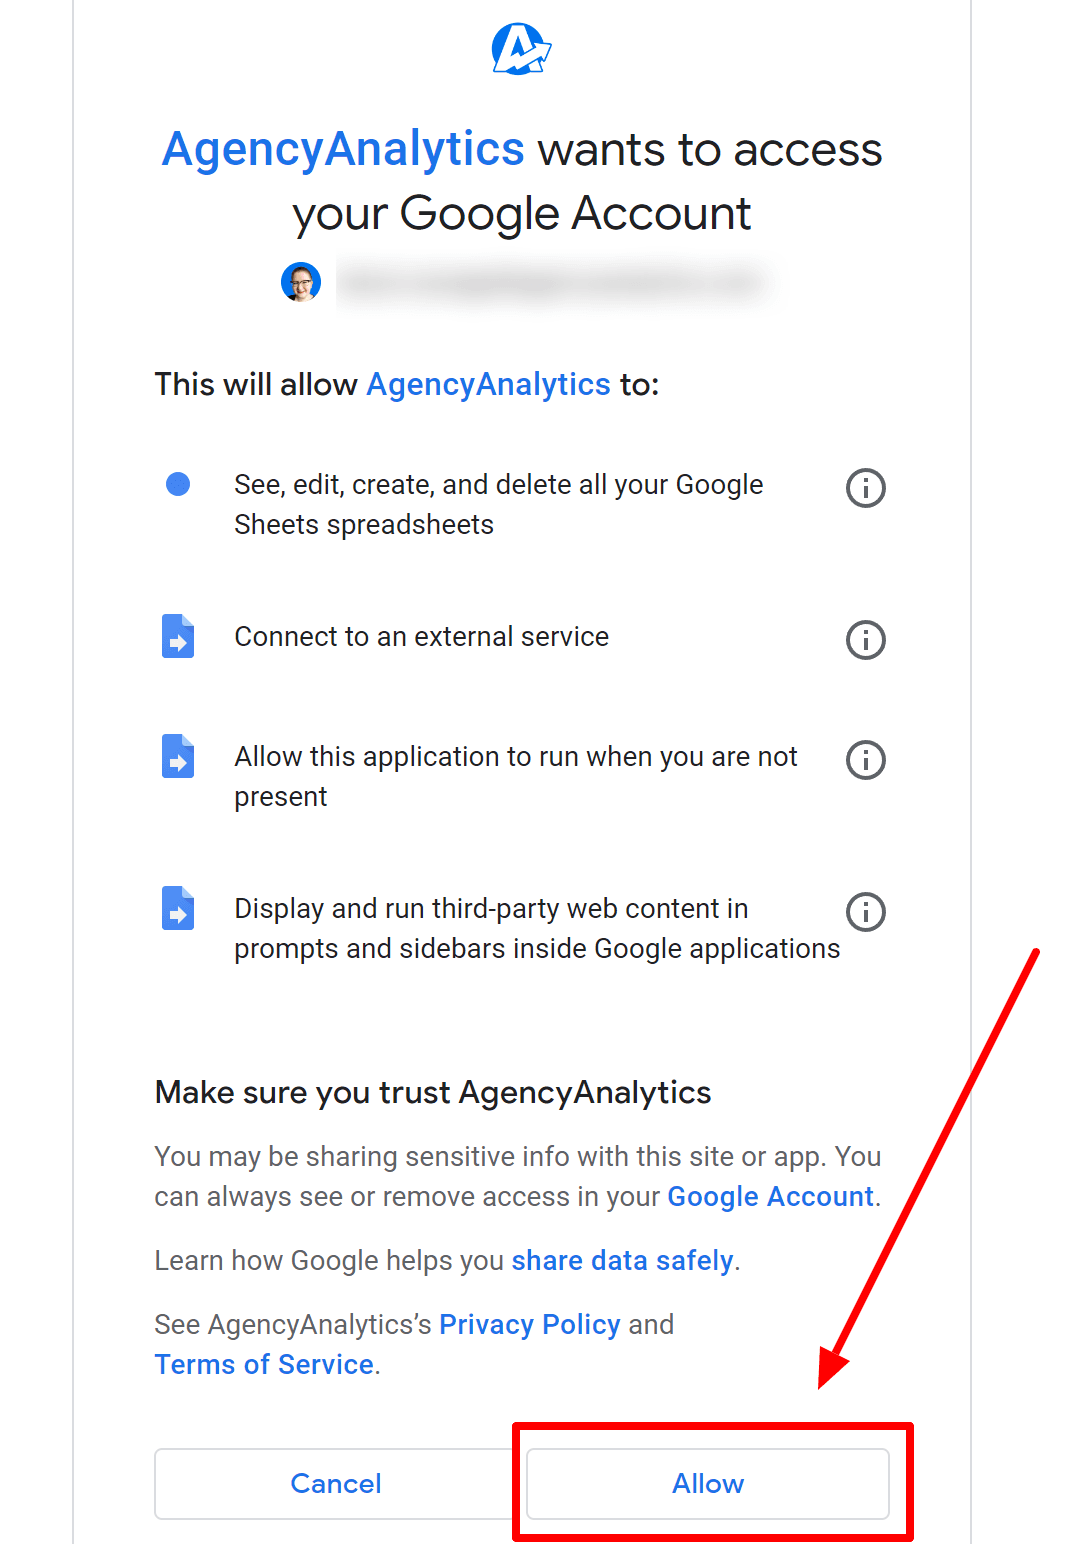
Finally, select ‘Allow’ on the final authorization page to confirm your permission, and then it’s time to get into Google Sheets!
Step 2: Open AgencyAnalytics in Google Sheets and Log In
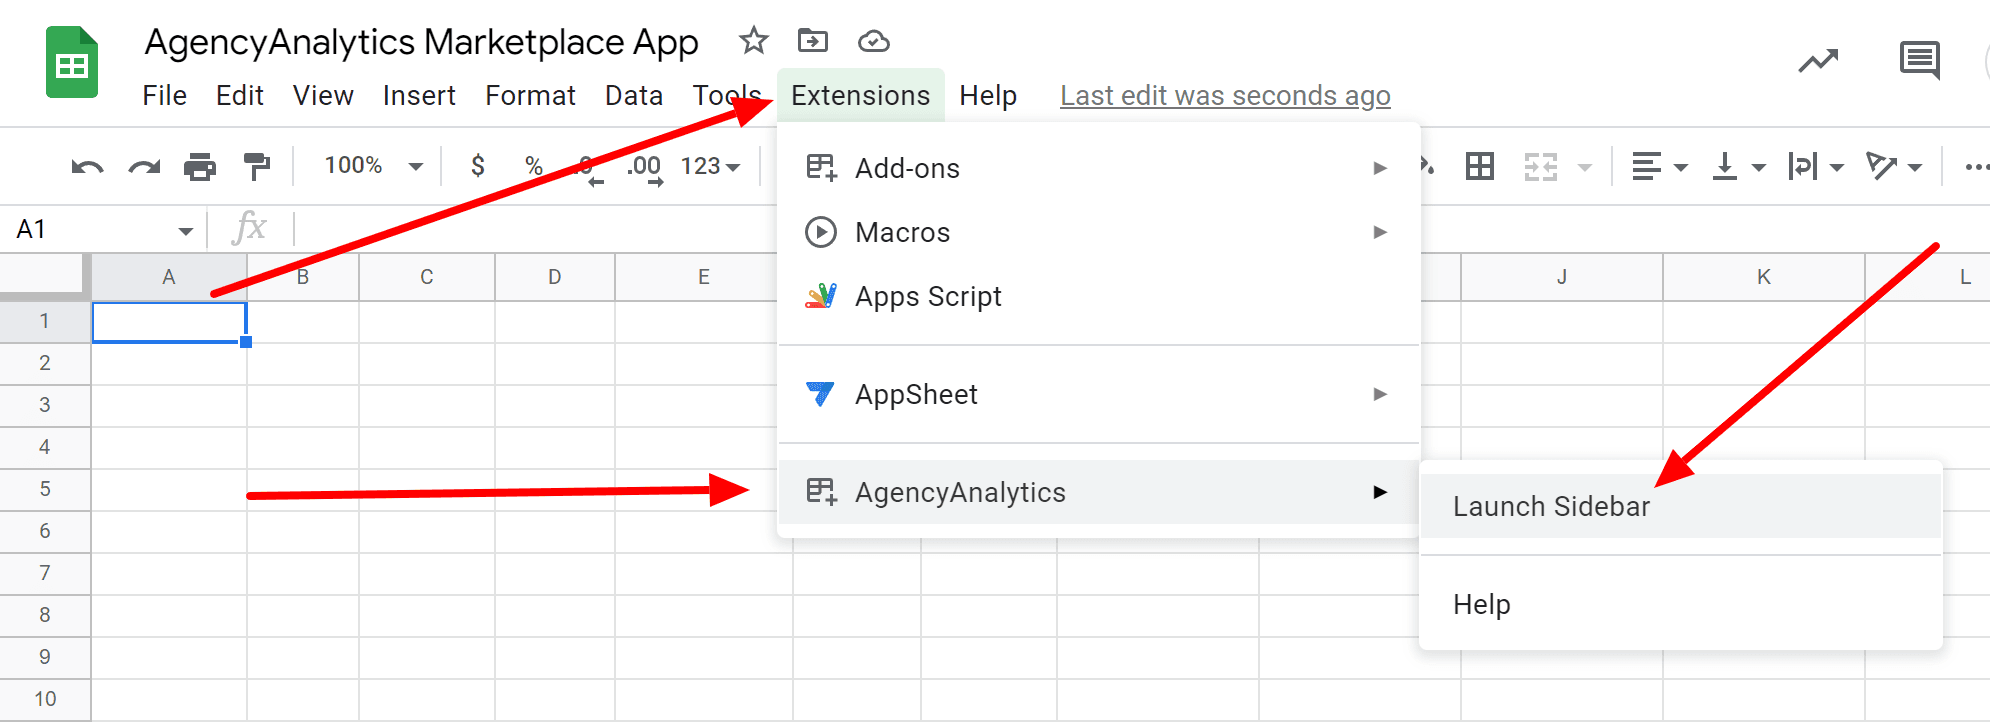
Once you’ve opened a Google sheet, you’ll find your new app in the ‘Extensions’ drop-down. Select ‘Launch Sidebar’, and you’ll be ready to log in to your AgencyAnalytics account. By doing this, you’ll also connect with all of the integrated platforms already associated with your account.
There are a couple of options for logging in, depending on the type of AgencyAnalytics user you happen to be.
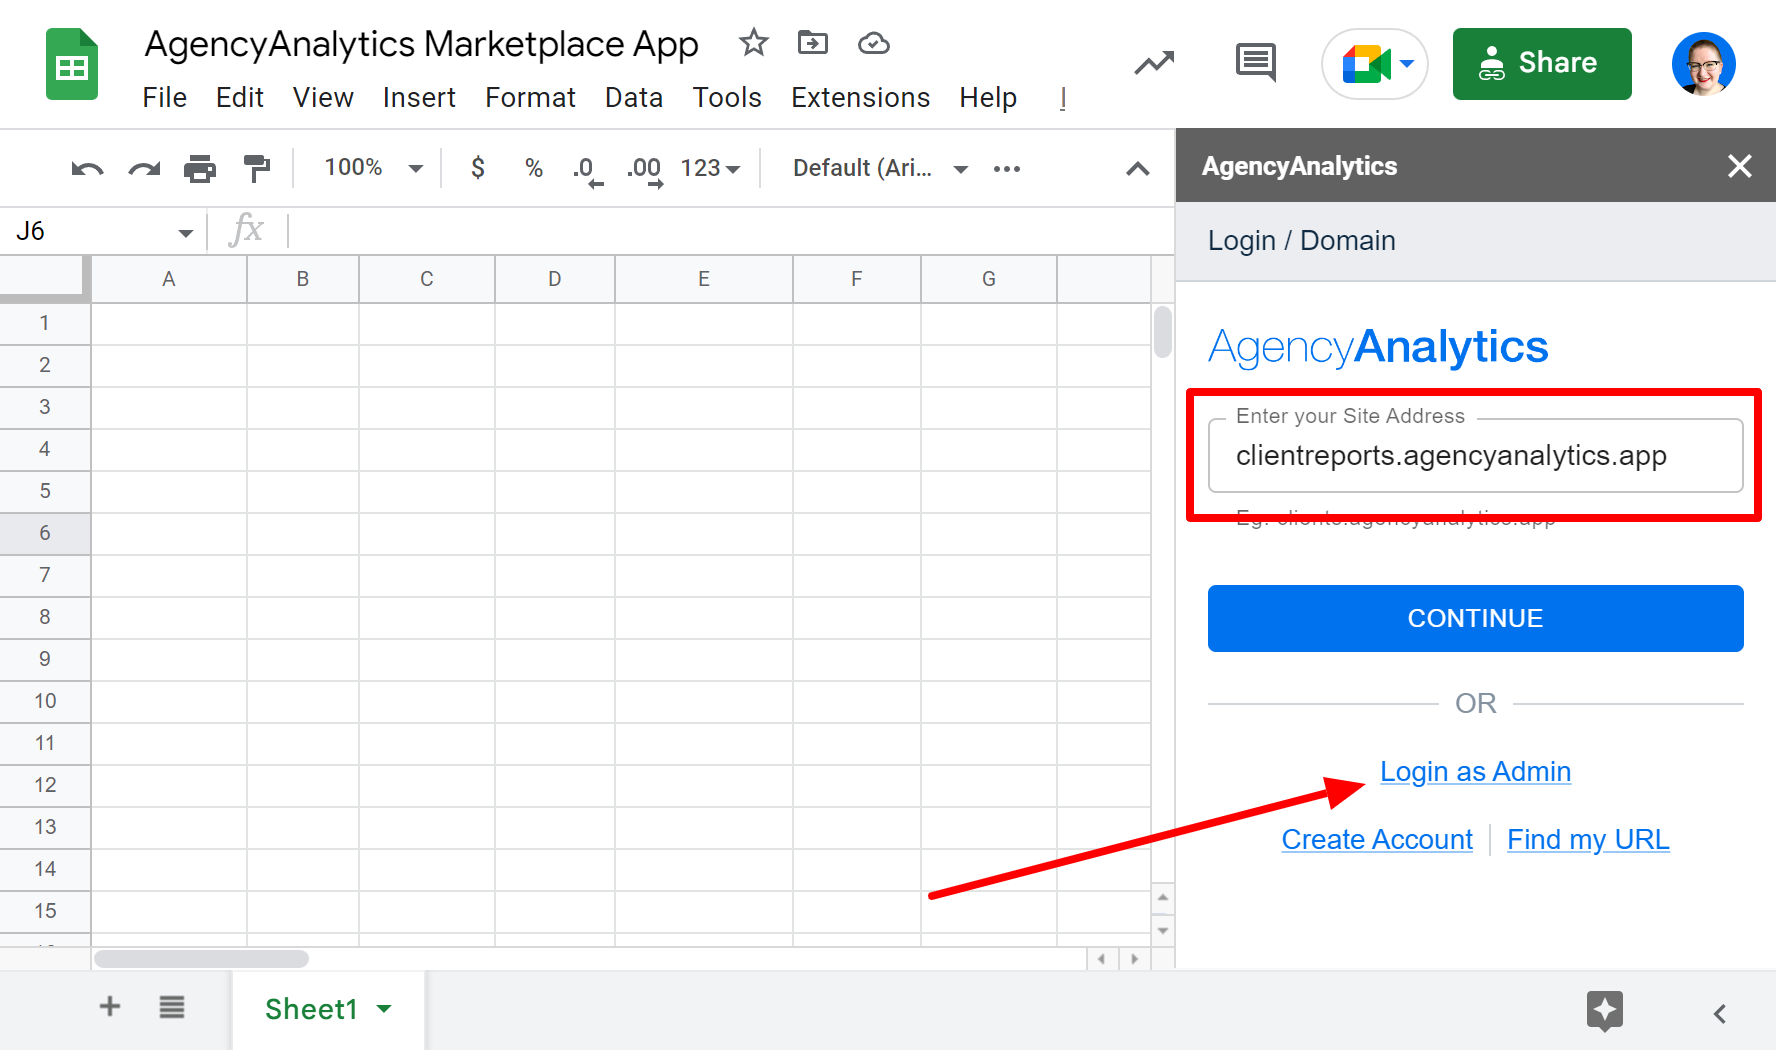
Staff users: Click the site address field and enter the URL you use when logging into AgencyAnalytics. If you aren’t sure which URL to use, follow the steps here.
Admin users: If you’re the admin user of your AgencyAnalytics account, click on ‘Login as Admin.’ Use the same email address and password you use to log in to AgencyAnalytics.
Step 3: Create a Query
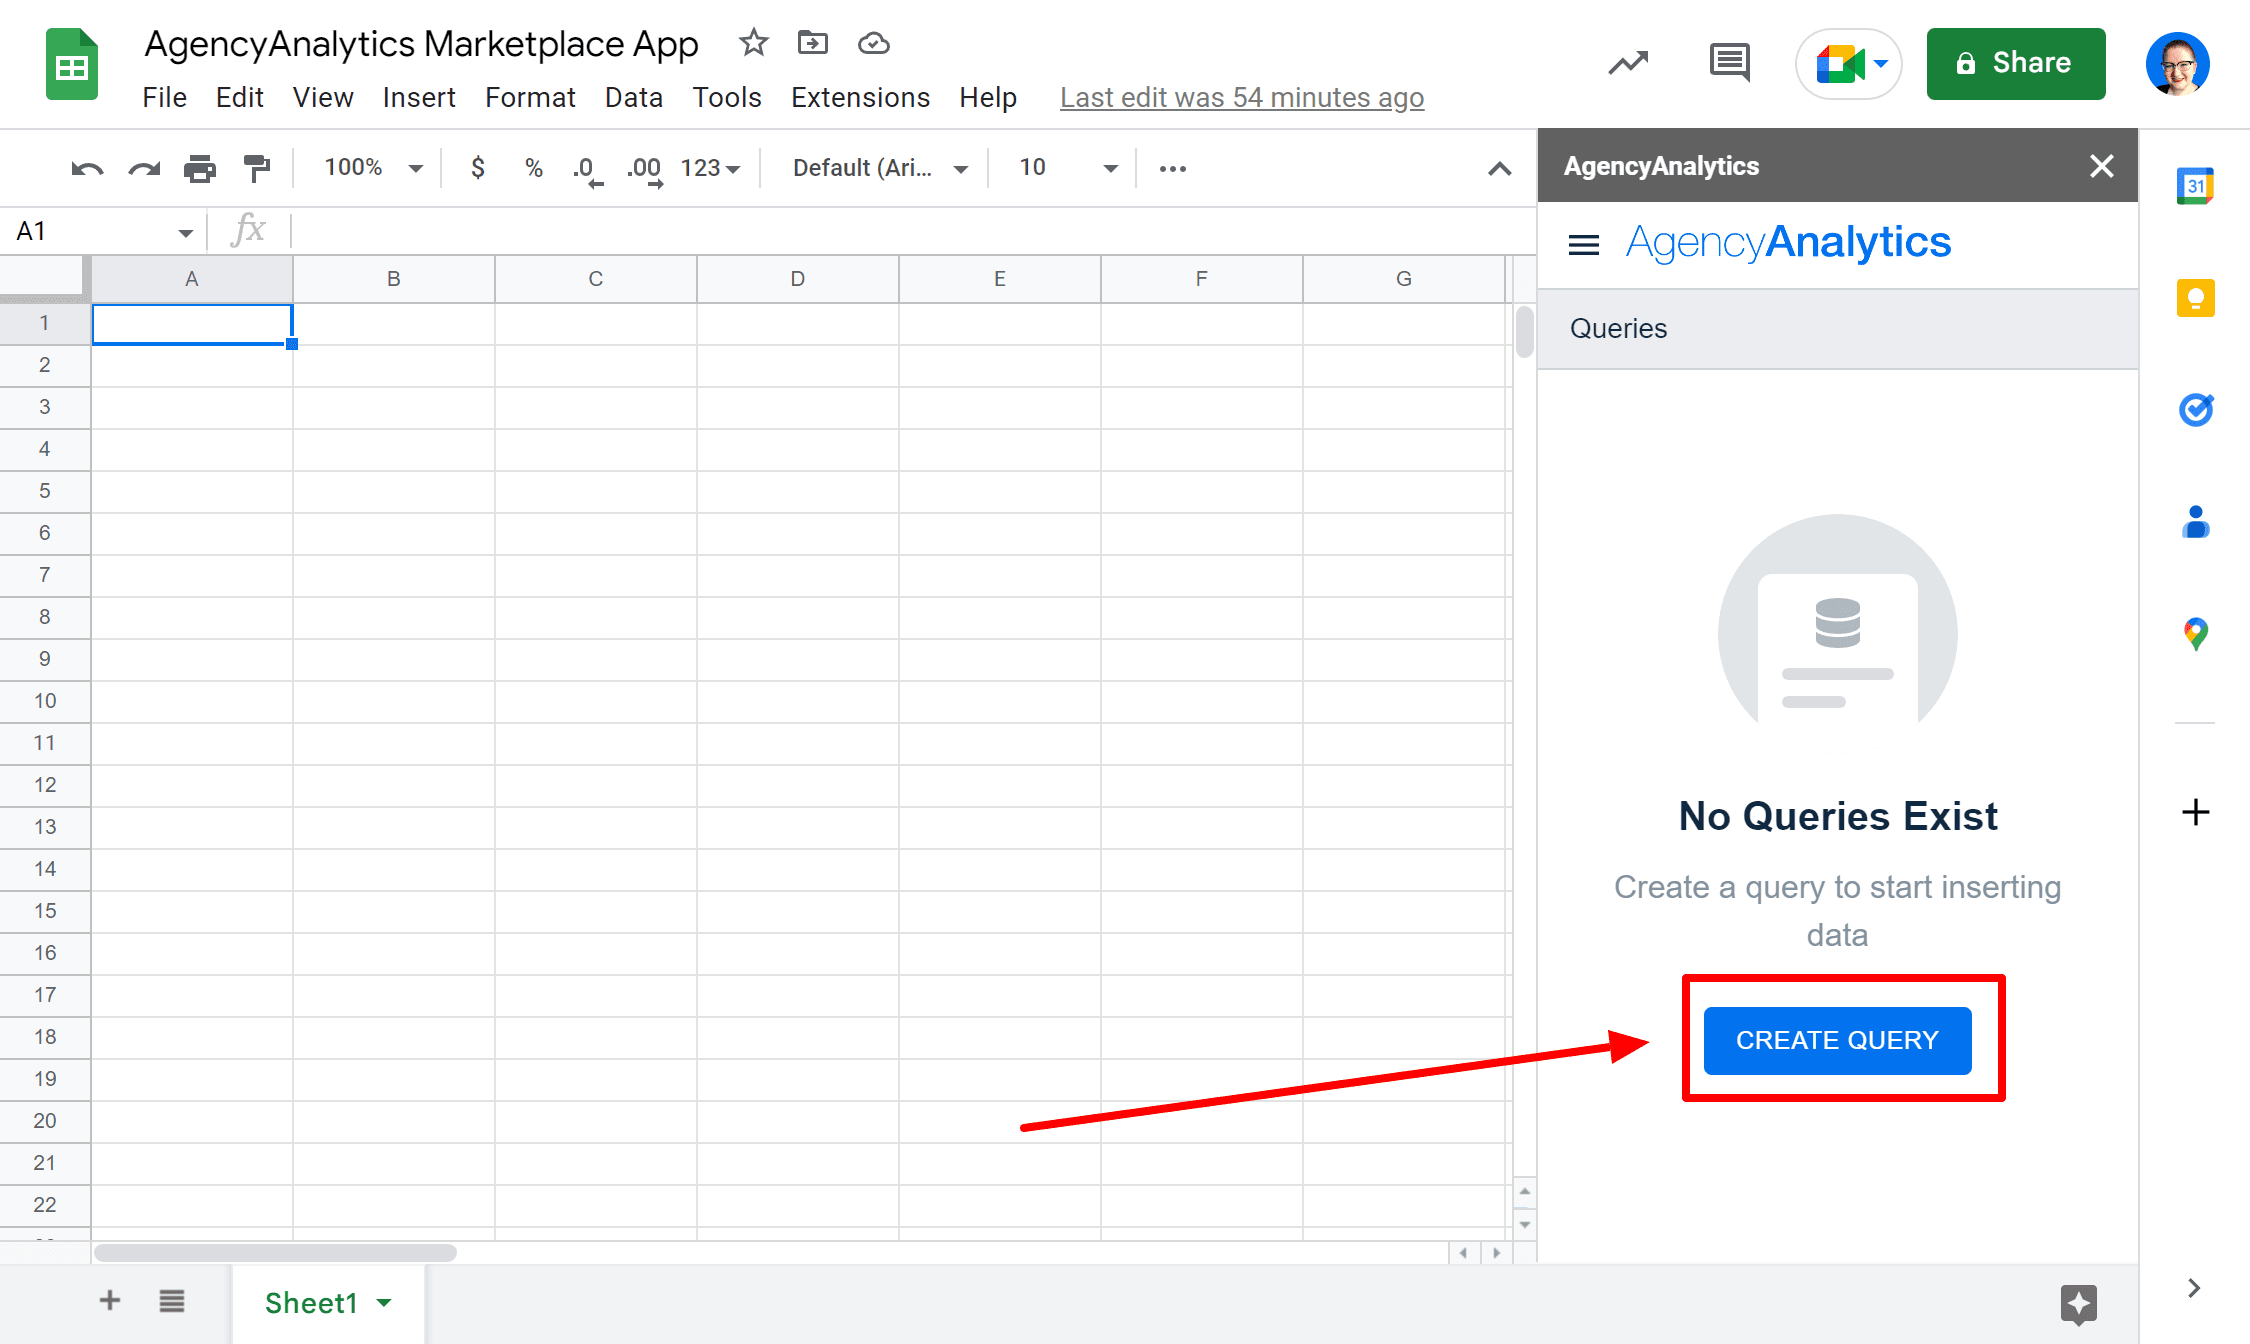
You’ve installed, authenticated, and logged in, and now you’re ready to create your first data query. 🙌
Clicking the ‘Create Query’ button takes you right into the query creation process—all you have to do is follow the steps!
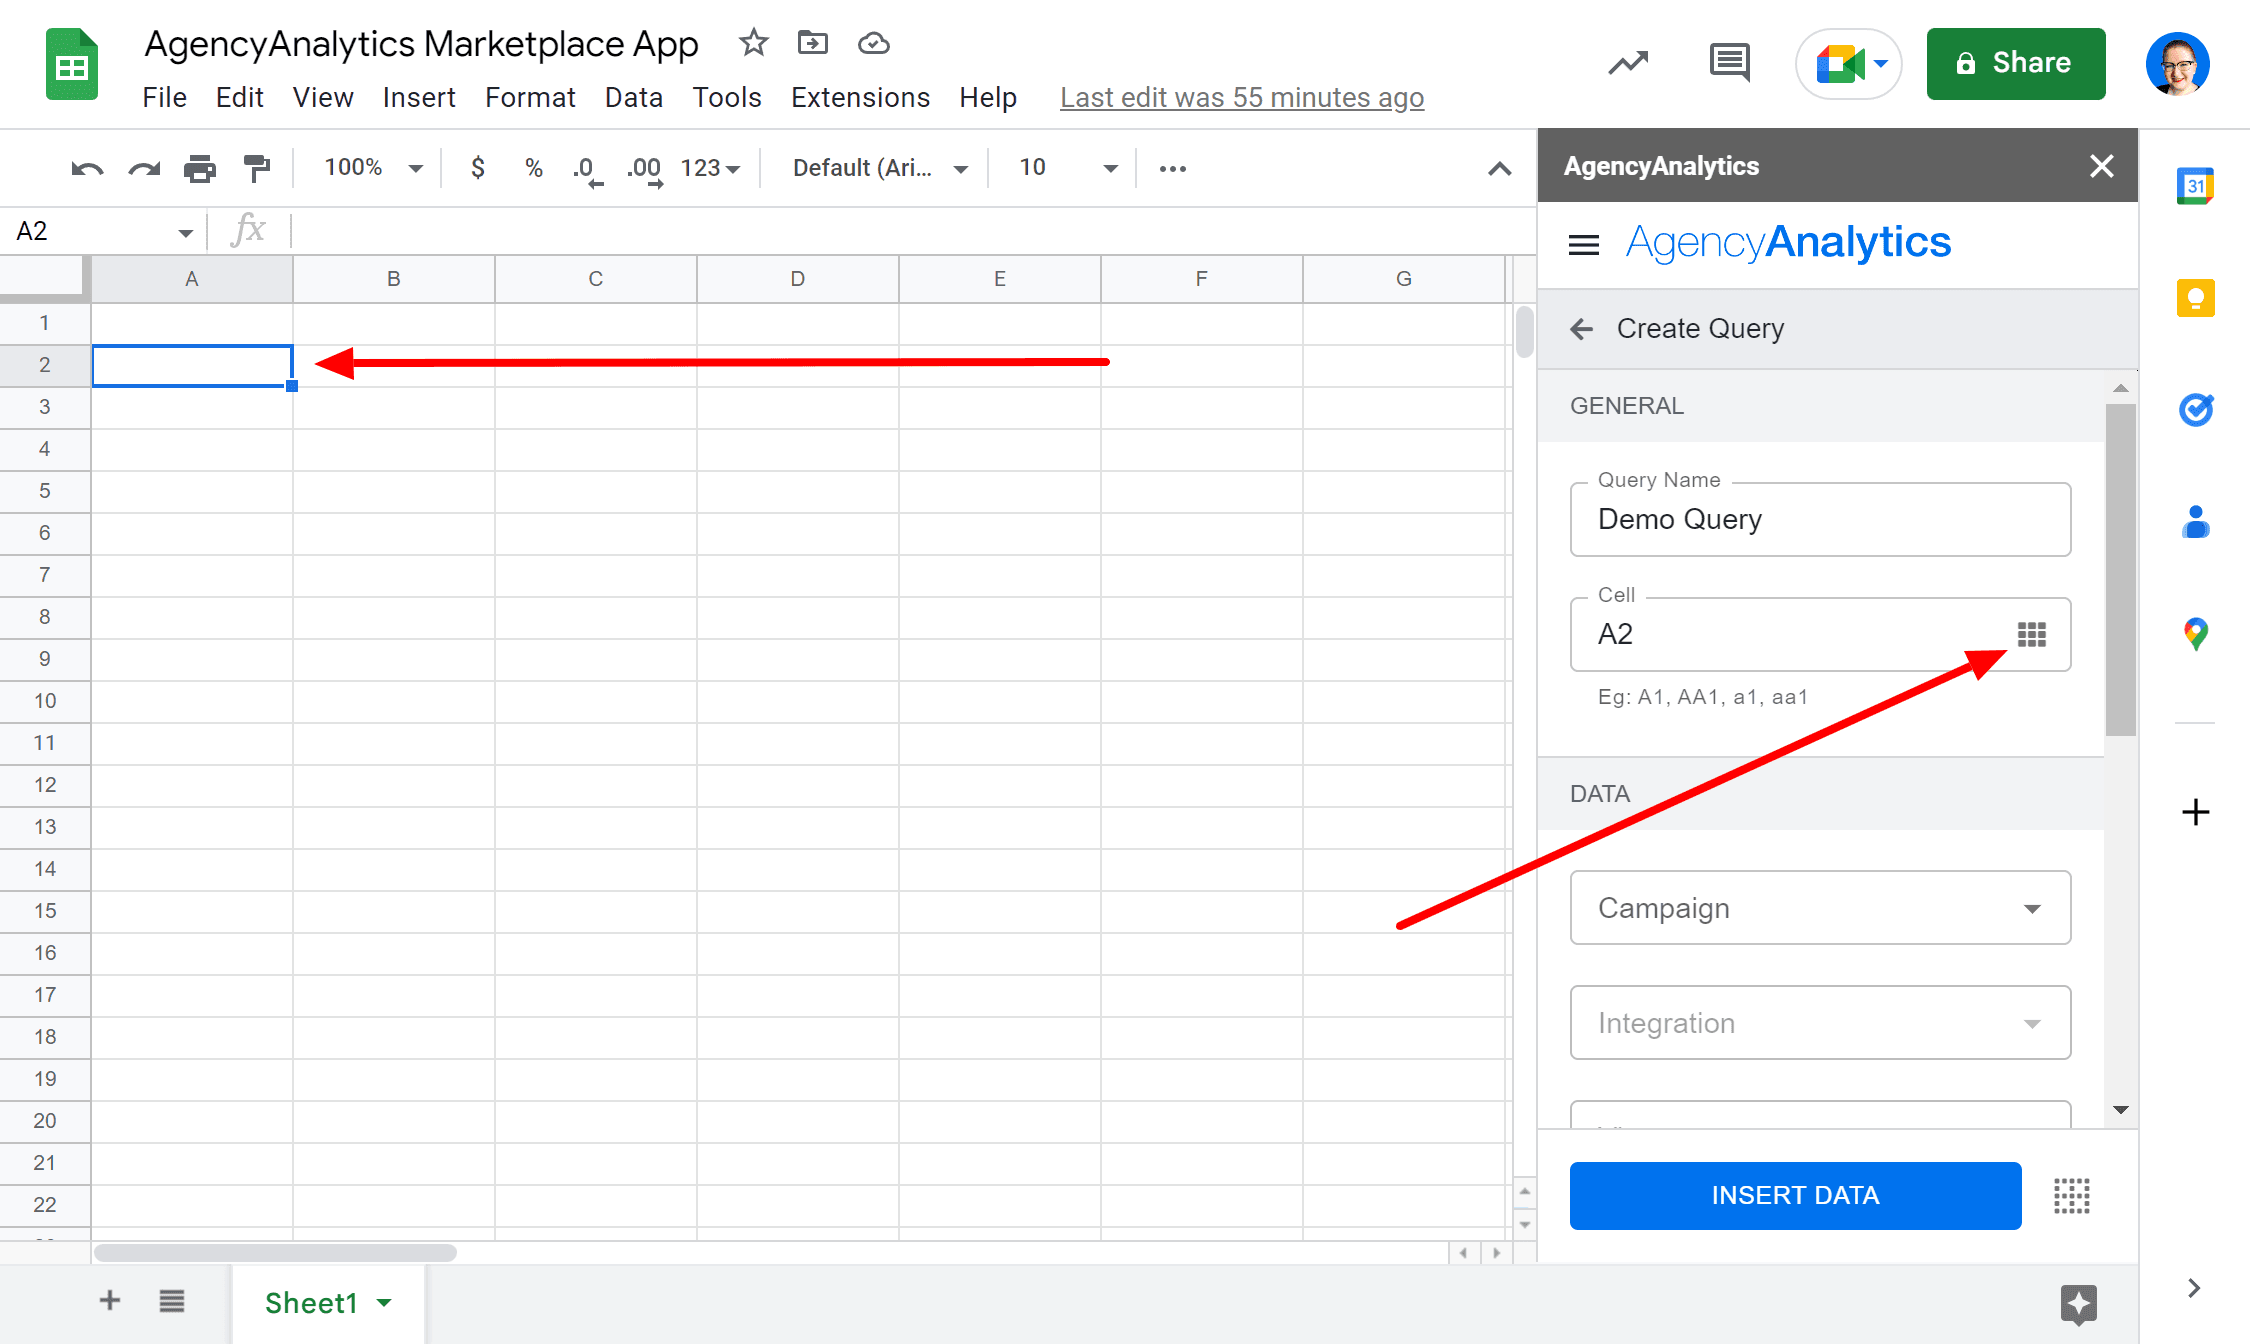
Step 4: Build Your Query Parameters
Give your query a name—something that will tip you and your team members off to the kind of data you’re importing in the query (ex. Facebook Ads - CTR and Cost Per Page Like)
Choose the exact cell you’d like your data import to load into
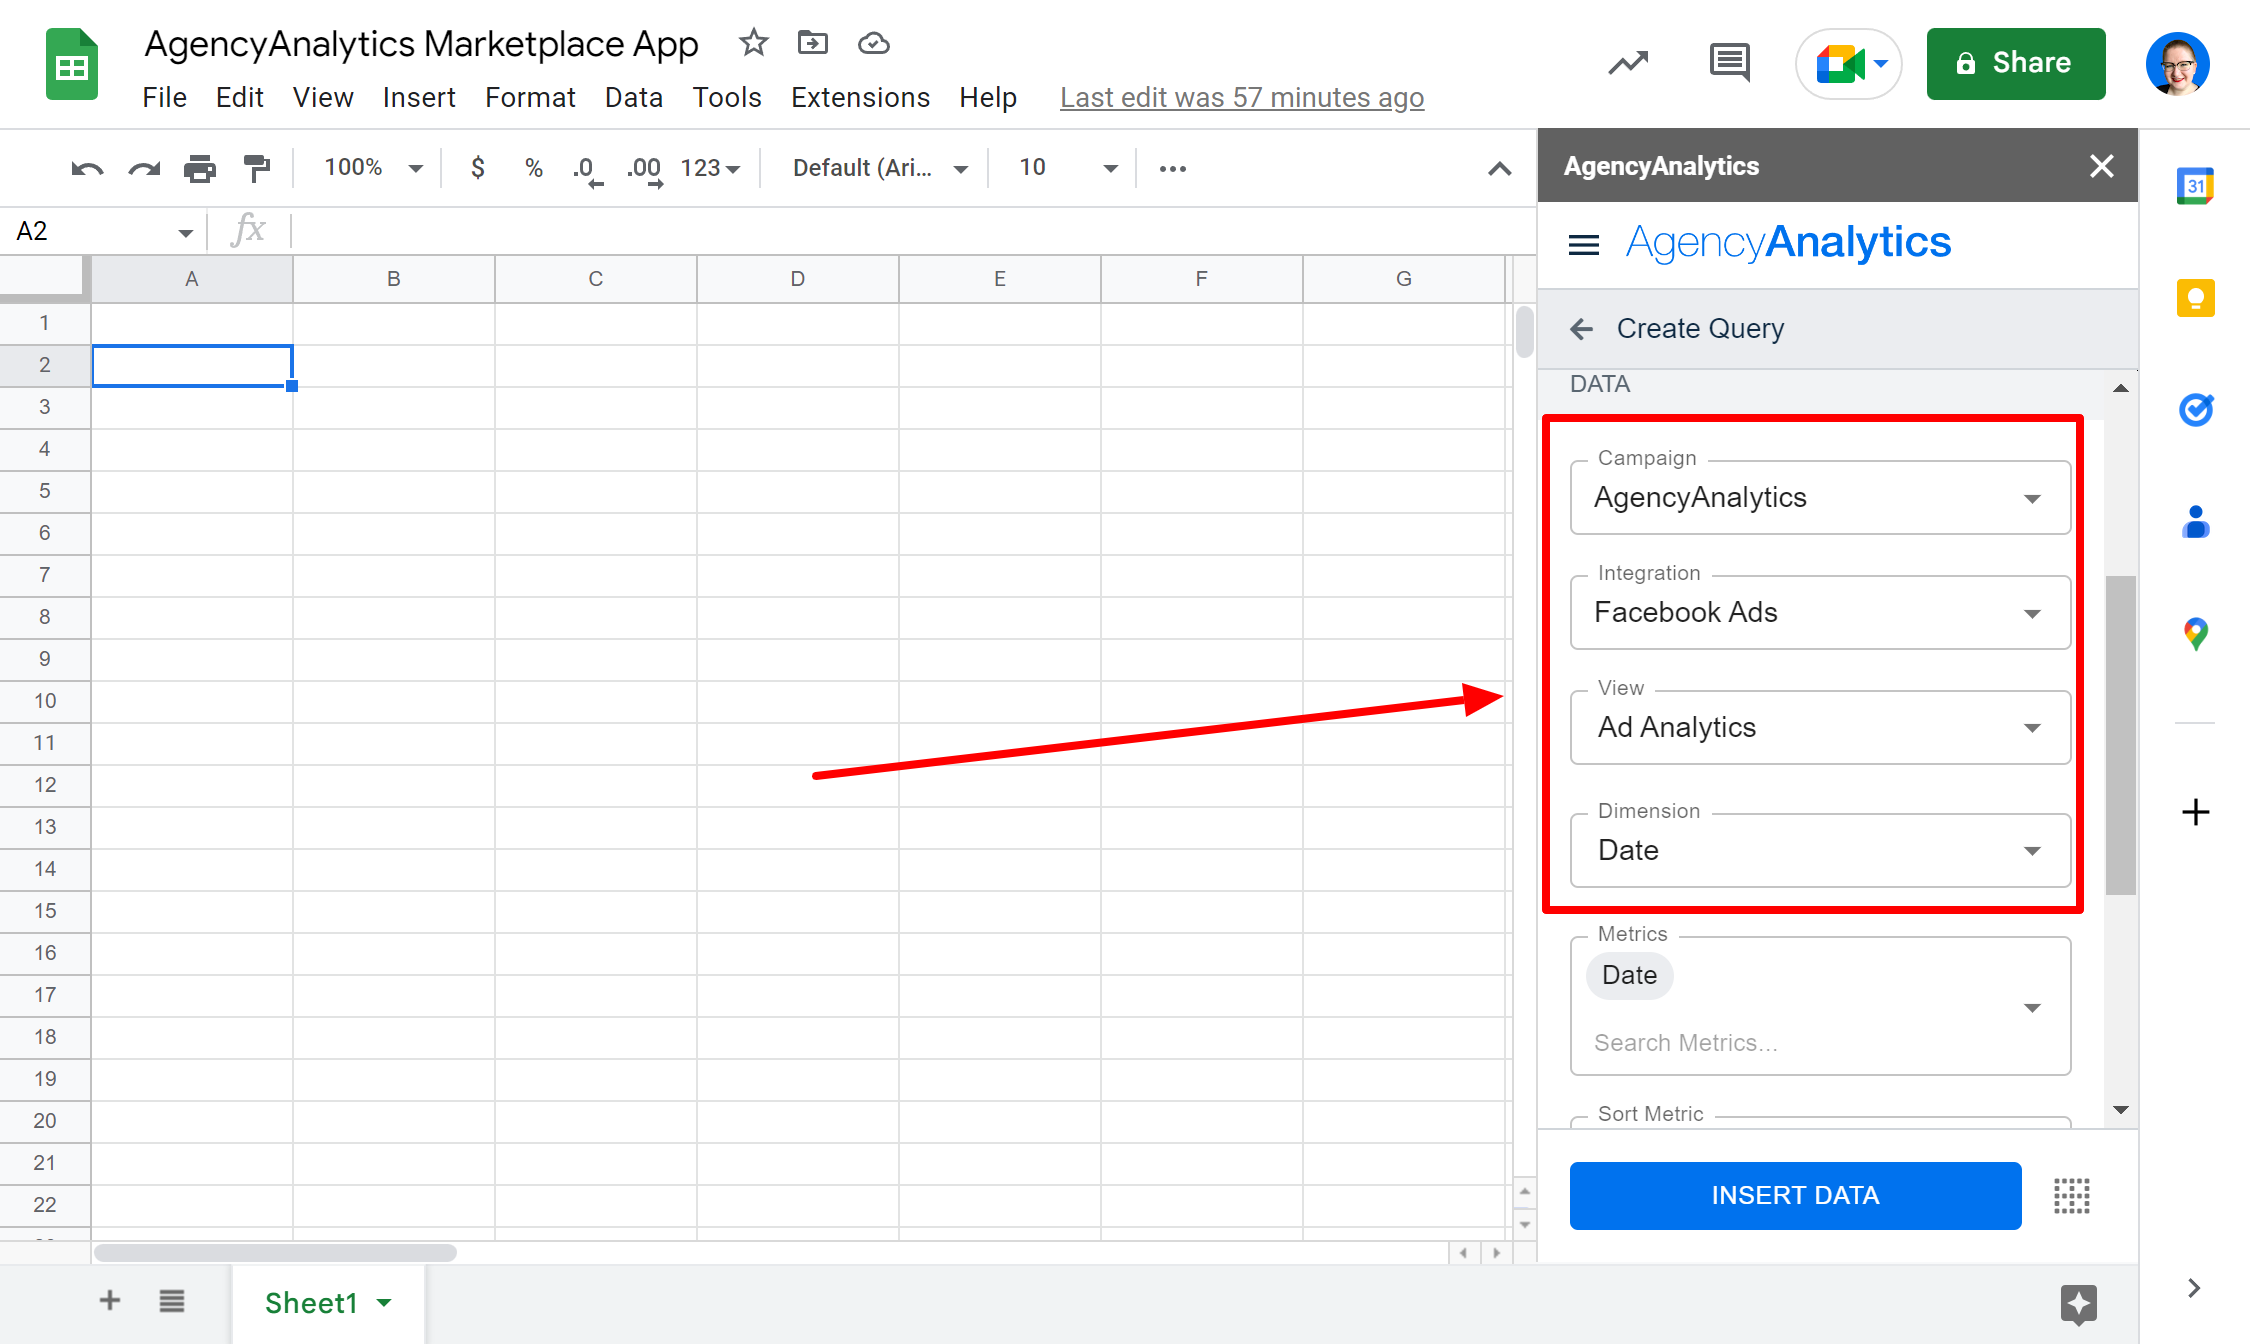
Choose which of your client campaigns and integrations you’d like to import data from
Select the View and Dimensions to split your data by
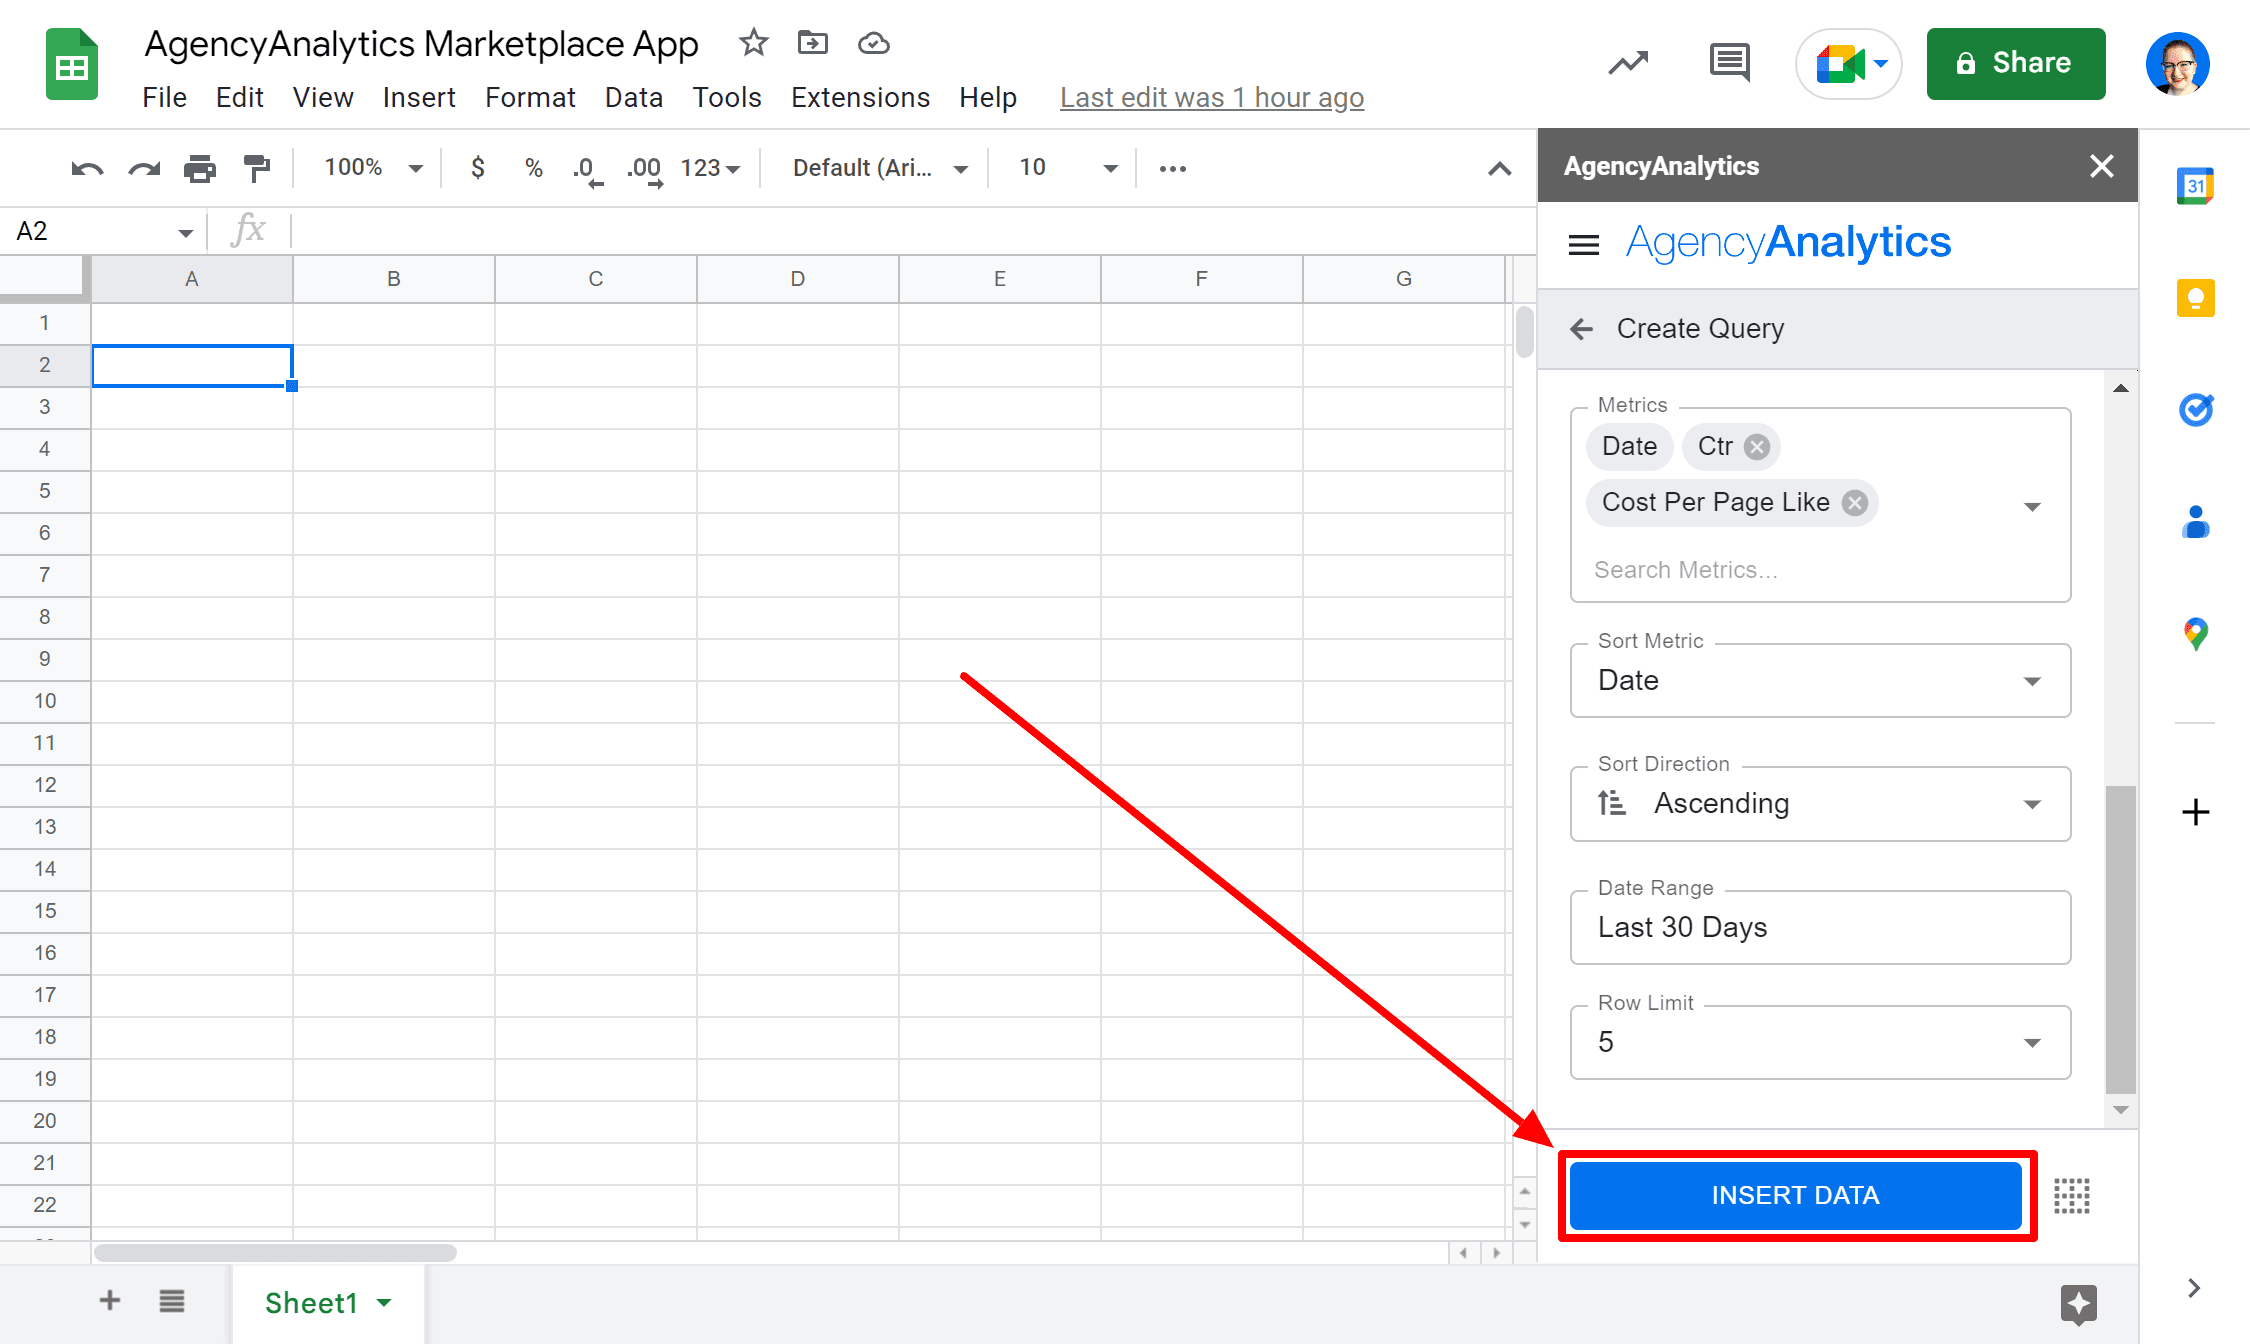
Select the metrics you’d like to include, how you’d like to sort it, and which direction you’d like it to flow—ascending or descending
Choose the date range of data you’re interested in seeing and how many rows of data you’d like to include
Step 5: Insert Your Data
Click to INSERT DATA. Ta-da!
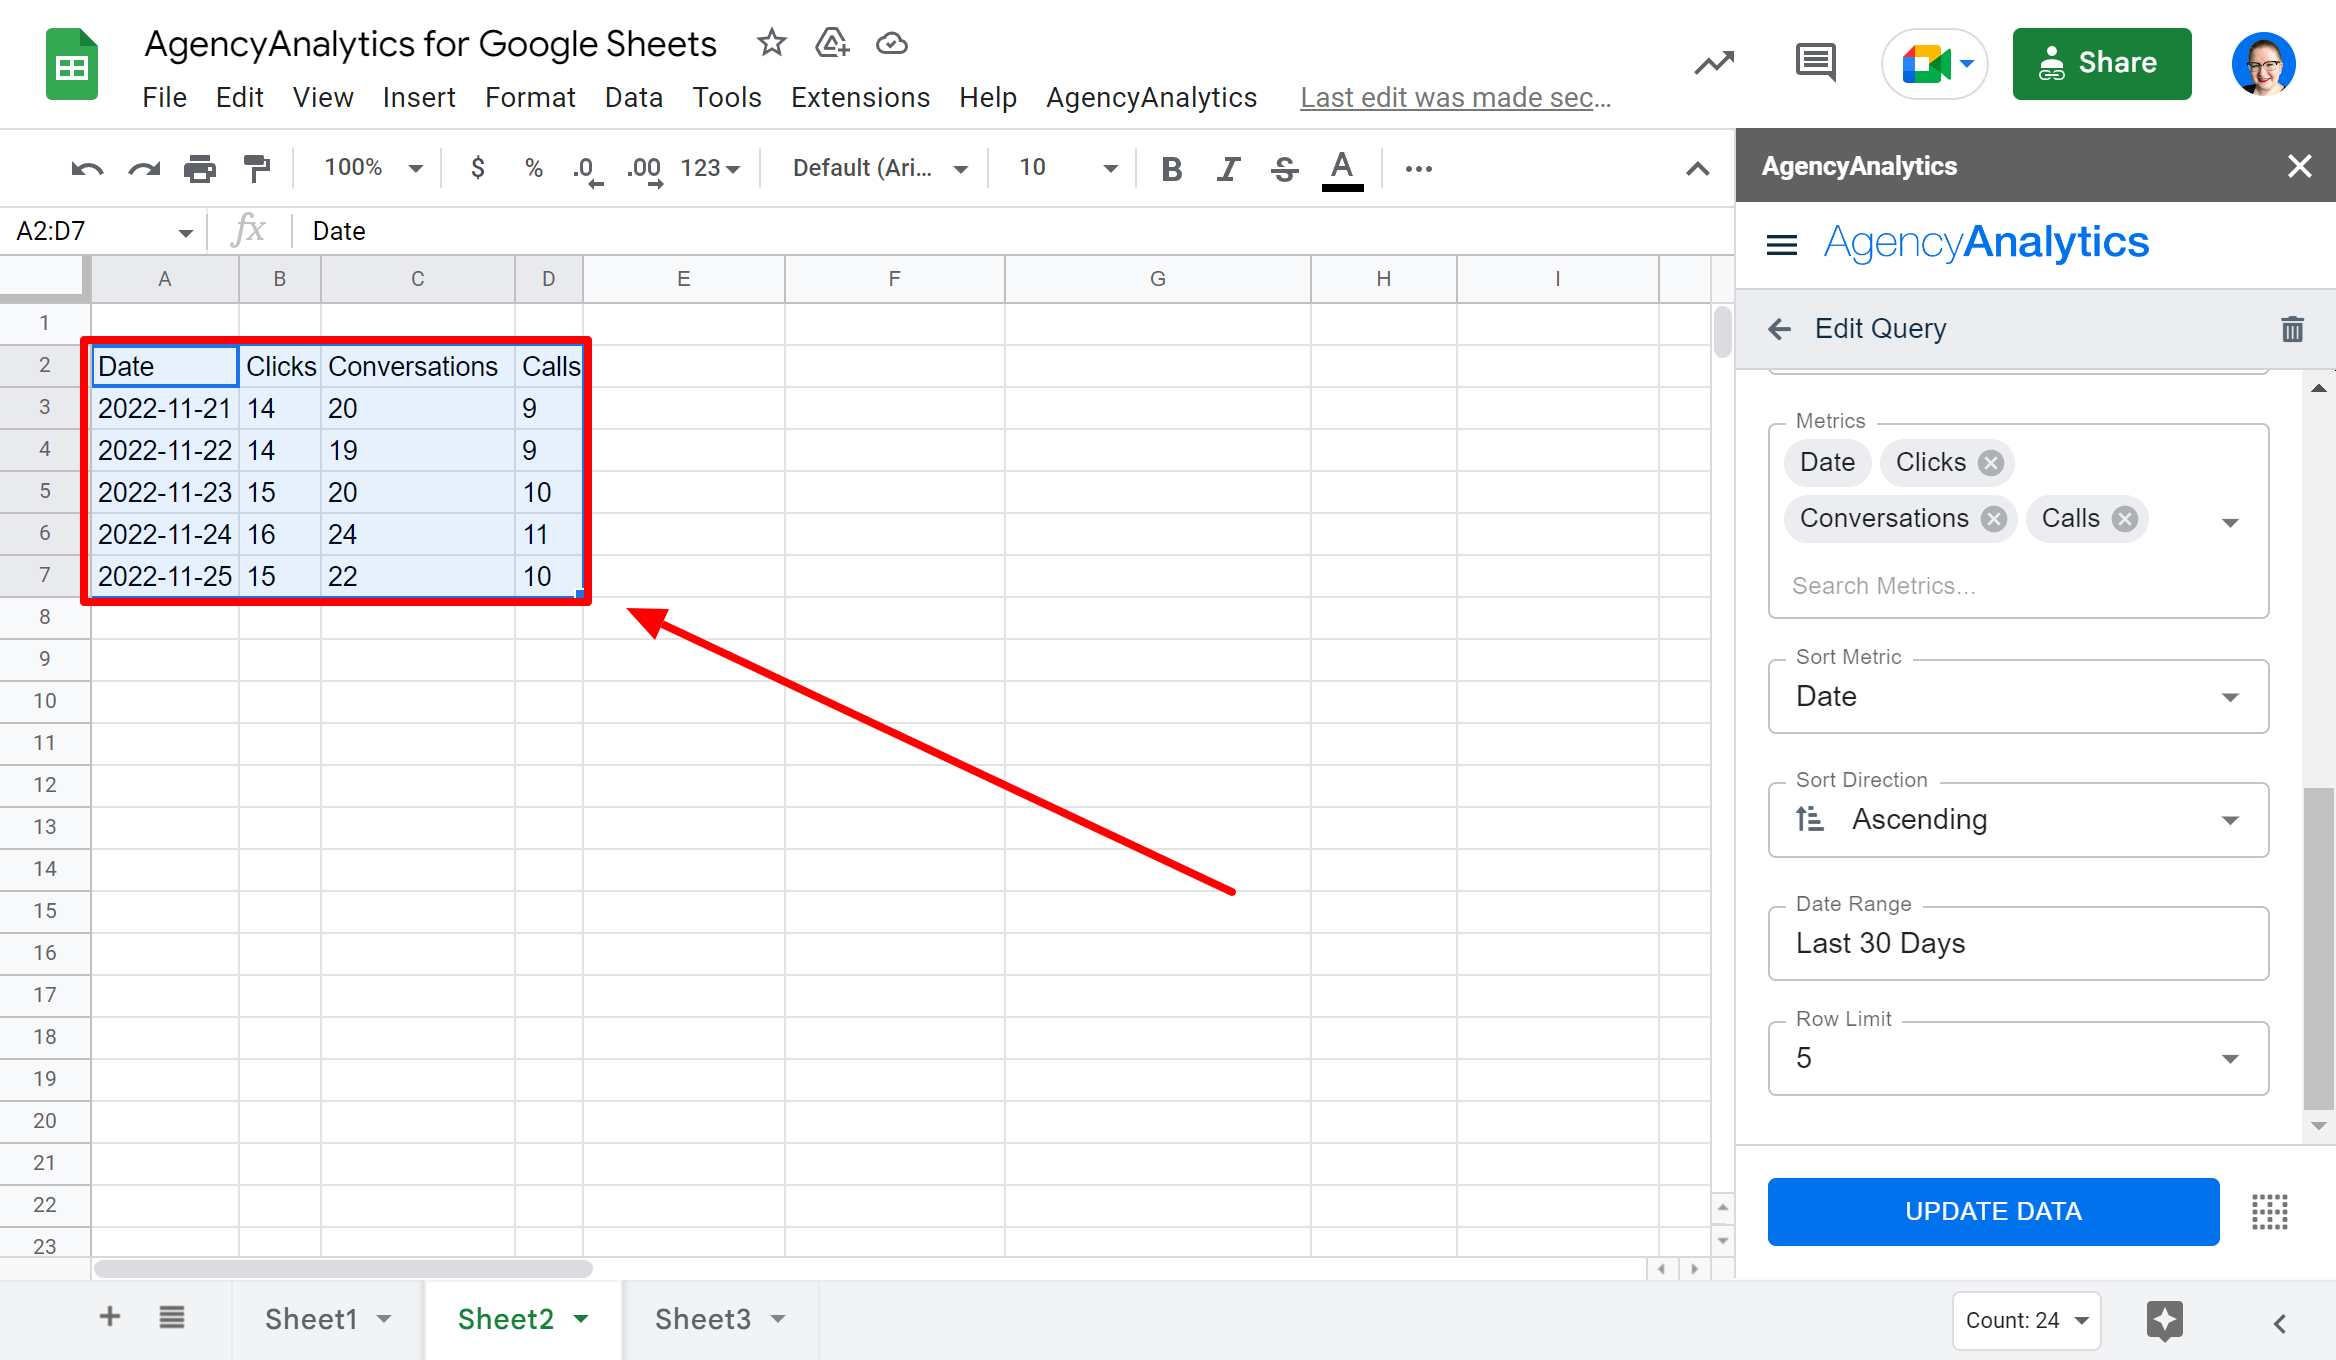
The specific marketing data you've filtered for will populate into your Google sheet just as requested, and you’ll now see that new query listed in your AgencyAnalytics sidebar.
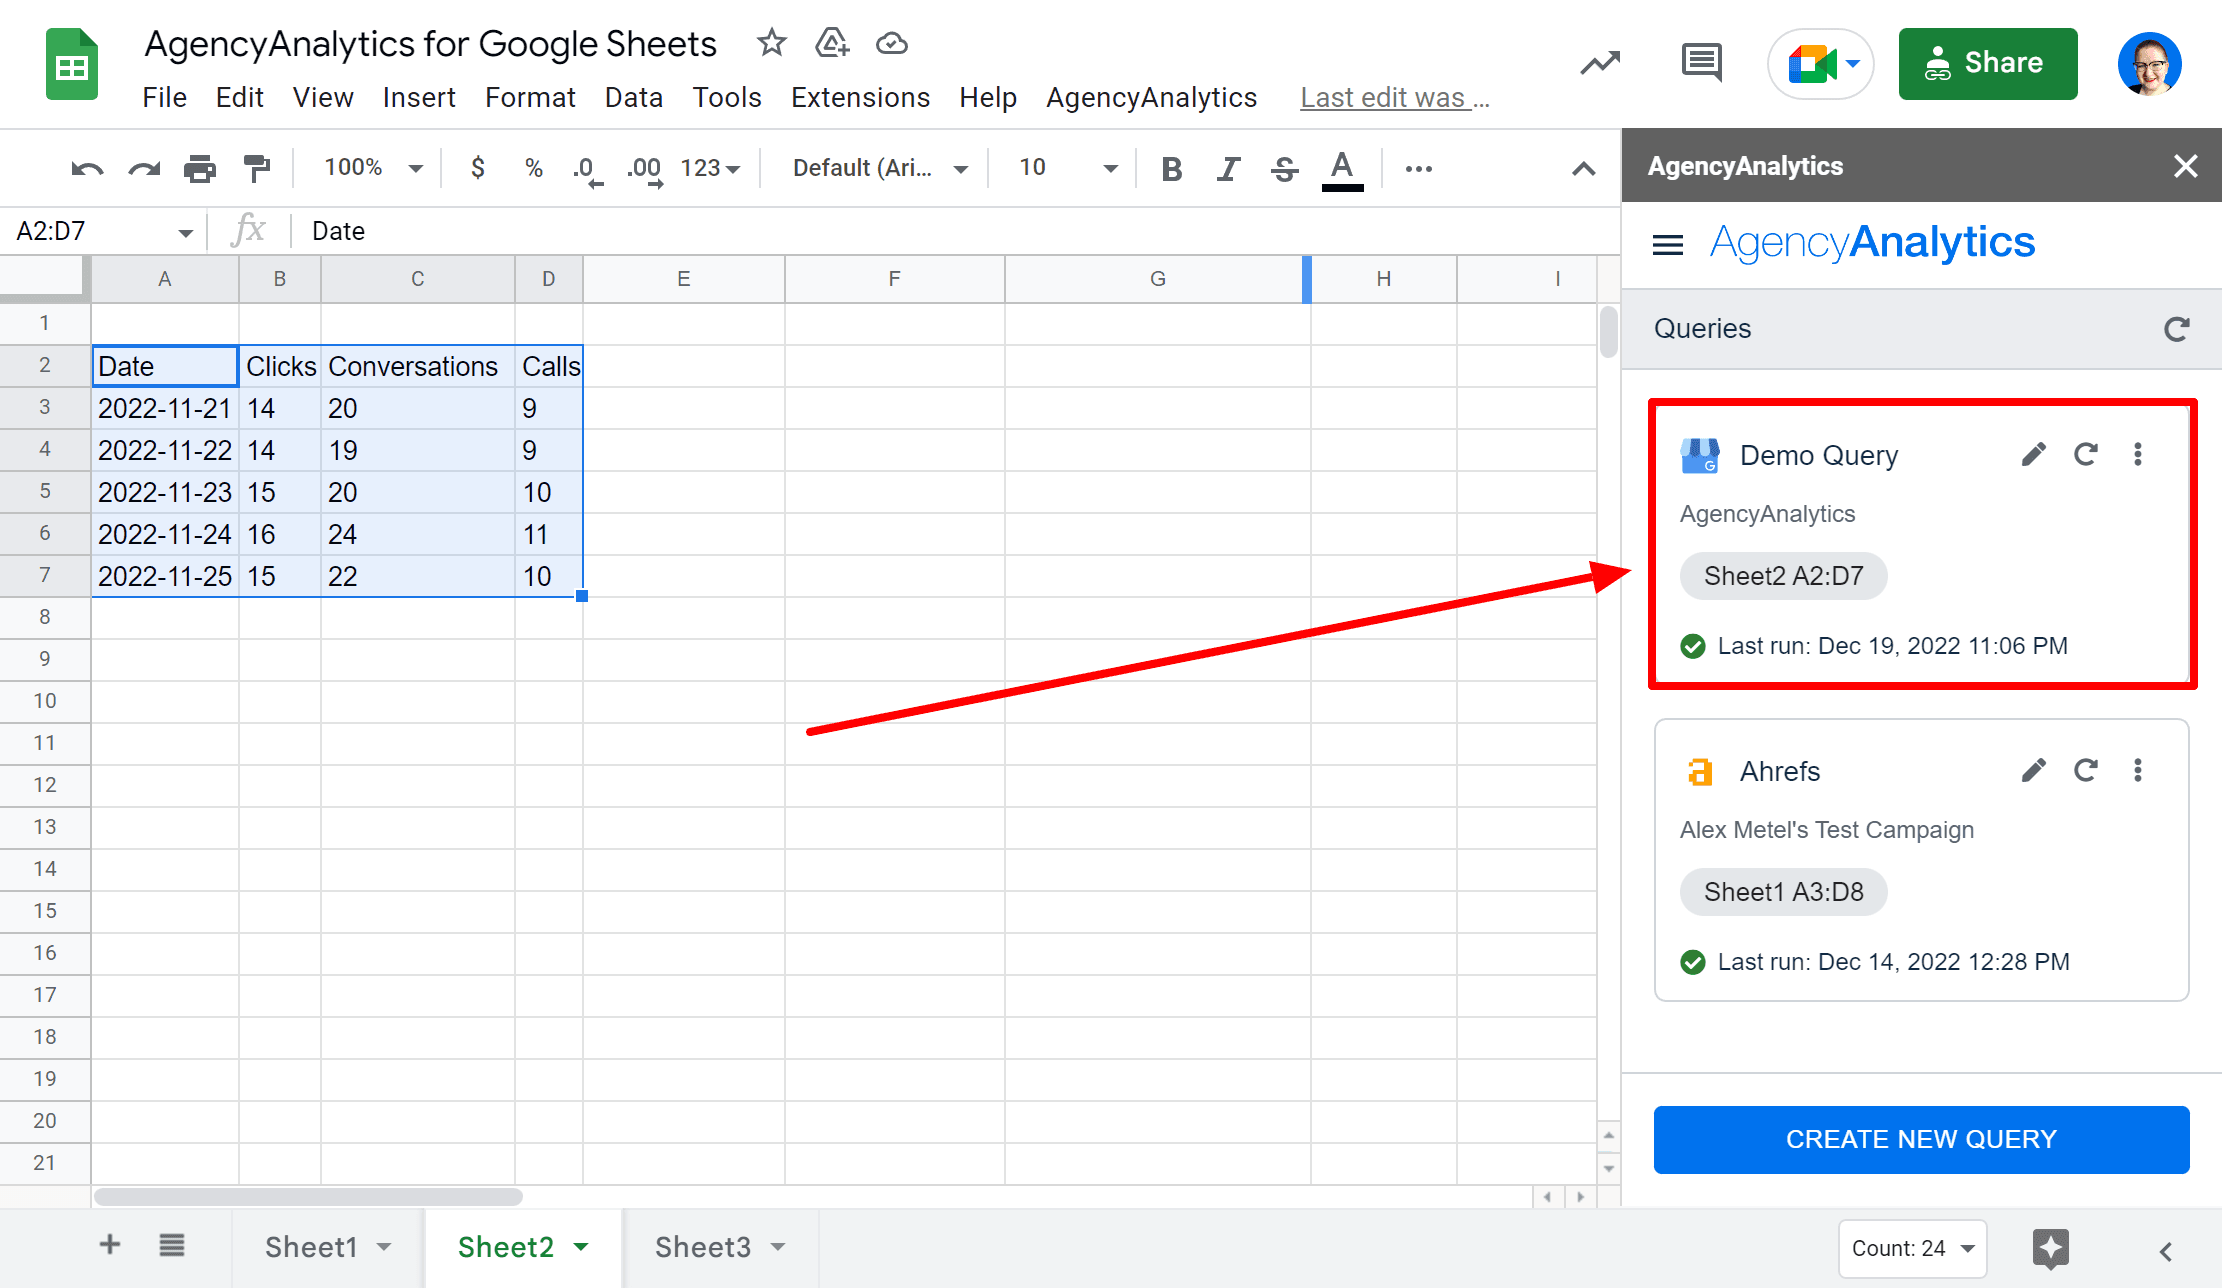
That’s it!
Create as many queries as you like, share them amongst team members using the same AgencyAnalytics account, and use the full power of Google Sheets to start combining, transforming, and performing any sort of data tracking and manipulation you can imagine.
When you need the latest data, simply hit the refresh button! And adjusting the date range on queries enables you to look at the same data from a different time period with just a few clicks.
How To Quickly and Easily Export Data from Google Sheets into AgencyAnalytics
In order to connect your AgencyAnalytics account with Google Sheets, the first step is to click on “Integrations” in the sidebar and search for Google Sheets:
From there, you’ll be prompted to “Connect New Account” and then directed to login to the relevant Google Drive account:
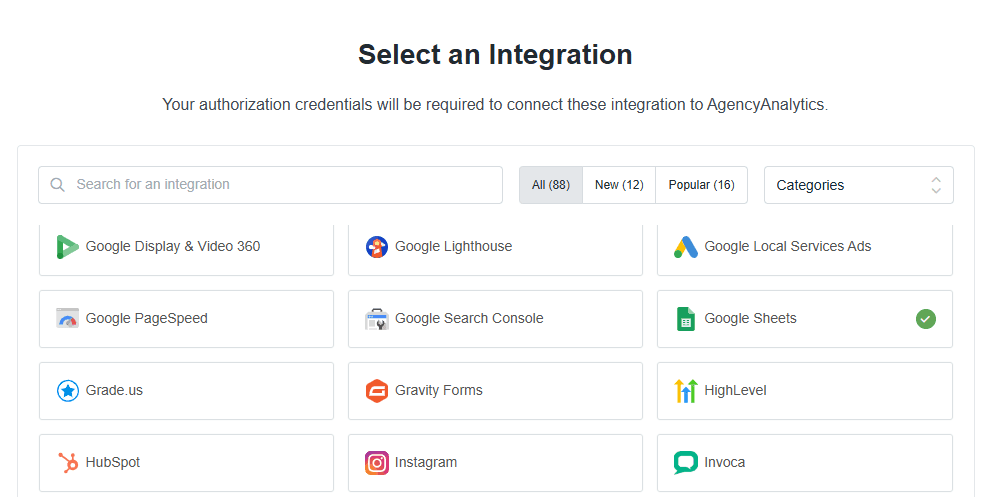
After integrating the Google Sheets account, you can then navigate back to “Dashboards” and start adding the data to various widget types.
Google Sheets Widget Types
Now that we have integrated Google Sheets, we’ll review how to use this data with our main widget types. In order to add each of these widget types, you can simply click “Edit Dashboard” and then “Add Widget”:
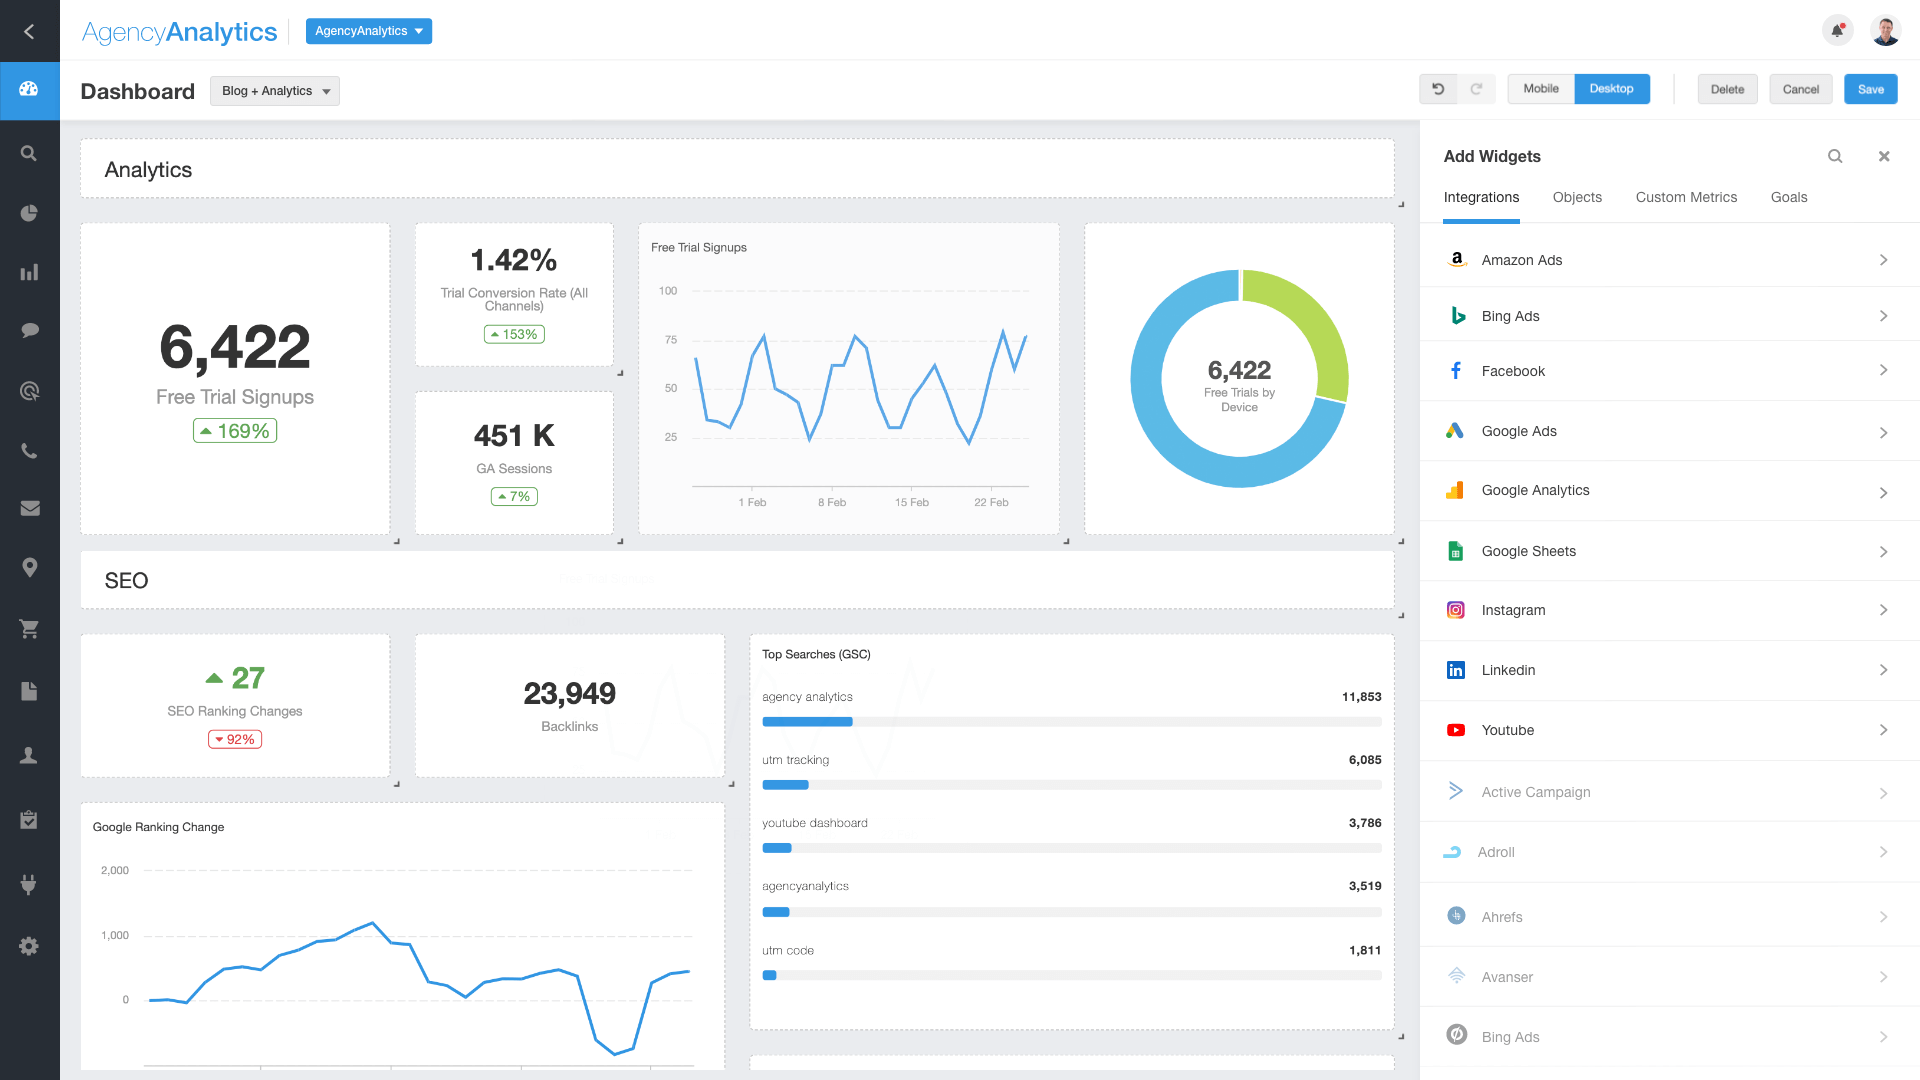
All of the Google Sheets widgets can then be found under the “Misc” widget section:
After you choose a widget type, you’ll be prompted to select a Sheet to populate it with.
Table Widgets
This will display an entire Sheets tab in a table format, which can be useful to display goals, tasks, traffic, sales, or any other tabular data.

If you want to change the tab used, you can click on “Edit Widget” and then select from the “Spreadsheet Tab”
Stat widgets
Stat widgets are the simplest widget option available and can be used to output the content of a specific cell, for example for showing totals, averages, and so on.

To do so, we can simply add a new stat widget and then choose the cell in the settings.
Line charts
Line charts are useful if you want to visualize how data changes over time. To do so, we’ll need to edit the widget settings and indicate which column contains the date and which column to plot.
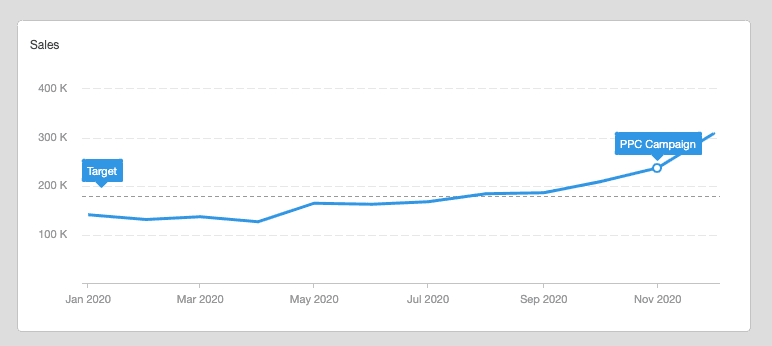
Another core feature of line charts is the ability to add annotations and goal thresholds, for example below we’ve added a “PPC Campaign” annotation on a specific date and a target sales threshold.
Sparkline Widgets
Sparkline widgets are very similar to line charts in functionality, the only difference is that it will add a total of all the values in a stat widget above the plotted line.

It’s important to note that the statline widget will only display data from the date range selected in the top right of the dashboard, as opposed to all the data in the Sheet.
Pie charts
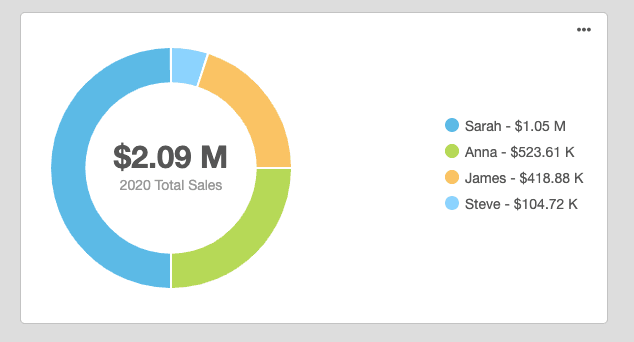
Pie charts are valuable if you want to display a breakdown of numeric values associated with metrics, categories, people, and so on. For example, in the pie chart below we have a breakdown of sales by person.
Bar Charts
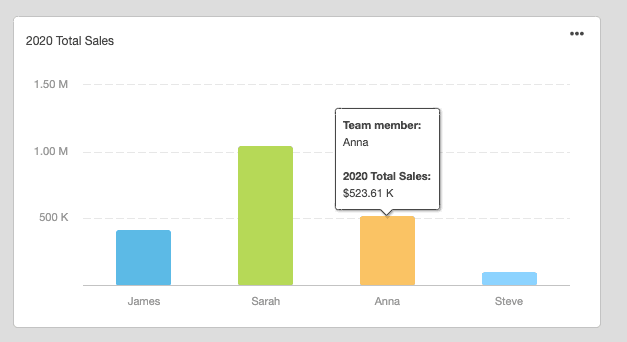
Bar charts work largely the same way as pie charts and are useful for a breakdown of data across several categories.
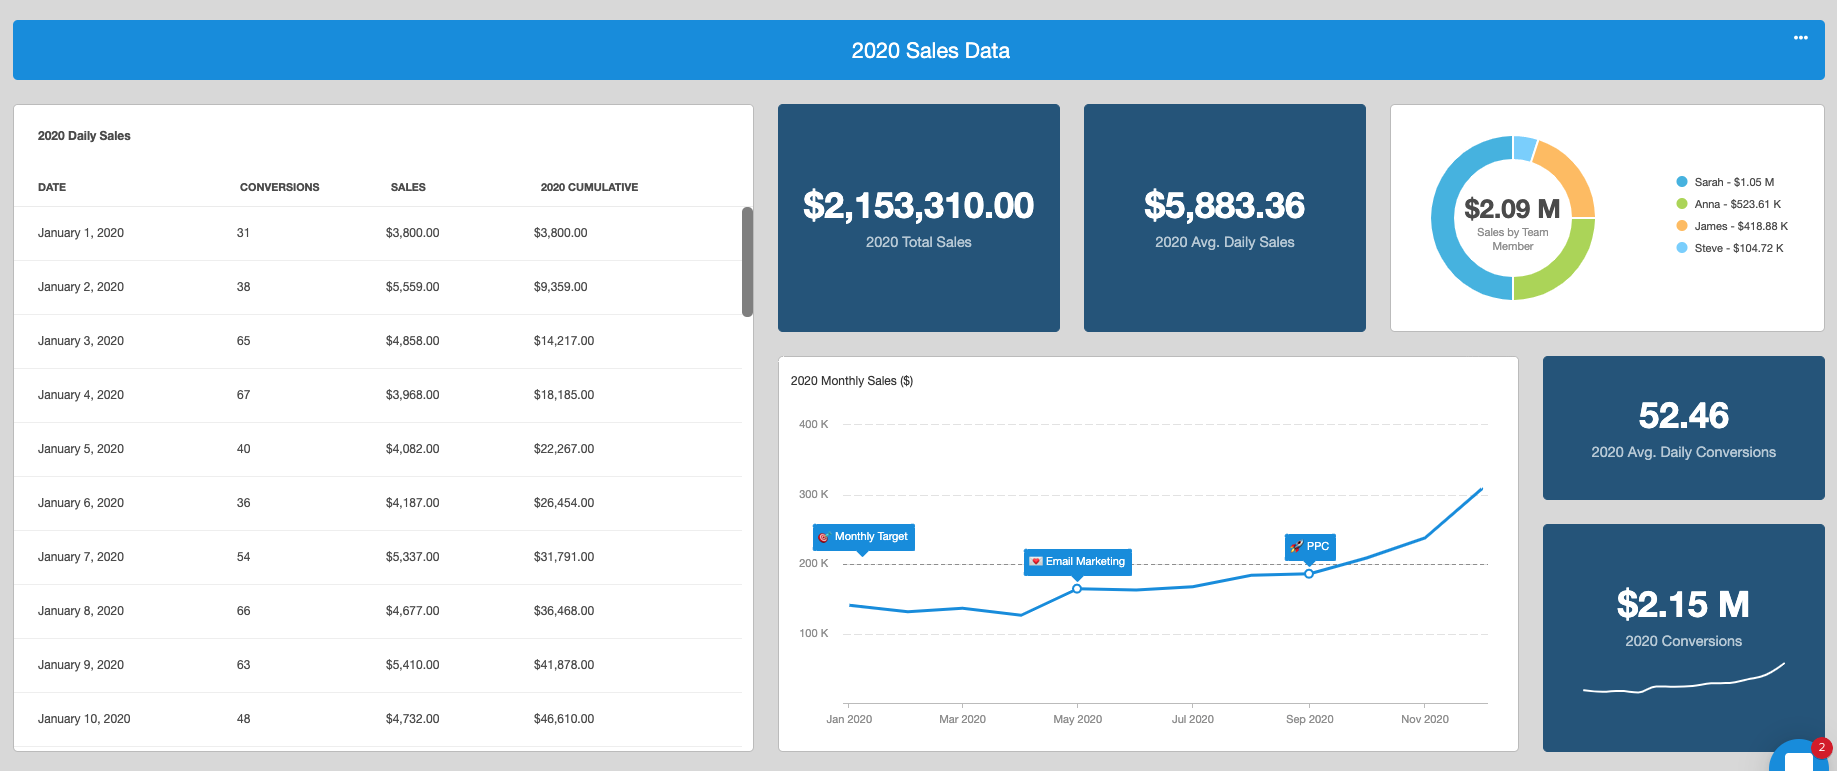
Below you can see an example of a complete dashboard that has been branded and formatted entirely with data from Google Sheets:
Embedding Google Sheets in an Existing Marketing Dashboard
A final use case of Google Sheets is the ability to embed and edit the Sheet from right inside the dashboard.
In order to embed a Sheet in a dashboard, all you need to do is click on “Share” from within the sheet and copy the link. Once the link is copied, you can click on add a new widget and you’ll find the “Embed” option within the “Misc” section.
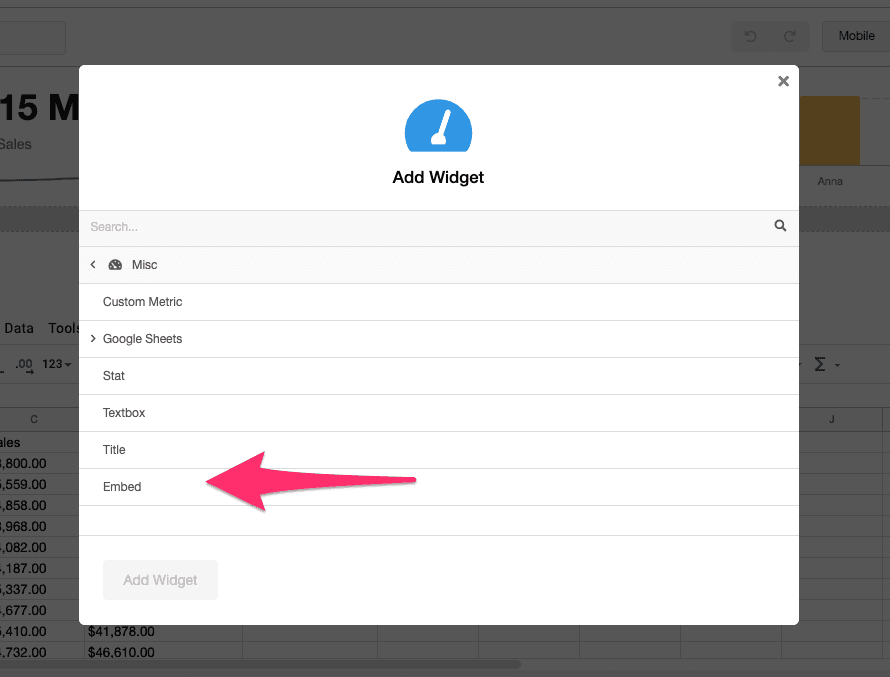
The embed section allows you to embed any URL that’s publicly visible online.
Benefits of the AgencyAnalytics for Google Sheets Import and Export Integrations
Using a data automation tool like the AgencyAnalytics for Google Sheets app brings a whole list of benefits to your marketing agency—and your clients, too!
Seamlessly import precise metrics and dimensions, including some that aren’t available on native platforms. And with over 80 platform integrations—including Google Analytics (and yes, AgencyAnalytics is GA4 compatible), Facebook Ads, Google Ads, Google Business Profile, Google Search Console, and more—pull data from all of the tools your team uses into a single Google Sheets tab or across multiple tabs. This means unparalleled depth of data analysis—and done in a very organized format.
Clean, unsampled data, which is super important for accurate analysis and reporting. Your team needs to make data-driven decisions with confidence, so knowing your insights are based on the most reliable and comprehensive info out there is key.
Combine, transform, and improve your data with loads of customizability to make it work best for your needs. Going beyond the standard metrics from the platforms you and your clients use most takes your marketing insights and reporting deeper than ever before.
Eliminate copy and paste errors, which are common when manually moving a large amount of data from multiple platforms into a single source.
Create and share data queries within your team–because collaboration is a big deal within agencies! This functionality makes your work environment more efficient and productive since everyone quickly gets their hands on the client data they need to get stuff done. So long as team members have access to the same sheet and are using the same AgencyAnalytics account, queries are accessible to all.
Quick data refresh and simple query editing make it super easy to update and tweak your marketing data as needed, so you're always working with the latest and greatest info. What's more, AgencyAnalytics offers…
Unlimited data queries and flexible data date ranges, so you have the freedom to explore and analyze the data as much as you need.
Pull your marketing data back into your white-labeled reporting platform. Use your imagination to manipulate the data any way you’d like, then seamlessly pull it back into AgencyAnalytics to showcase those custom metrics in your custom dashboards and white-labeled reports. The tight integration with Google Sheets makes your workflow even smoother and helps you share your findings with stakeholders and clients in no time.
No-code routing of data to any other platform. Not only does Google Sheets enable you to import your data easily from your reporting platform, but also it provides simple ways to route data to other external sources as well—without coding. Simply use other Google Sheets extensions and apps to get your data wherever it needs to go.
Need some inspiration for how your agency can use the Google Sheets extension for enhanced reporting?
Keep reading…
Practical Ideas for Customizing and Analyzing Marketing Data
Once your clients’ marketing data has been imported to Google Sheets, there are countless ways for you and your agency team members to work with it and gain some deeper insights.
1. Track Performance Metrics
Tracking your agency’s performance metrics for clients over various time frames in a single glance is a great way to not only keep your team on track toward achieving goals but also to clearly display your agency’s progress for those clients based on data.
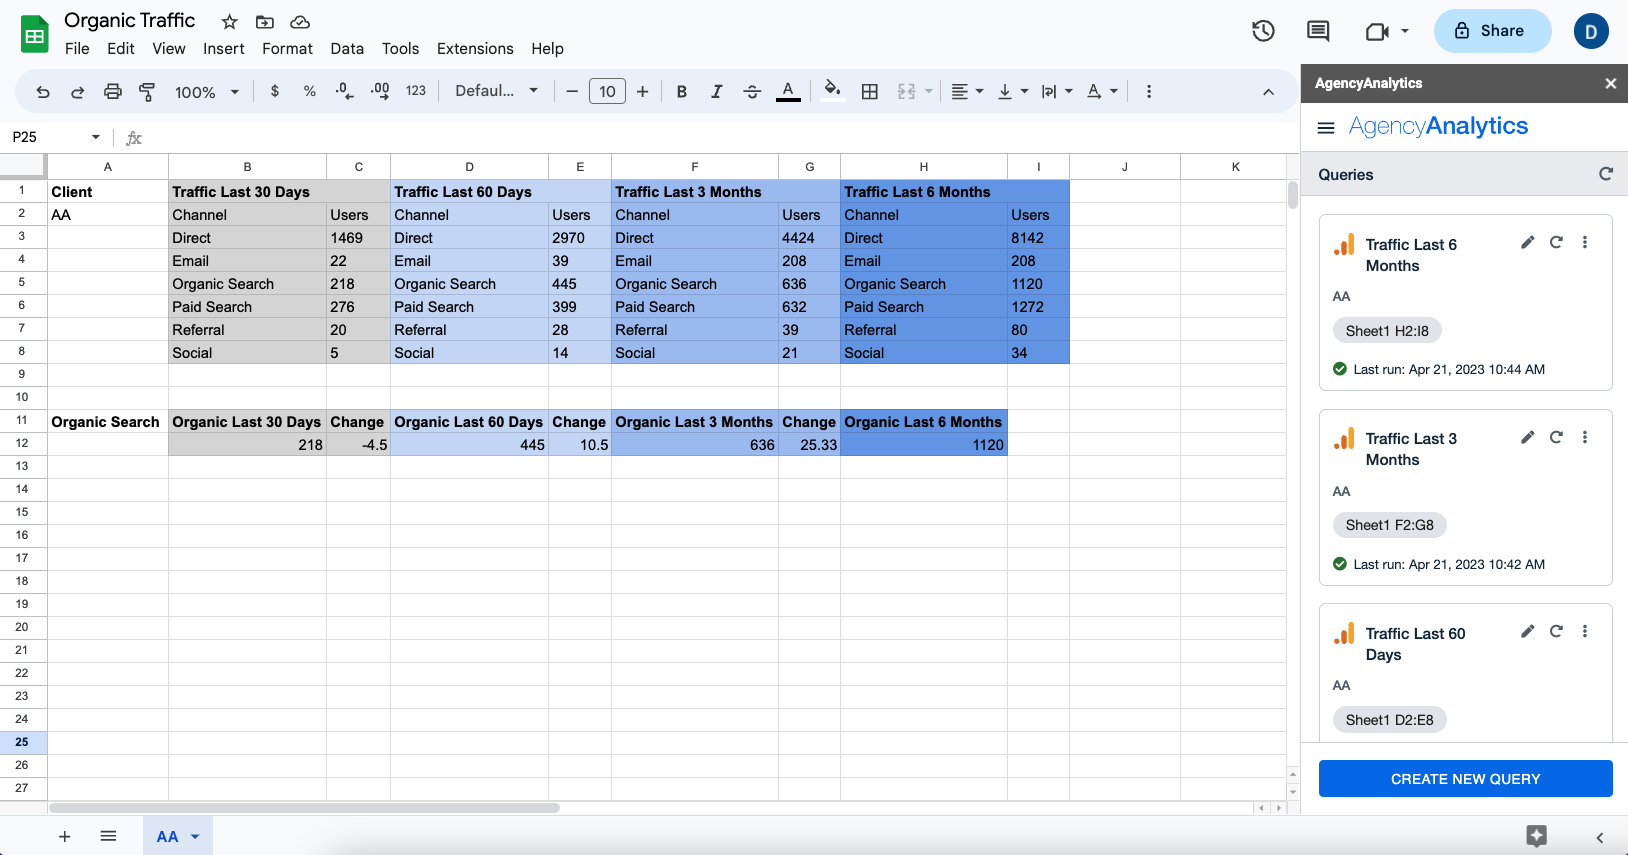
In the example above, we’ve combined Google Analytics 4 metrics for traffic across all channels into a single Google sheet over four time segments: Last 30 days, last 60 days, last 3 months, and last 6 months. We’ve also broken out organic traffic over these time segments and shown the change, giving a clear indication of performance over time.
Adding a new tab for each client takes this a step further. See which clients are your best performers and which are your worst to quickly identify which clients you may want to update on stellar performance—and which may need some extra attention.
2. Combine Data from Multiple Integrations
Combining and analyzing data from multiple integrations is a great way to see how your agency’s performance in one area of marketing impacted performance in another. Let’s examine the example from the beginning of this post.
Perhaps your agency ran a week-long campaign for a client with ads placed on multiple platforms. Using AgencyAnalytics for Google Sheets, you can:
Import data for the number of impressions your client saw per day on both Facebook Ads and Google Ads for the duration of the campaign—as well as before and after the campaign for comparison
Import CallRail data for the number of first calls received over the same time period
Import key Salesforce data to display the number of new customers won over the same time period
Combining data in this way gives your agency insight into which paid platform garnered the most impressions throughout a campaign. You can also examine how call numbers were impacted as a result. And finally, compare how the number of impressions and first calls on a day-to-day basis impacted customers won before, during, and after the campaign.
Performing deeper data analysis across multiple integrations and date ranges creates a ton of opportunities for enhanced reporting and marketing insights.
3. Combining In-house Data With Data From Your Integrations
Your agency tracks data from numerous sources—some of which may not be integrated with your reporting platform just yet. But there are huge benefits to being able to see all your data in one place.
Using a data automation tool, your agency imports straight from your integrated tools and then adds any additional data you need to help create the full data picture.
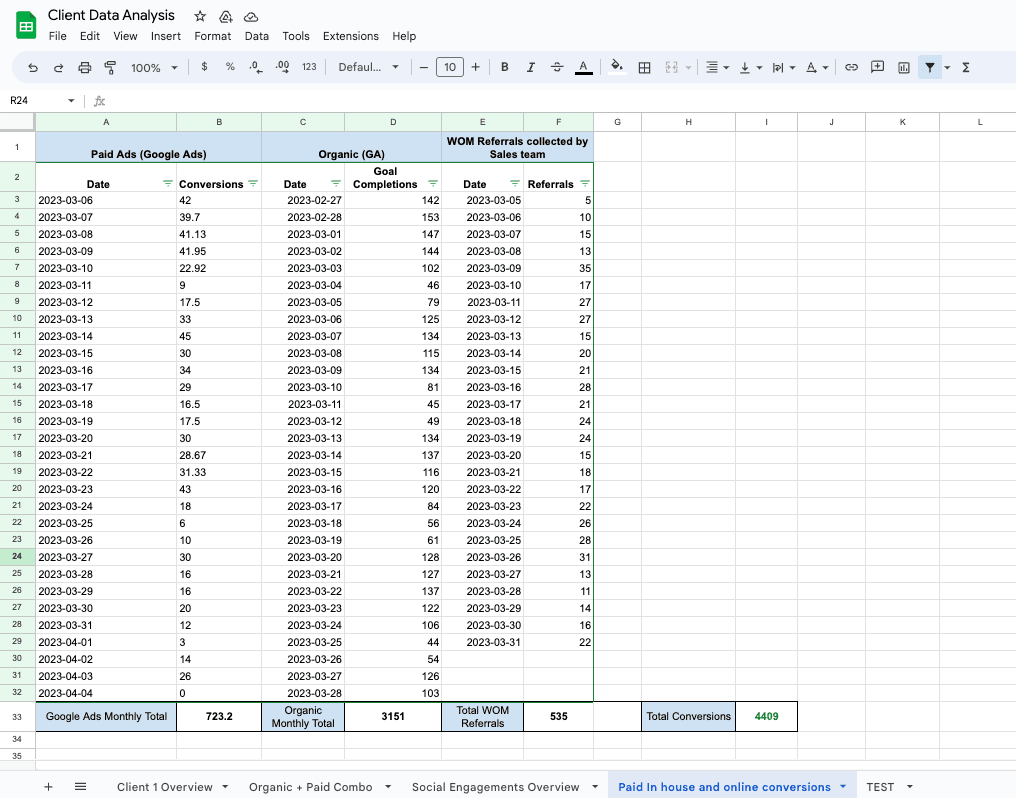
In the example above, we’ve calculated total conversions for a client. This metric was achieved by adding data from paid Google Ads conversions as well as Google Analytics organic goal completions—both connected integrations—as well as word of mouth referrals collected from the sales team—data which was imported to the sheet from a CRM.
4. Route Manipulated Data Back Into Your Reporting Platform
Once you’ve spent some time combining and manipulating data from various sources in a Google Sheet, you might come up with some great new data and insights you’d love to share with your client.
AgencyAnalytics also integrates with Google Sheets, which means agencies can automatically pull their customized data from that platform back into AgencyAnalytics and display it on their dashboards and reports.
All you need to do is select Google Sheets from your integrations and choose the type of chart or graph you’d like to display your data with.

The example above shows three different ways we’ve pulled and displayed data from Google Sheets back into AgencyAnalytics.
The first at the top shows organic and paid clicks, along with total engagement across all social platforms, as well as total conversions—including word-of-mouth referrals. Being able to pull all this data together and show it across various time frames provides a great overview to clients.
The second example, on the bottom left, shows individual and combined social engagement across all social platforms in a visually attractive pie chart.
And the final example, on the bottom right, visualizes clicks and goal completions across various paid and organic platforms. This chart was added using the object embed widget. Use this to add any custom-created chart from Google Sheets or elsewhere.
Sometimes being able to visualize information makes all the difference. Easily turn your raw data into intuitive charts and graphs to help paint a clear picture your clients will understand.
5. Back Up Your Data
Last but certainly not least, it’s good to remember that some platforms only store data for a certain number of months or years, after which the data is deleted and lost forever.
Your agency can now automatically pull important client data directly from your AgencyAnalytics platform into Google Sheets. This allows for long-term storage and broader historical comparisons. This is a great asset when you have clients you’ve been working with for years, and you’d like to be able to show long-term growth and consistent performance.
Summary and Key Takeaways
In this article, we covered two ways to import your marketing data into Google Sheets: directly from your clients’ various marking platforms and using a data automation tool like AgencyAnalytics for Google Sheets.
To sum it up, AgencyAnalytics is a game-changer for marketing agencies when it comes to working with data in Google Sheets. With precise metrics, easy data customization, and powerful data manipulation, it's the perfect app for any team looking to step up their data-driven decision-making game—without adding any manual effort. Also, refresh the data you’re working with simply by clicking a button, making an automation tool the clear choice if you’re looking for speed and precision.
For unlimited data manipulation and tracking options as well as an automated and efficient way to manage your transformed marketing data, try adding the AgencyAnalytics for Google Sheets app to your reporting process. This tool is still in beta and is FREE for you and your team to use.
Check out a recent webinar on the AgencyAnalytics for Google Sheets app. Watch a step-by-step walk-through of how to access and set up the app with your AgencyAnalytics account. Also, learn some of the top benefits and use cases so you can start using it and seeing immediate value!
Use AgencyAnalytics for Google Sheets to import or export your marketing data and gain the ability to combine, transform, and improve your data with customizability. Glean deeper insights and more effective client reporting–without the hassle. Start your free 14-day trial today.

Written by
Daniella is a product marketing manager with more than a decade of experience in strategic digital communication and story-telling. She specializes in helping B2B SaaS businesses grow and thrive.
Read more posts by Daniella IngraoSee how 7,000+ marketing agencies help clients win
Free 14-day trial. No credit card required.


