Table of Contents
Table of Contents
- The Art and Science of HubSpot Reports
- Decoding the Customer Journey Report in HubSpot
- Unleashing the Power of HubSpot Attribution Reporting
- Linking Marketing Efforts to Revenue with HubSpot Sales Reporting
- Tailoring HubSpot to Your Clients' Needs with Custom Reports
- Key HubSpot Metrics to Track for Optimization and Reporting
- Creating Automated HubSpot Reports for Clients Using AgencyAnalytics
- Summary and Key Takeaways
7,000+ agencies have ditched manual reports. You can too.
Free 14-Day TrialQUICK SUMMARY:
Marketing agencies interested in HubSpot reporting best practices use the HubSpot tools to understand how client campaigns are doing. These reports help improve strategies, track customer journeys, and show ROI. This article explains key features like customizable dashboards, attribution reporting, and sales metrics, offering a clear overview to improve marketing results.
HubSpot is an all-in-one marketing, sales, and service platform that helps businesses streamline their operations, optimize marketing strategies, and nurture customer relationships through its robust suite of tools, including CRM, email marketing, and content management.
Navigating the expansive landscape of HubSpot reporting might seem daunting, but it's an essential skill for modern marketing agencies. These reports function as an invaluable tool, offering a detailed look into the progress of your clients' marketing campaigns and providing the data necessary to refine strategies effectively.
Consider the customer journey report from HubSpot. This comprehensive resource offers a complete overview of your client's customer interactions. It's a reliable compass, guiding strategy based on user experiences and behaviors.
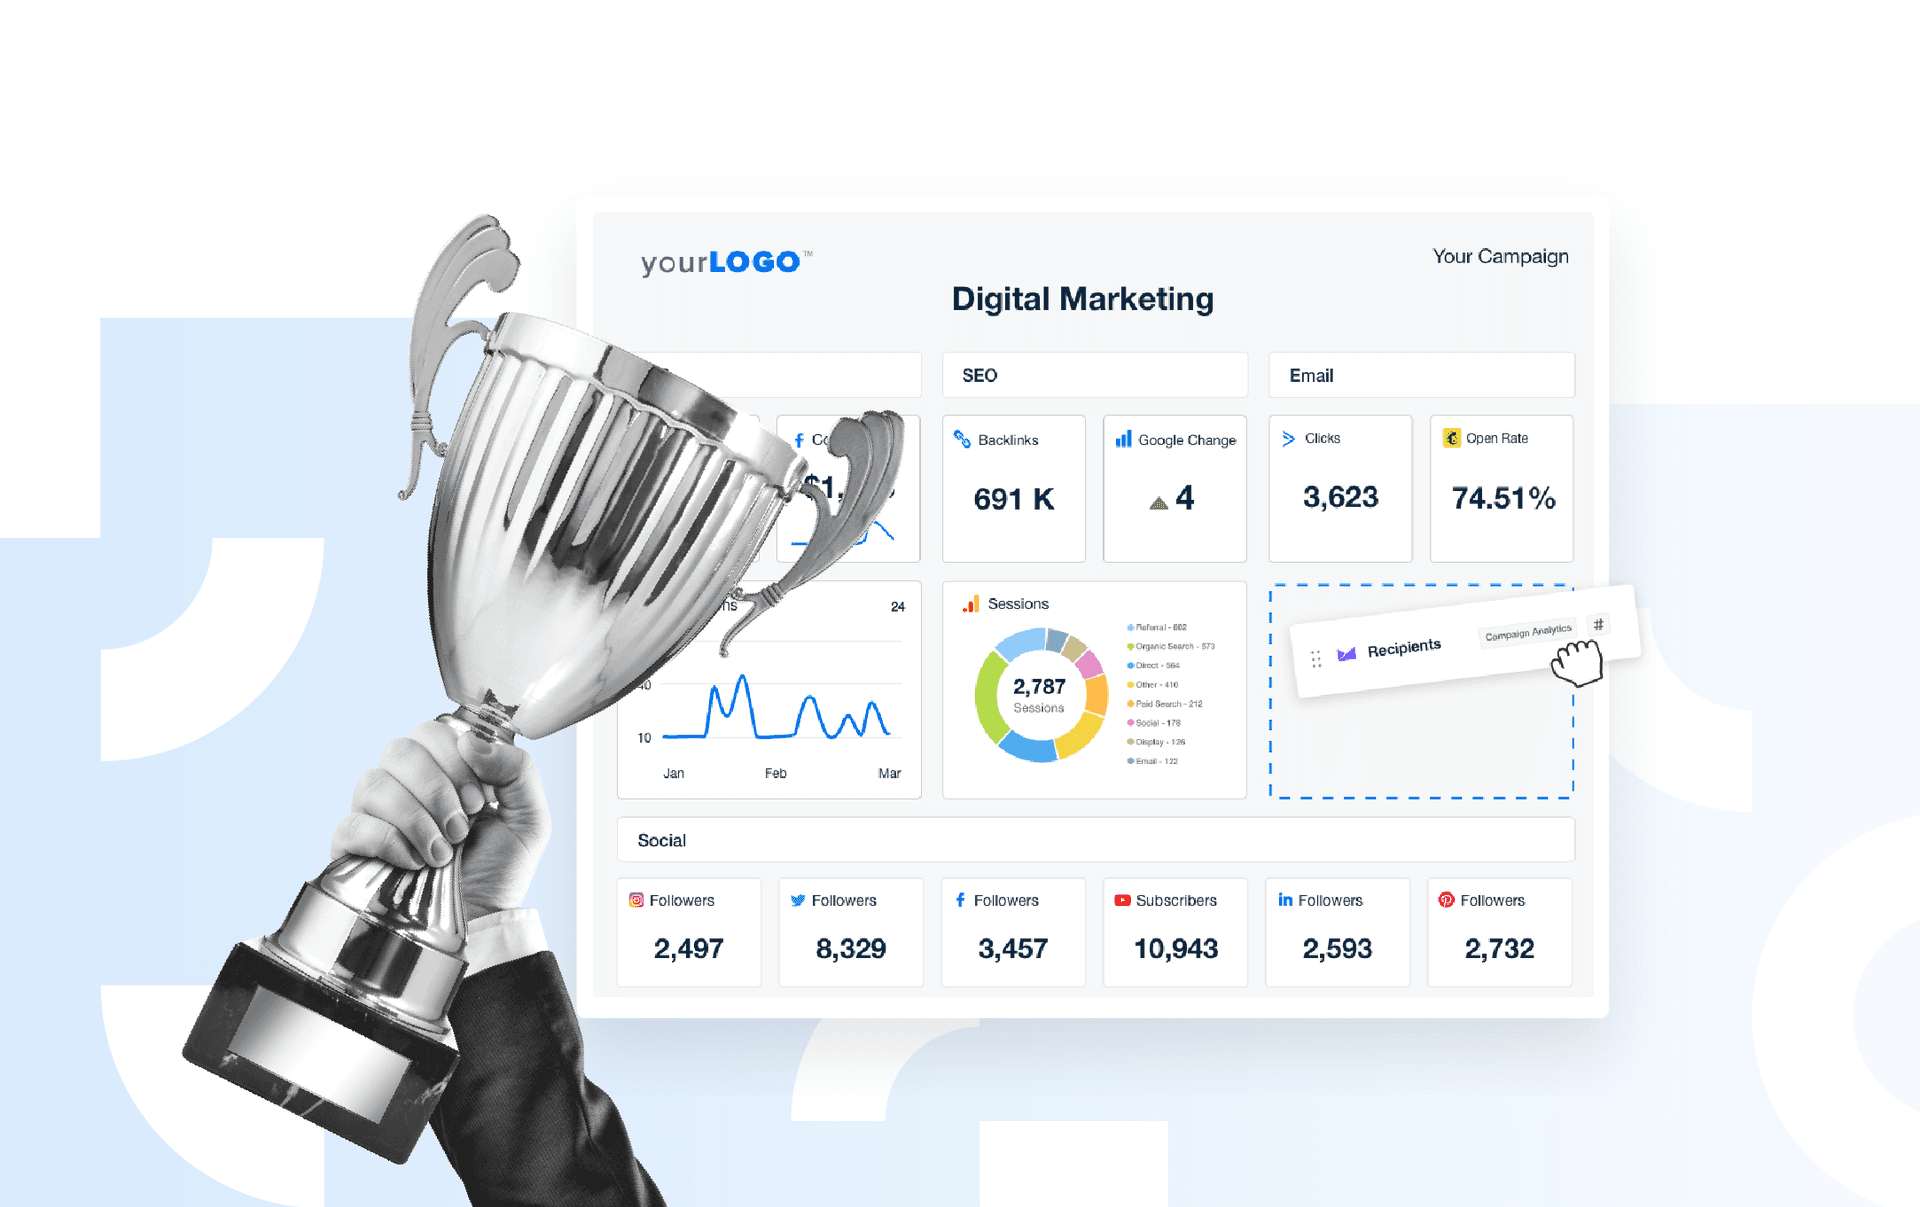
HubSpot reporting dashboards bring all of this rich data together in one place. These reports offer a clear and concise overview of campaign performance, enabling swift and informed decision-making. All of which ensures that your agency adapts to changing circumstances and keeps client campaigns on the right track.
Digging deeper, you encounter the powerhouse combination of HubSpot attribution reporting and HubSpot sales reporting. The former identifies high-performing marketing assets, while the latter quantifies marketing success in actual sales. Together, they provide a clear picture of return on investment, demonstrating the tangible value of your agency's work to clients.
This guide helps demystify HubSpot reporting, turning complexity into clarity. We aim to arm your agency with the knowledge needed to leverage these tools effectively, enhancing client satisfaction and your agency's reputation. So, let's begin this journey of discovery together.
The Art and Science of HubSpot Reports
HubSpot reports are much more than just charts and numbers. They paint a picture of your client's marketing efforts, carving a path toward optimized strategies and goals. These reports encompass both the art of interpretation and the science of data collection, creating a balanced approach that breathes life into your marketing decisions.
The Basics of HubSpot Reports
HubSpot reports give you a comprehensive view of sales performance, showing how well the sales team is working to convert prospects into paying customers.
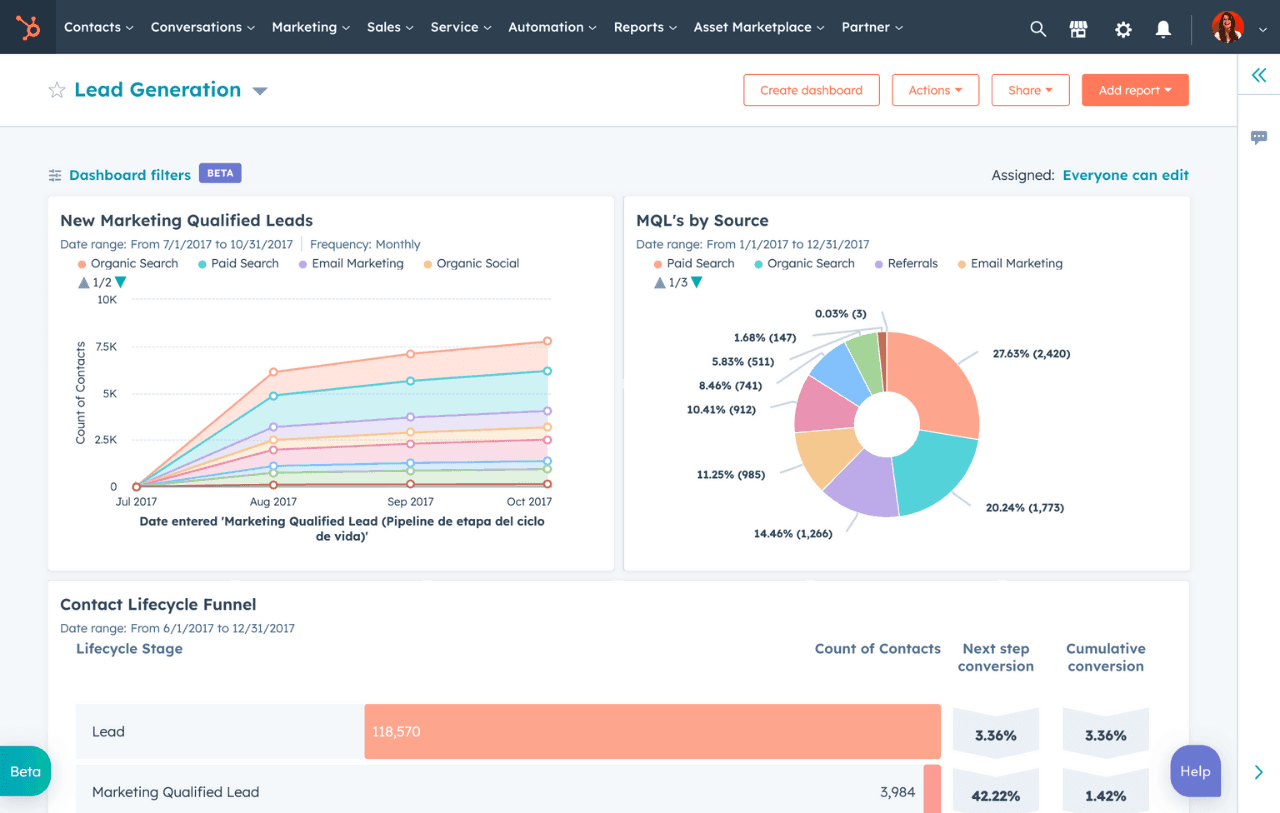
Creating multiple reports across different categories delivers a robust analysis of all sales funnel aspects. For instance, a contact report gives you the scoop on the quantity and quality of leads, while a company report can tell you which industries are hot spots for your client's business.
How to Create Reports in HubSpot
HubSpot's potent mix of analytics tools and CRM data provides a comprehensive platform for creating meaningful reports. It's an incredible sales analytics tool that lets you dig deep into data and create impactful insights for your clients. So, let's break down how you can navigate the HubSpot interface and create your first report.
When you first log into HubSpot, you'll find yourself in the dashboard, your central command station for all things related to HubSpot CRM data.
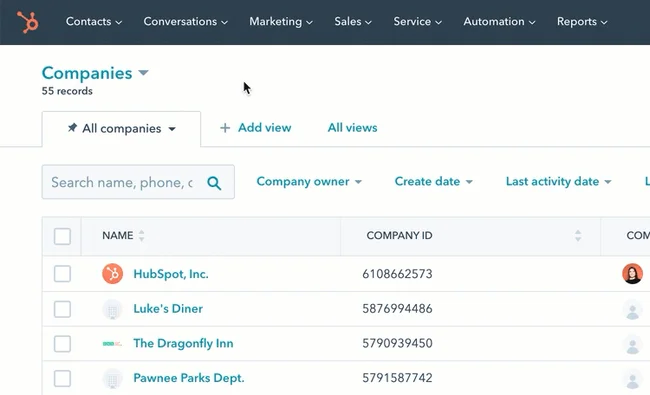
From here, navigate to the Reports tab, which houses the report library.
This is where you'll find pre-made reports, analytics tools, and the option to create custom reports. It's the heart of your HubSpot reporting journey, so take a moment to familiarize yourself with it.
Now, let's start creating a standard report in HubSpot. First, select the 'Create Custom Report' button in the report library. You'll be prompted to choose your primary data source, ranging from contacts and companies to deals and tickets.
Next, you'll select the specific metrics you want to include in the report. This might consist of marketing qualified leads, total sales, productivity by rep, or any other metric relevant to your client's goals.
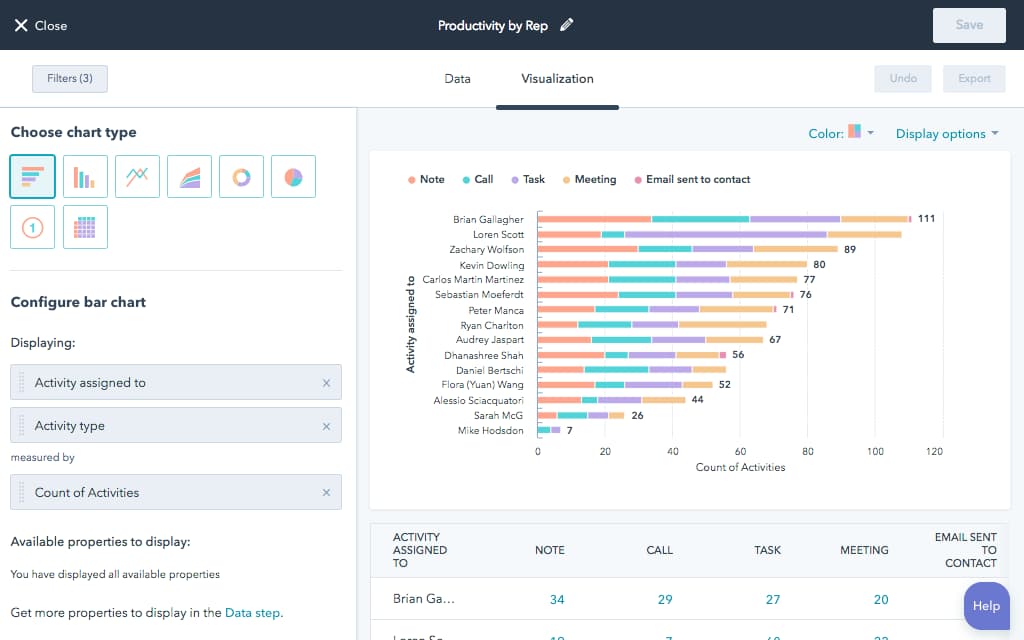
Once you've chosen your metrics, apply report filters to narrow down the data. This might involve filtering by date range, sales funnel stage, or other specific criteria matching your client's needs.
Finally, select 'Create Report,' and voila! Your standard report is ready for review and analysis.
Standard Terms and Their Meanings in HubSpot Reporting
As you navigate HubSpot reporting, you'll come across various terms. Here's a quick rundown of some common ones:
Lifecycle Stages: These are the stages a contact moves through during their customer journey. They range from visitor and lead to customer and promoter.
Contacts: These are the individuals in your HubSpot database, usually categorized as leads, customers, or other personas relevant to your client's business.
Marketing Qualified Leads (MQLs): Potential customers who have shown enough interest in your client's products or services to enter the sales funnel.
Sales Qualified Leads (SQLs): MQLs have progressed further down the funnel and are deemed ready for direct sales engagement.
Opportunity: SQLs who are now in an active sales process. They are undergoing specific sales activities that could lead to a deal.
Customer: Contacts who have completed a purchase and have a financial relationship with your company.
Evangelist: Customers who are delighted with your product or service and actively promote and refer your company to others.
Companies: These organizations in your database are often linked to multiple contacts.
Deals: A record of a potential sale or agreement between your client and contact or company. Deals are typically tracked through various stages of the sales funnel.
Sales Funnel: This is the process that potential customers go through from initial contact to final purchase.
Decoding the Customer Journey Report in HubSpot
Peeling back the layers of the customer journey report in HubSpot is like embarking on a treasure hunt. The prize? A goldmine of insights about your clients' customers that can drive marketing strategies to new heights.
Detailed Breakdown of the Customer Journey Report
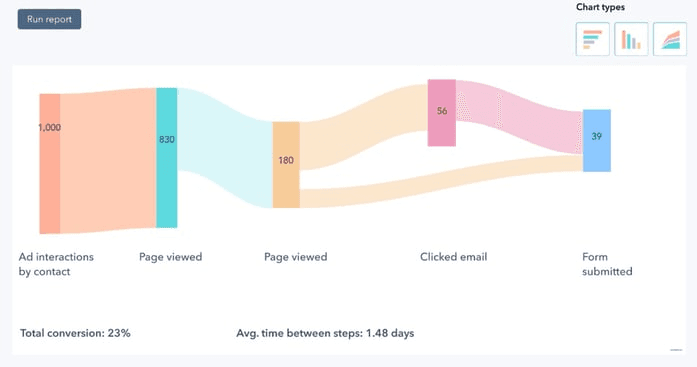
Imagine having a bird's eye view of how customers navigate through a client's marketing campaign. The customer journey report in HubSpot provides just that. It's a play-by-play account of a customer's interactions, showcasing touchpoints from first contact to final purchase.
With these reports, every email clicked, page viewed, and form filled morphs into a trail of breadcrumbs. Follow it closely, and it reveals how your client's marketing efforts nudge customers along the purchasing path.

An example of HubSpot’s own Customer Journey Map
The beauty of it is the ability to zoom into individual customers or to understand broader trends. This flexibility brings the power of perspective to your fingertips, enabling marketers to observe the forest and the trees simultaneously.
Practical Application of These Reports in Shaping Marketing Strategies
Imagine knowing which emails resonate with customers, which website pages make them linger, and which forms spark their curiosity enough to fill them out. Well, with the customer journey report, this isn't just a dream; it's the present reality.
These reports offer a roadmap for improving a client's marketing strategy. Seeing where customers drop off in the journey can help pinpoint areas for improvement. Conversely, identifying the steps that drive the most conversions can highlight successful strategies to replicate.
And let's remember the potential to impress clients. These reports present a clear narrative of how their customers interact with their marketing efforts. Now that's something that'll have clients doing a happy dance (even if they only admit it when no one's watching).
Unleashing the Power of HubSpot Attribution Reporting
The real beauty of marketing lies in its ability to translate data into stories. HubSpot attribution reporting plays a pivotal role in this process. This powerful tool shows what's working in a client's marketing strategy and why it's working.
Imagine trying to piece together a puzzle without knowing what the final picture looks like. That's what marketing can sometimes feel like without the right data. Enter HubSpot attribution reporting.
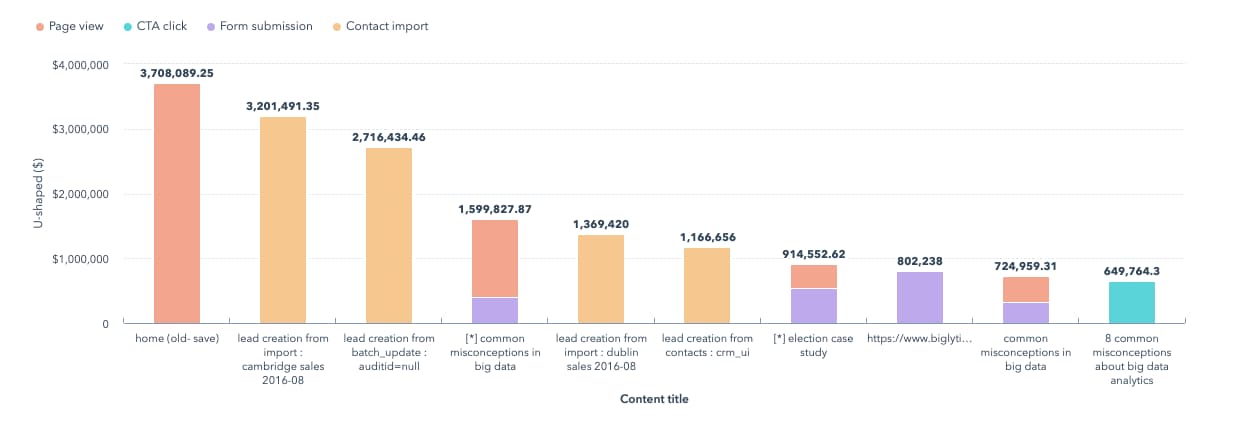
Attribution reporting in HubSpot goes beyond just tracking website traffic. It takes each potential customer interaction with a client's brand—be it a visit to a landing page, a click on a paid search ad, or a form submission—and assigns it value. In other words, it shows which marketing efforts generate leads and contribute to conversions.
These reports present a web of data points, each representing a touchpoint in the customer journey. They help a marketing team see how all the pieces fit together to form the bigger picture.
How to Interpret Attribution Data and Apply Insights to Campaign Refinement
Here's where things get interesting. Once the attribution report is ready, it's time to analyze data and dive into the story it's telling.
Are customers finding the client's brand through paid search, or do they stumble upon a blog post and explore further? Is a specific landing page doing the heavy lifting in lead generation? Or is it an email campaign that's bringing in the majority of conversions?
The attribution report lays all these relevant metrics bare. It's now up to the marketing team to interpret this information and use it to tweak and refine the client's marketing strategy.
It could be time to allocate more budget to paid search, or perhaps that underperforming landing page needs a little love. It's all about taking those insights and turning them into actions because data without application is just a bunch of numbers.
Linking Marketing Efforts to Revenue with HubSpot Sales Reporting
One of the most significant challenges for marketing agencies is demonstrating the tangible value of marketing efforts. HubSpot sales reporting is a bridge that connects these efforts to the bottom line, spotlighting the revenue impact of marketing strategies.
Overview of HubSpot Sales Reporting
This reporting tool delves into the nitty-gritty details of the sales process, from the number of deals closed by each sales representative to the revenue generated over specific time frames.
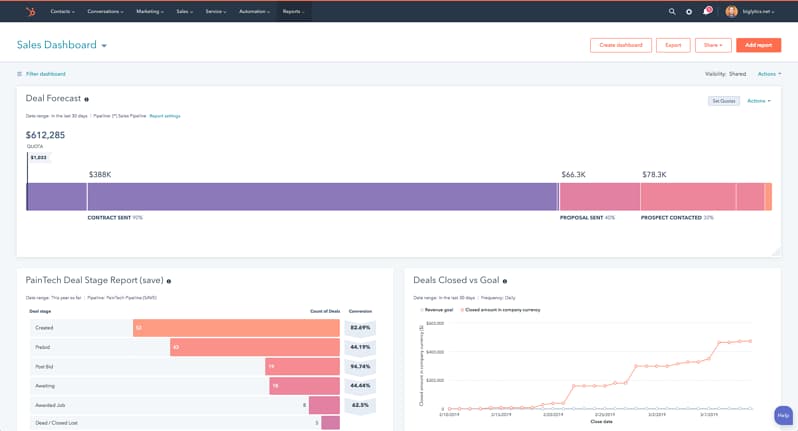
With sales reporting, it's possible to monitor the activity of each sales rep and track their impact on overall sales performance. This information serves as a clear-cut success metric and provides a comprehensive view of the client's revenue landscape.
Ways to Showcase Marketing Success and Return on Investment to Clients
Marketing is not just about creating flashy campaigns. It's about tying those campaigns to real-world results. Here's where HubSpot sales reporting swoops in like a superhero, cape billowing in the wind.
By linking marketing campaigns to sales results, easily demonstrate how specific marketing strategies directly influence the client's bottom line. Did a boost in website traffic after launching a new content campaign result in more leads for the sales reps? Did a targeted email series coincide with a spike in closed deals? These correlations, made visible through sales reporting, are gold when showcasing the return on investment to clients.
More importantly, they provide a compelling argument for the integral role marketing plays in driving revenue. It's the kind of argument that has clients nodding along, recognizing the indisputable value marketing brings to their business. And in client-agency relationships, that's a win for everyone.
HubSpot sales reporting is more than just a tool; it's a superpower for marketing agencies. It transforms the often nebulous impact of marketing efforts into solid numbers and clear revenue links while giving a well-deserved pat on the back to those hardworking sales representatives.
Tailoring HubSpot to Your Clients' Needs with Custom Reports
One size certainly does not fit all clients in the marketing agency world. We touched on standard reports earlier, but custom reports in HubSpot rise to the occasion, providing tailored insights to meet each client's unique needs.
Think of custom reports as an artisanal brew, each crafted to suit a client's specific tastes and preferences. Unlike default reports, which offer a broad, generalized view, custom reports hone in on specific metrics relevant to a client's unique marketing strategy.
From custom rule grouping to event reporting, these reports provide the flexibility to focus on the data points that matter most to a client. They enable agencies to combine multiple reports, create customized dashboards, and offer targeted insights based on the client's marketing goals.
A Quick Guide To Using the Custom Report Builder in HubSpot
Building reports in HubSpot's custom report builder is like assembling a jigsaw puzzle, carefully placing each piece to create a complete picture. The process begins in HubSpot's report library, where a blank canvas awaits.
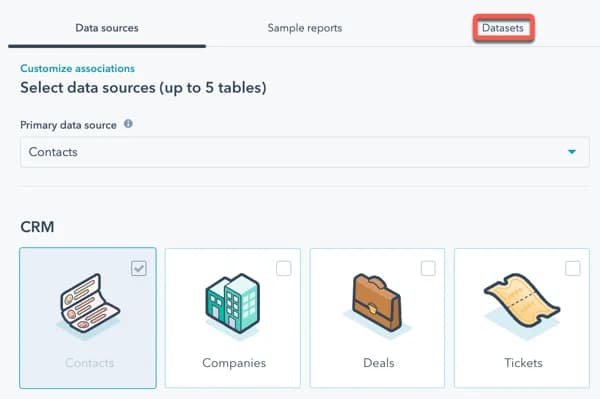
The custom report builder offers a selection of data sources, chart types, and filters. It's a matter of picking and choosing the elements that align with the client's goals, whether tracking conversions, monitoring website traffic, or analyzing customer behavior.
Even the most complex datasets become manageable when broken down into digestible pieces. With patience and a dash of creativity, the custom report builder transforms into a powerful tool in the agency's arsenal.
Non-table reports, charts, graphs—the custom report builder caters to all tastes. More importantly, it provides a way to deliver targeted insights to clients in an easily understandable format.
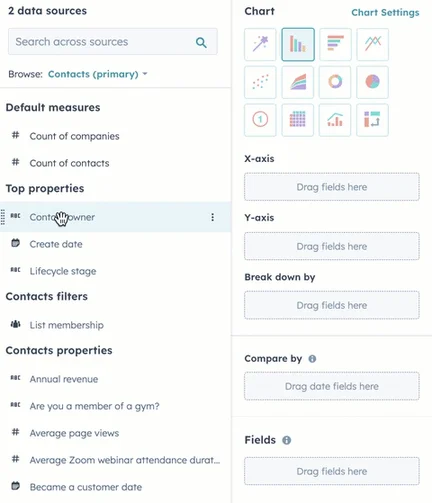
Like the custom marketing dashboards in AgencyAnalytics, custom reports in HubSpot make it possible to present data in a way that aligns with the client's perspective. It might mean focusing on a particular campaign, tracking a specific metric, or highlighting a significant trend. These tailored insights go a long way in demonstrating the agency's value, reinforcing the agency-client relationship.
To dig deeper into the data, use custom filters to select exactly what you need to see in the custom report.
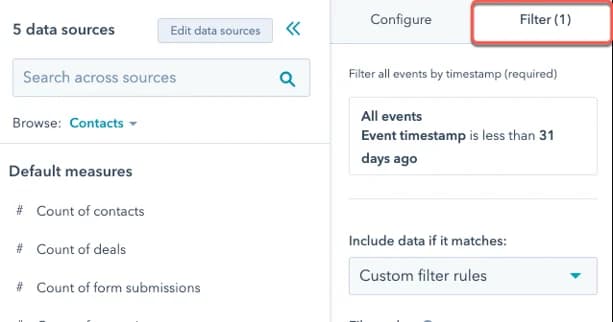
Add conditions to the filter fields, isolating the specific data points.
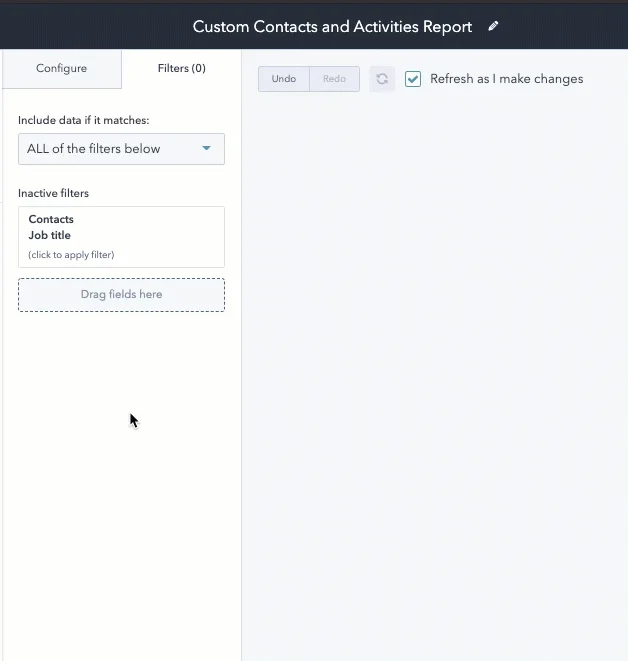
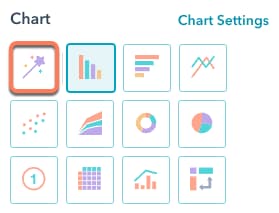
Then, decide how to present that data using the various data visualization options available in the native HubSpot interface.
Navigating the reports list in HubSpot might initially seem overwhelming, but it's worth the effort. Custom reports are like keys that unlock the door to deep, meaningful insights explicitly tailored to each client's needs. It's not just about data anymore; it's about the story it tells.
Impress clients and save hours with custom, automated reporting.
Join 7,000+ agencies that create reports in minutes instead of hours using AgencyAnalytics. Get started for free. No credit card required.
Key HubSpot Metrics to Track for Optimization and Reporting
In a digital-first world, marketing metrics are the heartbeat, providing vital insights into campaign health and success. HubSpot houses a treasure trove of these metrics, each a piece in the puzzle of optimization and reporting.
Understanding Data Categories and How They Relate to Marketing Goals
Now, let's dig into data categories. Think of them as different chapters in your client's marketing story. Each category holds critical metrics that align with specific marketing goals.
For instance, the Contacts category is a gold mine for tracking lead generation efforts. It reveals how many sales-qualified leads have been generated over a given period.
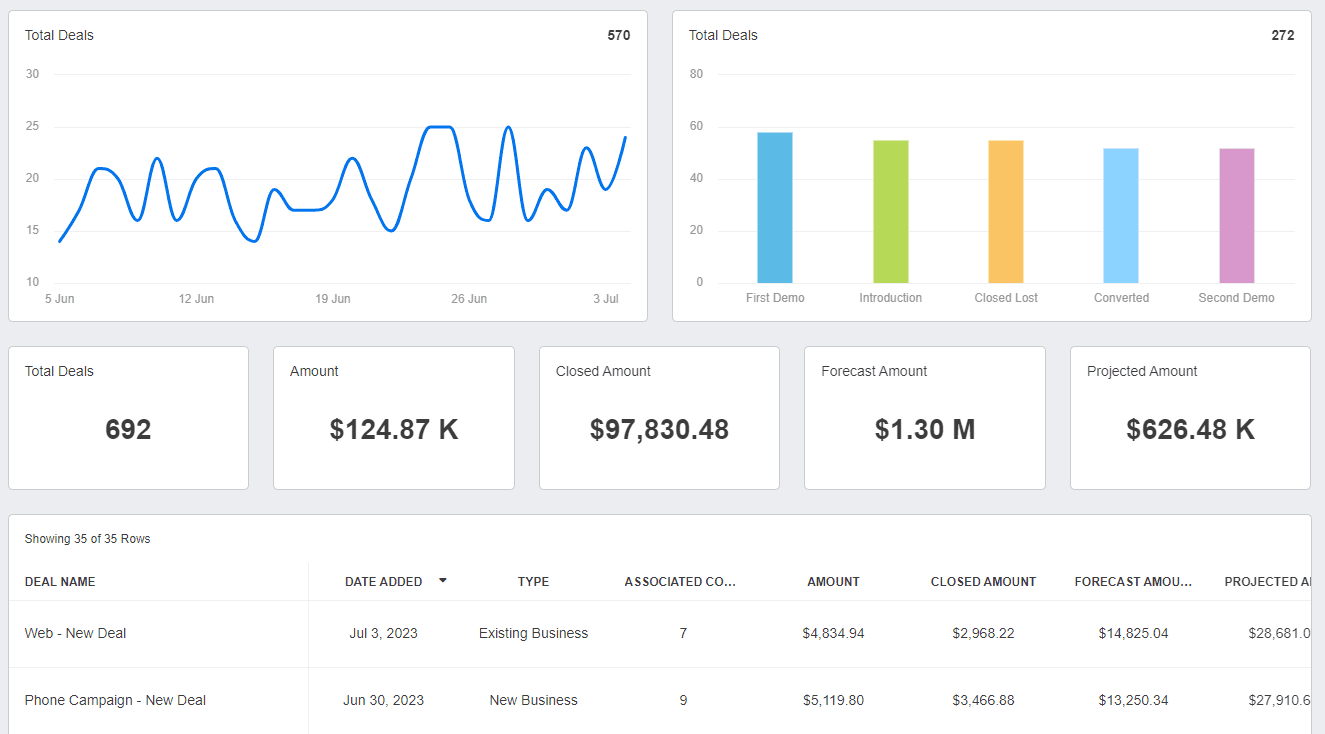
Similarly, the Deals category helps follow the closing process, showing the number of successful sales within a specified timeframe.
Recognizing these categories and how they relate to your client's marketing goals is a fundamental aspect of HubSpot reporting. It's all about knowing which puzzle pieces to look at and how they fit together to form a complete picture. So, roll up your sleeves and get ready to dive into the data pool. You might be surprised by what you find!
The Different Types of HubSpot Metrics
The world of HubSpot metrics is vast and varied, incorporating multiple data sources to provide a comprehensive view of marketing performance. Each metric serves a unique purpose, shedding light on a specific aspect of a campaign.
It could be tracking website traffic to gauge the reach of an online campaign or monitoring conversion rates to determine the effectiveness of a landing page. Maybe it's manually collating data offline or aggregating data sources to paint a clearer picture of customer behavior.
HubSpot's analytics tools bring all the data together in one place, making it accessible and understandable. Whether it's available in the default settings or newly available data from a recent update, it's all there in the datasets tab, ready to be explored and utilized.
Contacts
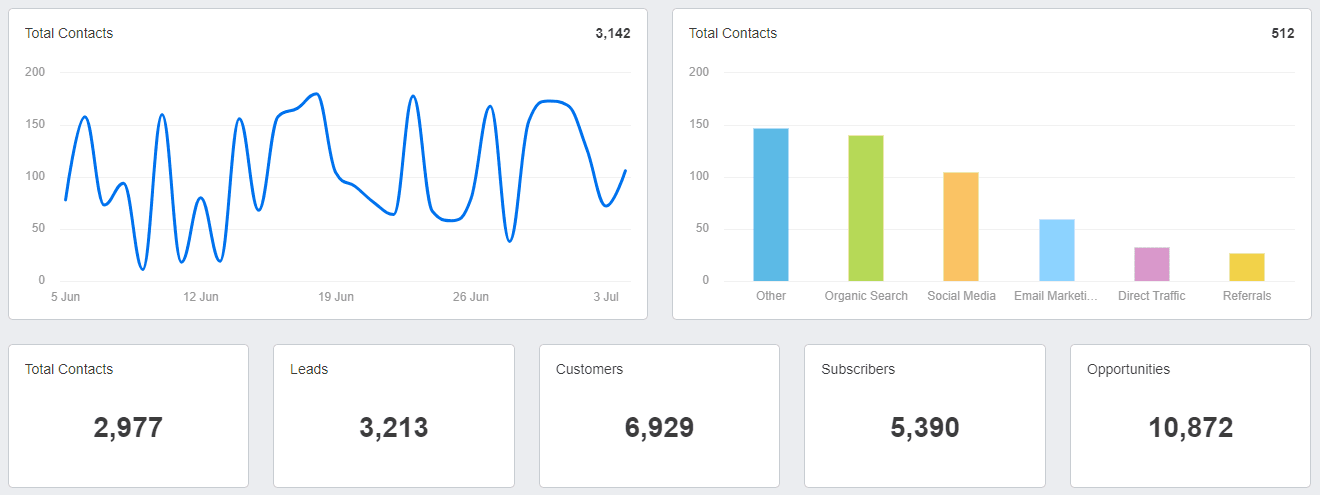
In the Contacts category, you'll find metrics centered around the growth and activity of your client's contact database. It tracks everything from new contacts gained and their source to their engagement with the client's marketing efforts.
Companies
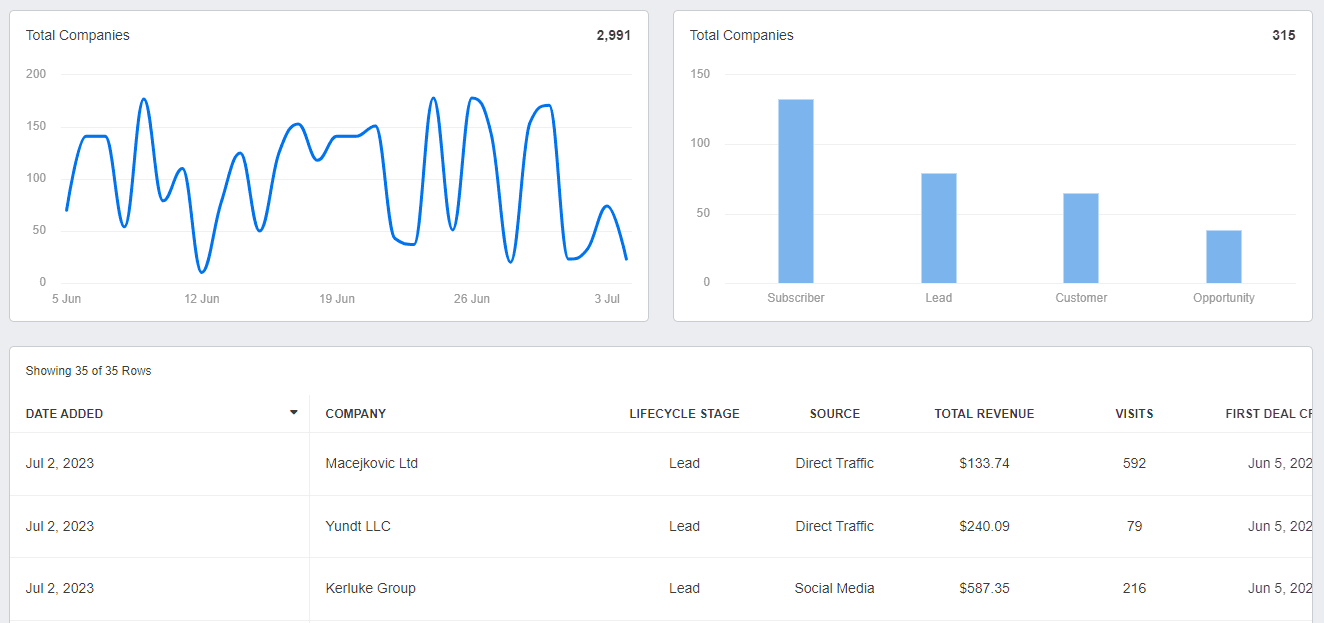
Company metrics provide a bird's-eye view of all the organizations interacting with the client's business. This includes data like the number of new companies added and their overall engagement, helping you understand and measure B2B interactions.
Web Traffic
Web Traffic metrics highlight who's visiting the client's website and what they're doing there. Page views, session duration, bounce rate - it's all about understanding the behavior of visitors once they land on the website.
Email metrics take the pulse of your client's email marketing campaigns. From open rates to click-through rates, it's all about measuring the effectiveness of email communication and seeing how recipients interact with the emails.
Content
Content metrics are all about understanding the performance of a client’s blog posts, landing pages, and other content efforts. These content marketing KPIs measure views, conversions, and other vital signs of the content performance, helping you fine-tune the content strategy.
Deals
The Deals category gives you insights into the sales side of things. It tracks deal stages, amounts, and the number of deals closed, offering a clear picture of the sales pipeline.
Forms
Forms metrics are vital to understanding how effectively the website or landing pages capture lead information. Form views, submissions, and conversion rates can provide invaluable insights into how potential customers interact with the client's lead capture efforts.
These metrics paint a comprehensive picture of a marketing campaign's health. Each metric tells a part of the story, and together, they guide the ongoing refinement of a successful marketing strategy.
Measurement and Reporting vs. Optimization Metrics
There's a not-so-clear divide between measurement and reporting metrics and optimization metrics in the wide world of metrics.
Measurement and reporting metrics, as the name suggests, are all about tracking performance. They are the numbers that go into reports, the quantifiable proof of a campaign's success, or the indicators of areas that need improvement.
On the other hand, optimization metrics are the guiding stars for future strategy. They provide insights into what's working well and what's not, enabling agencies to fine-tune their efforts for maximum effectiveness. These metrics reflect on past performance and pave the way for future success.
HubSpot metrics offer a way to navigate the complex seas of marketing data. With these metrics at their fingertips, agencies chart a course that reports on current status and optimizes future campaigns for even greater success. And that's what marketing is all about—continuous learning, adaptation, and growth.
The following table outlines some of the most common HubSpot metrics and whether they would be used typically for campaign optimization, client reporting, or both.
Key HubSpot Metric | Classification | Reasoning |
Contact Submissions | Both | Contact Submissions help analyze lead capture effectiveness, which is helpful for campaign optimization. They also provide clients with a clear picture of the lead generation process. |
Submissions Per View | Optimization | This metric assesses a webpage's conversion rate or a form vital for campaign optimization. |
Session To Contact Rate | Optimization | This metric helps evaluate sessions' efficiency in generating contacts - crucial for refining the user experience and conversion strategies. |
Contact To Customer Rate | Both | It explains how effective the conversion process is from contact to customer. This aids in optimizing the marketing process and provides clients with a metric to evaluate success. |
View To Customer Rate | Both | This conversion metric is significant for optimizing the website or landing page experience and showcasing overall campaign effectiveness to clients. |
Opportunities | Reporting | Opportunities, as a sales metric, are typically reported to clients to demonstrate the potential of leads converting into deals. |
Deals | Reporting | Deals are sales metrics that clients are particularly interested in as they represent actual sales and revenue. |
Closed Amount | Reporting | The Closed Amount is typically used for client reporting as it directly signifies revenue from successful deals. |
Conversion Rate | Both | Conversion rates are pivotal for both optimization (to improve marketing strategies) and reporting (as they illustrate the effectiveness of marketing efforts to clients). |
Both | Email Open Rates help optimize email marketing strategies and are also key metrics clients want to see to gauge the success of email campaigns. | |
Reporting | CLV is generally used for client reporting as it reflects the total value a customer brings to their business over their lifetime, a long-term success metric. |
Creating Automated HubSpot Reports for Clients Using AgencyAnalytics
Keeping clients in the loop about their campaign's progress is as important as the campaign itself. AgencyAnalytics and HubSpot team up to offer an incredibly smooth, automated reporting process.
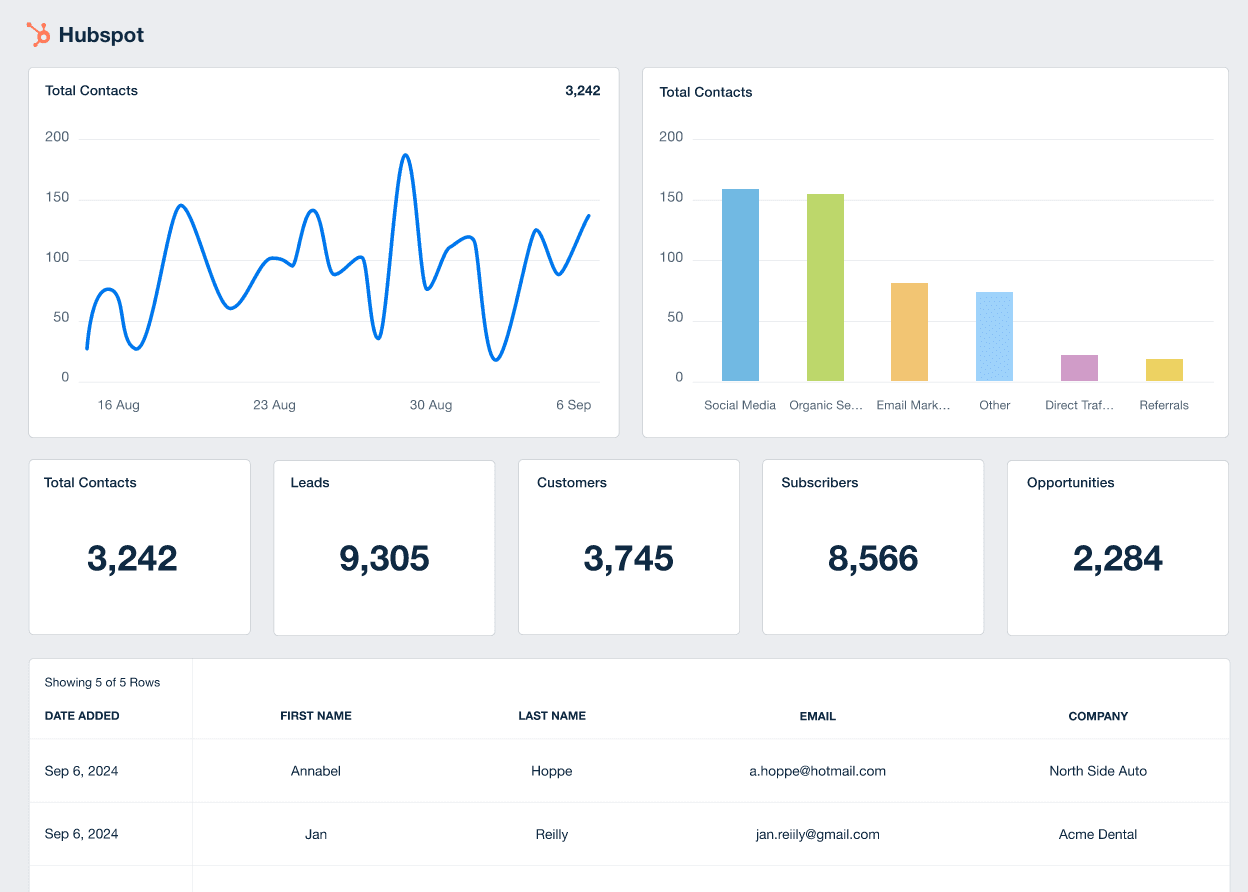
AgencyAnalytics HubSpot Reporting Overview
The AgencyAnalytics automated client reporting tool brings an array of HubSpot analytics into one comprehensive platform. Whether it's about tracking the deal pipeline or analyzing landing page performance, everything is within arm's reach, all from a single HubSpot dashboard.
This is not just about consolidating data; it's about enhancing it too.
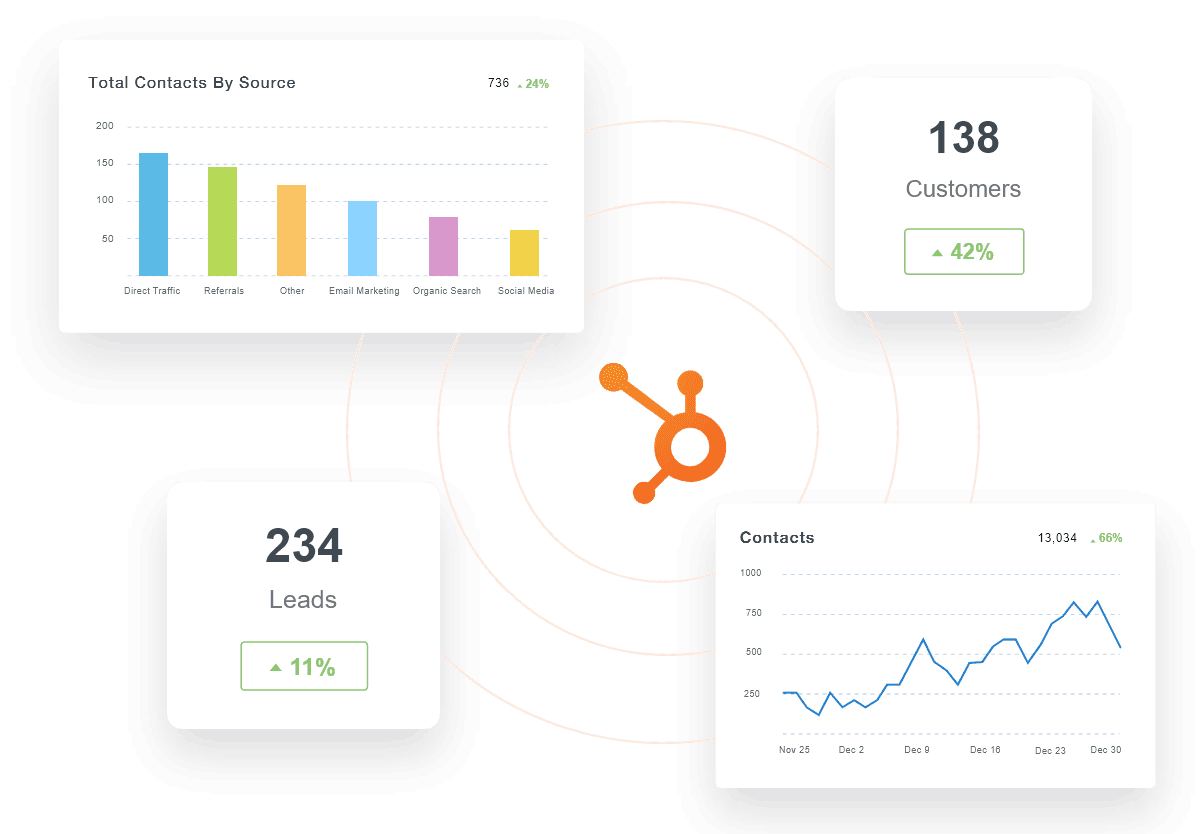
AgencyAnalytics provides flexible and customizable dashboards that are as informative as they are attractive, showcasing critical metrics in an easy-to-understand format. It's as if Microsoft Excel and Google Sheets had a marketing-savvy baby, who grew up to be a genius.
Combining HubSpot Analytics with 80+ Other Marketing Channels
Where AgencyAnalytics truly shines is its ability to integrate HubSpot analytics with data from more than 80 other marketing tools. It's like a marketing symphony, with each tool playing its part in harmony. This allows for a more holistic view of a campaign, revealing correlations and insights that would otherwise remain hidden.
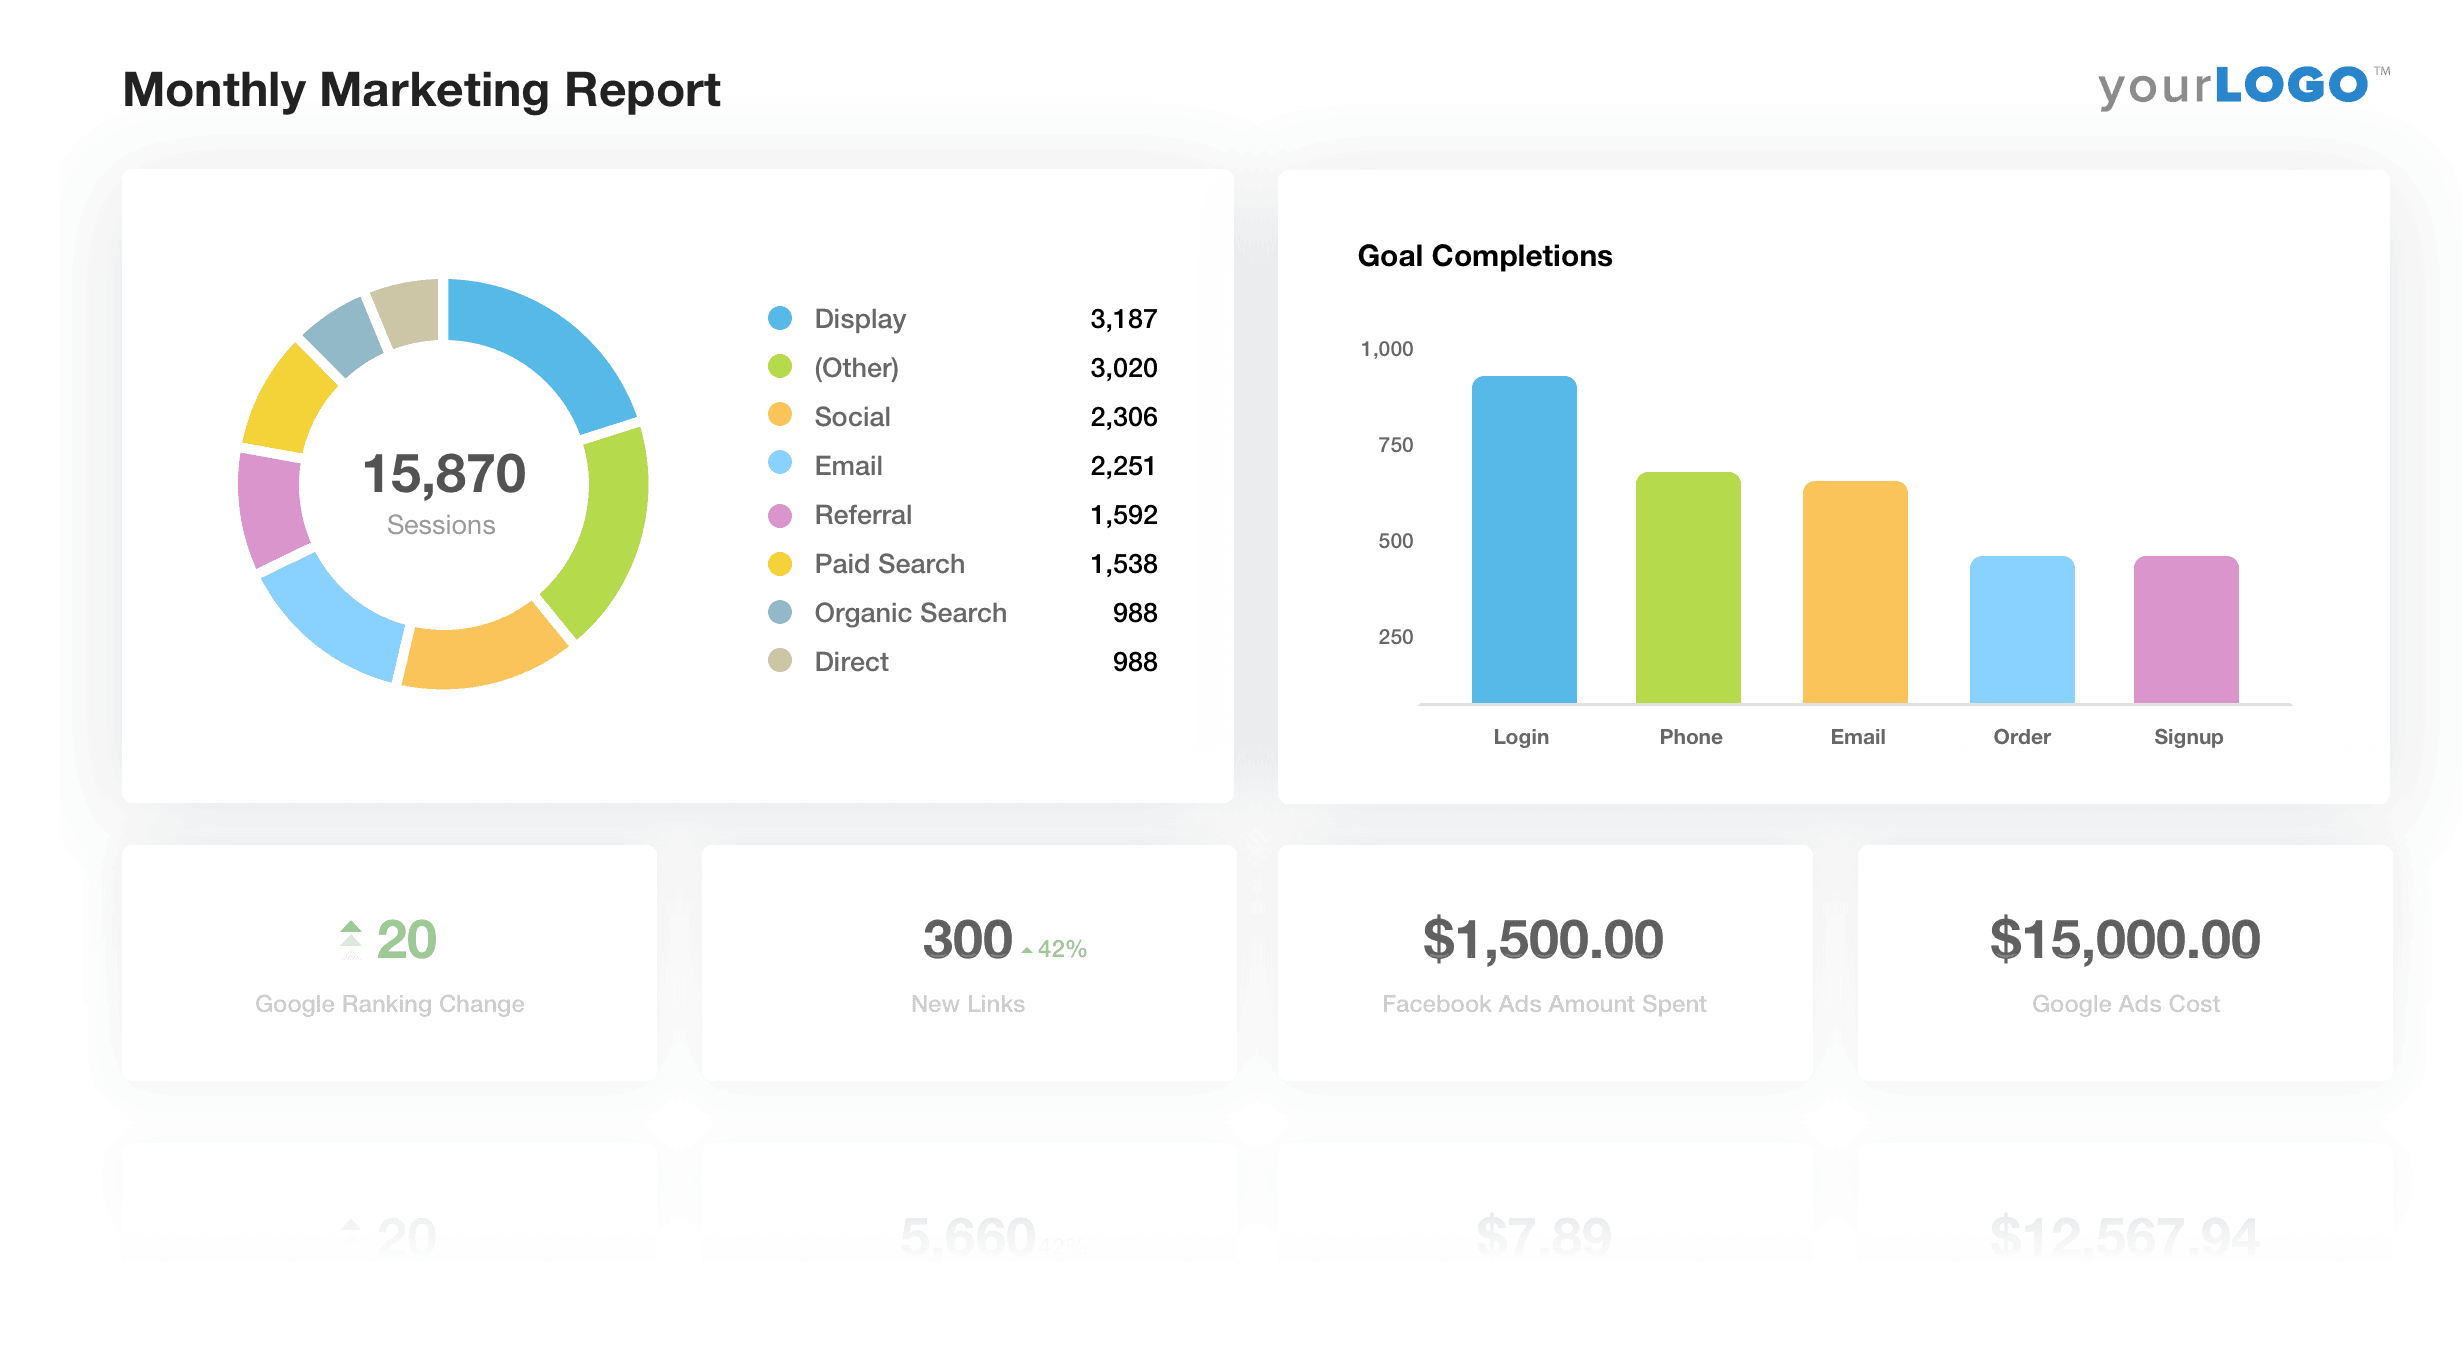
For example, by combining HubSpot dashboards with Google Analytics 4 data, one might notice that landing pages linked to social media perform differently than those related to email marketing. This insight could spark new strategies, shifting the marketing approach to better cater to the clients' audience.
Automating reports with AgencyAnalytics and HubSpot doesn't just save time; it paints a complete picture, offering clients a front-row seat to the ongoing spectacle of their marketing campaign. And that transparency is what makes clients trust an agency. They see where their investment is going and how it's working for them. And that's the magic of marketing - it's not just about the destination, but the journey too.
Accurate information helps us make informed decisions and provide recommendations. Using a tool like AgencyAnalytics helps us do this efficiently so we can spend more time improving results for our clients.


Summary and Key Takeaways
From the in-depth exploration of the versatile HubSpot reporting tool to diving deep into the world of HubSpot metrics and beyond, this guide illuminated how marketing agencies harness these tools to provide the best value to their clients. The journey doesn't stop here, though. The real magic begins when this knowledge is put into practice, refining campaigns and tailoring strategies to each client's unique needs.
Here are some key takeaways from our journey:
HubSpot offers a wealth of reporting features, from standard sales and attribution reports to customizable dashboards. These tools provide valuable insights into marketing campaigns, helping to optimize strategies and demonstrate a campaign's effectiveness to clients.
Understanding HubSpot metrics is vital for both optimization and reporting. Certain metrics are more suited for one than the other, but many serve both purposes. It is essential to know which metrics are most valuable to your client and their unique goals.
HubSpot's customer journey report and attribution reporting tool are invaluable for understanding a campaign's performance. These tools not only measure a campaign's current state but also provide insights that can inform future strategies.
Custom reports in HubSpot offer targeted insights for clients, aligning data with their specific needs. From event reporting to combining multiple reports, HubSpot offers a range of possibilities for customization.
Tools like AgencyAnalytics take HubSpot reporting to the next level, automating the process and combining data from multiple sources. This integration provides a comprehensive view of a campaign's performance, providing the most value to clients.
By mastering these HubSpot reporting tools and understanding their potential, marketing agencies better meet and exceed their clients' expectations. It's all about transforming data into stories and those stories into successful marketing strategies. It's not just about numbers; it's about creating narratives that drive results.

Written by
Alex is in product marketing, pushing the great work from the engineering team out into the world. When he's not marketing, he's probably rock climbing or researching the latest eCommerce trends!
Read more posts by Alex GirardiSee how 7,000+ marketing agencies help clients win
Free 14-day trial. No credit card required.


