- Chapter 1Why Is Client Reporting Important?
- Chapter 2Creating a Framework for Client Success
- Chapter 3What Is a KPI?
- Chapter 4The Key Differences Between KPIs vs Metrics
- KPIs and Metrics: What Is the Difference?
- How KPIs and Metrics Work Together
- Best Practices for Identifying & Monitoring KPIs and Metrics
- How Raincross Turned Metrics into Money
- Efficiently Tracking Your Clients’ Metrics and KPIs
- Chapter 5Top Digital Marketing Metrics to Showcase Success
- Chapter 6What To Include in Client Reports
- Chapter 7Using Data Storytelling in Client Reports
- Chapter 8How To Use Automated Client Reporting To Reclaim Billable Hours
- Chapter 9Advanced Client Reporting Strategies & Best Practices
- Chapter 10Buying vs. Building a Reporting Platform
It’s tempting to think of numbers as just, well, numbers. However, when it comes to client success, these figures serve as the navigational stars guiding the voyage. Understanding KPIs and metrics converts that overwhelming sea of numbers into a finely tuned roadmap tailored to each client’s key business goals.
Here, you’ll learn what to track, why it matters, and how to implement practical changes. We’ll break down the four characteristics every KPI should possess: being actionable, directional, accurate, and measurable.
Selecting KPIs that inform future business strategies and avoiding vanity metrics is crucial. This ensures that the metrics reflect the truth and align with business goals, helping to measure the success of strategies and find improvement opportunities for continuous organizational growth.
You’ll learn how these business metrics function as the lifeblood of your client’s marketing campaigns, the pulse every Marketing Manager should check regularly. And it’s not just about tracking KPI progress—it’s about shaping it. The use of custom reports and insightful analysis puts your client’s account in the fast lane toward reaching objectives.
After all, you can’t stay on track, measure success, or identify areas for improvement if you’re not properly implementing KPIs and metrics at your agency. Having this data available at your fingertips gives you actionable insights that benefit your clients.
While several factors go into keeping clients happy, we can all agree that highlighting your value and how you positively impact a client’s bottom line is a surefire way to make your agency indispensable.
KPIs and Metrics: What Is the Difference?
Are KPIs the same as metrics? Everything you track in your client’s business is a metric, but only a few of these metrics are directly relevant to their main business goal, making them KPIs (key performance indicators). These KPIs are crucial as they align with the overarching business goals, guiding strategic planning and performance evaluation.
KPIs are also designed to track progress toward achieving specific business objectives, enhancing decision-making and overall performance.
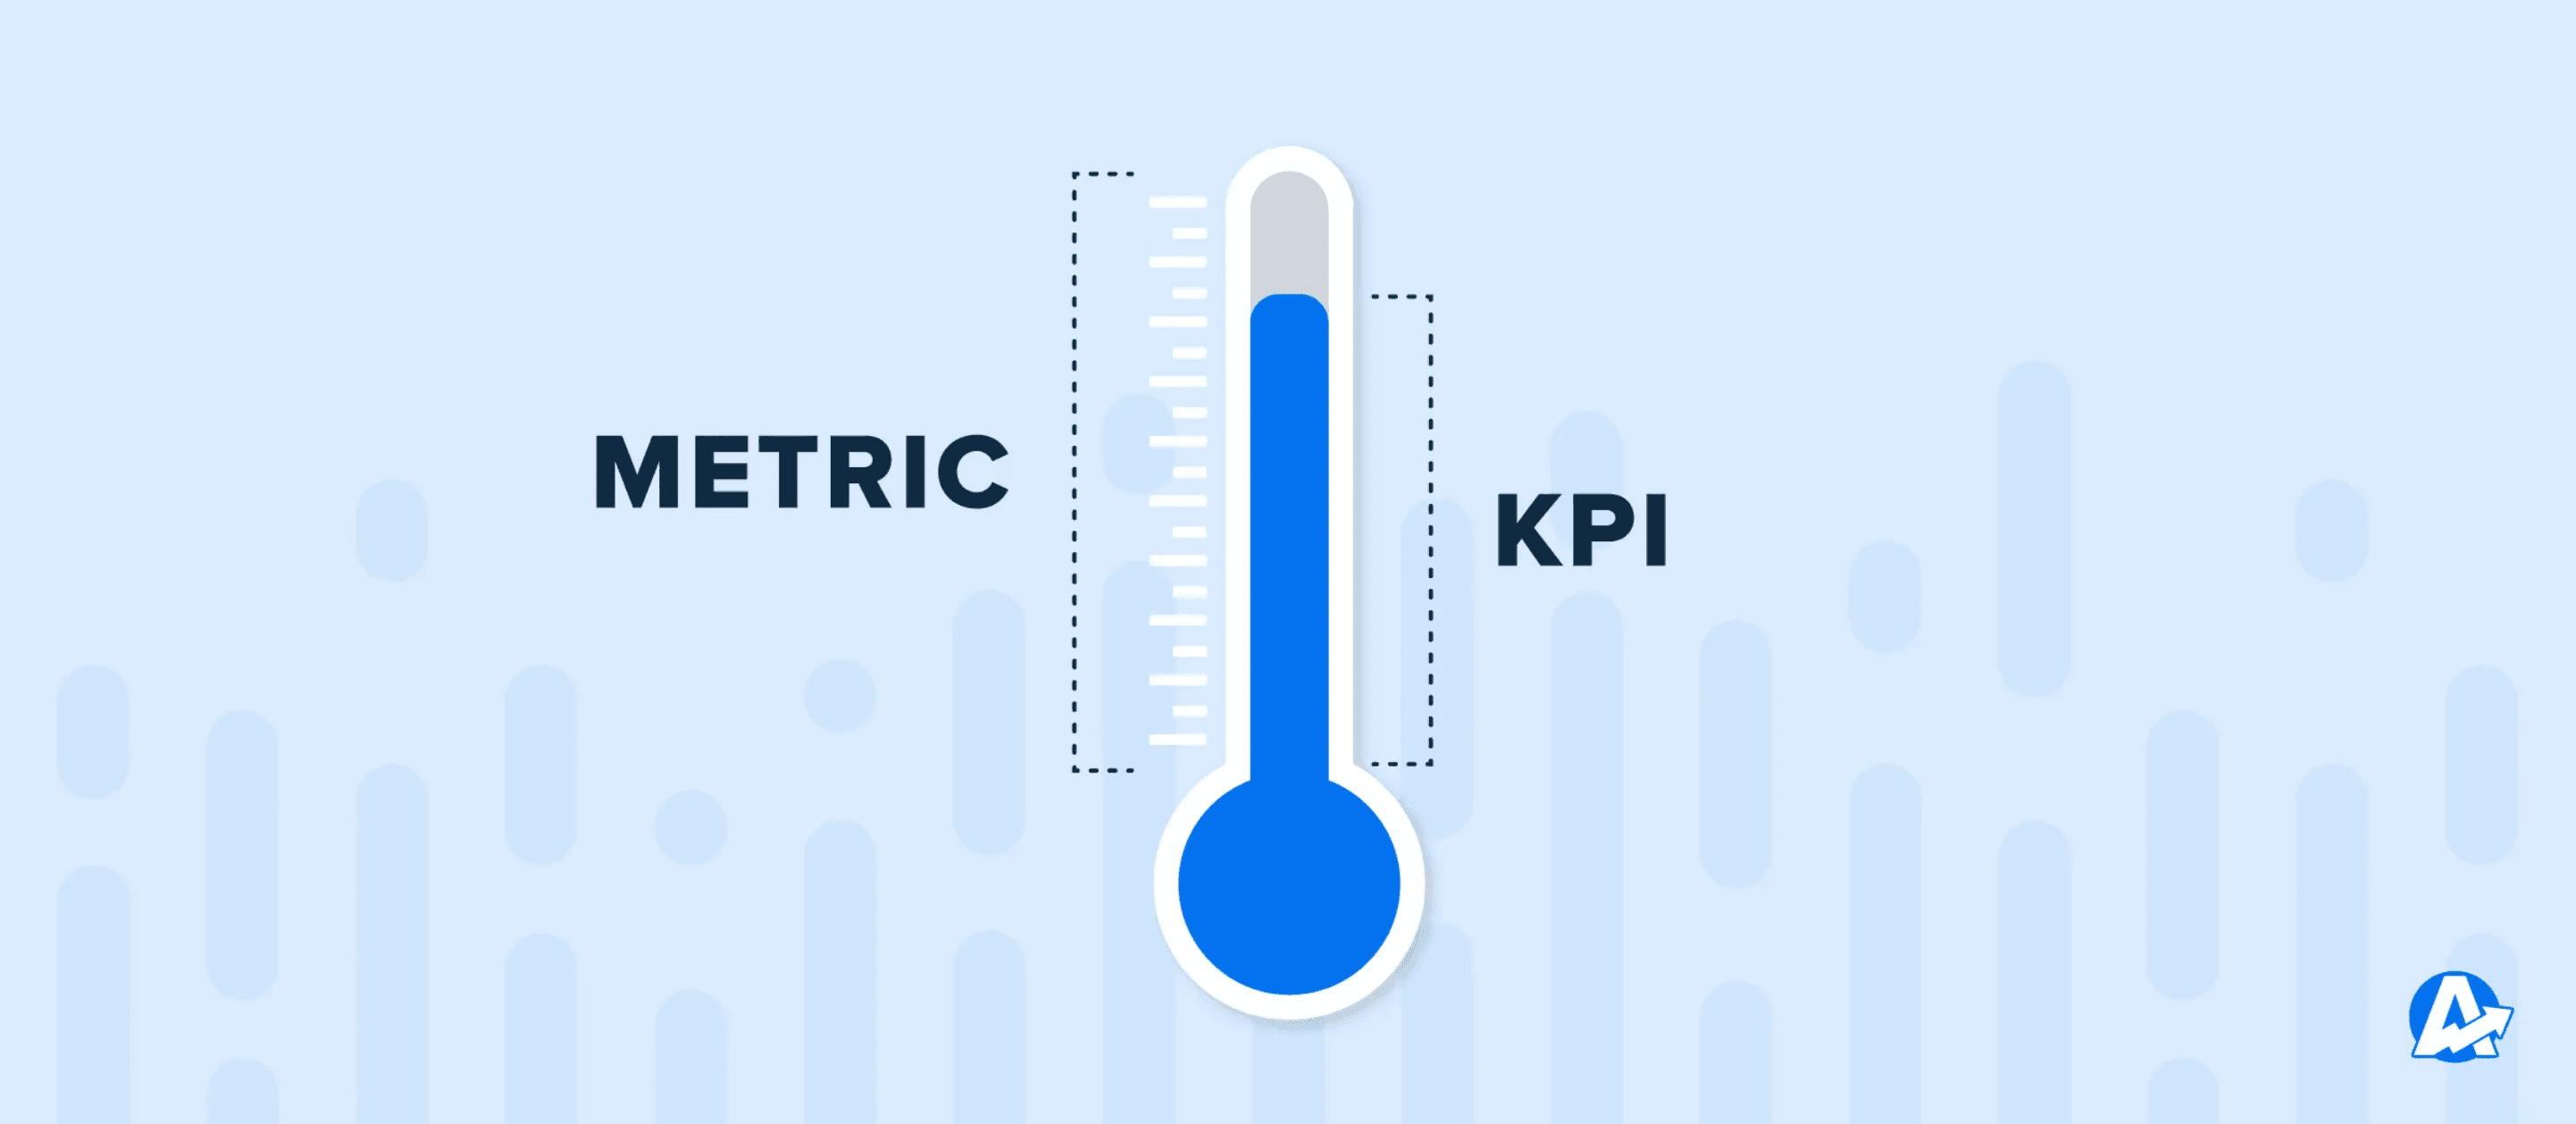
In other words, all KPIs are metrics, but not all metrics are KPIs.
KPIs are specific measurements that are used to track progress toward specific goals. On the other hand, metrics can be any type of data collected as part of routine business operations.
KPIs allow us, as the agency, to demonstrate our value to the client. There are basic KPIs such as spend, clicks, impressions, ranking, etc., but the real KPIs every client wants to know are leads and/or sales. We like to include both in our monthly reports.
Ultimately, what is their ROI from our efforts? When you can clearly demonstrate this month over month, it increases your retention rate and keeps clients paying you month after month.
Jacob Hicks, Owner of Magnyfi
And if someone references the “KPI metrics” for a client, they are (usually) referring to the metrics that support the individual KPIs. But, it’s always best to clarify as not everyone understands the fine line between KPIs and Metrics.
Here are a few other key differences between KPIs and metrics:
Key Performance Indicator (KPI) | Metric |
|---|---|
Focused | Limited to one result or dimension |
Bigger-picture | Granular |
Represent key business goals | Measure specific tactics |
Usually long-term goals | Usually shorter-term goals |
Can be measured in various ways | Usually tied to specific data |
Results-oriented | Focuses on specific business processes and problems |
Often easier to understand | Needs interpretation |
Business metrics can provide detailed insights into specific business processes and activities, helping organizations understand their overall performance beyond just focusing on KPIs.
Ask yourself these questions when trying to separate a KPI from a metric:
Will a fundamental change in this metric impact the client’s business?
What results or dimensions of their business are you trying to measure?
How will you measure it?
What is the purpose of your measurements?
How will you know if you are successful?
How will you know what to change next time around?
What Is a Metric?
To put it simply, a metric is a category of quantifiable data relevant to a company’s performance. Measuring business performance through various metrics and KPIs provides insight into an organization's success in achieving its strategic objectives.
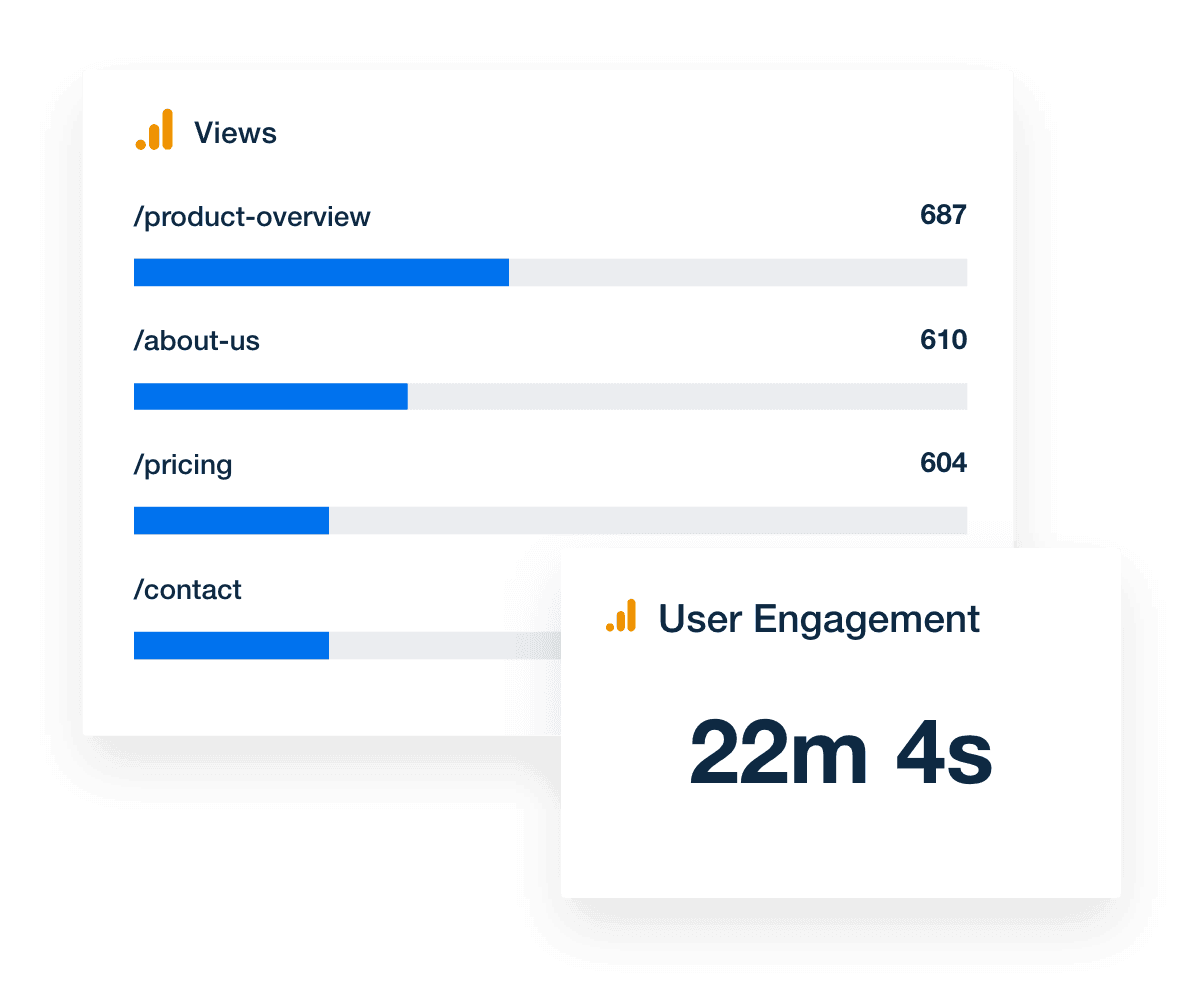
Metrics can be attached to almost every part of a client’s standard business processes. But one key difference between a KPI and a metric is that performance metrics don’t need to be tied directly to a strategic objective.
Some examples of metrics that clients often want to see include:
Website sessions (including specific landing pages and blog posts, often tracked using Google Analytics 4)
Goal conversion rates (sales, form submissions, downloads, etc.)
Engagement with content (video views, comments, impressions, etc.)
Social media followers
PPC conversion rates
However, since anything that can be measured can be considered a metric, these metrics examples are only the tip of the iceberg. There are countless metrics that businesses keep track of, from website traffic to conversion rates, to Facebook shares, and the list goes on.
In theory, that sounds great. The more data, the better, right? In practice, though, this overwhelming amount of data overload often becomes a distraction.
It’s easy to get so caught up in improving various metrics that you forget to ask yourself whether the changes will really affect your client’s bottom line. After all, is getting more likes on social media really that important?
If those likes aren’t converting to sales, then probably not. However, if one of the main goals for the quarter is to increase your client’s presence on certain social channels, it may be.
Most people use statistics like a drunk man uses a lamppost; more for support than illumination.
Andrew Lang
That’s why you need to identify which metrics are Key Performance Indicators so that you can prioritize them. And they will not be the same for every client or quarter.
How KPIs and Metrics Work Together
Many agencies make the common mistake of not setting any KPIs at all and focusing solely on metrics.
Strategic KPIs, especially in finance, help in evaluating financial health and management by focusing on metrics that drive profitability and assess operational efficiency. But without specific goals to aim for, it’s difficult to know whether or not your agency is driving improvements that directly affect the client’s bottom line.
To track and improve your clients’ campaign performance effectively, you must align their KPIs and marketing metrics to ensure that both work together to improve their business.
Another common mistake is using the wrong metric to measure a KPI. Always ensure the metrics feed into the KPI.
For example, if you’re trying to increase customer satisfaction, you might use customer reviews or NPS ratings as a metric and customer retention rate as a KPI. And if you’re trying to increase your client’s revenue, you might use marketing-qualified leads as a metric, and sales-qualified leads as a sales team KPI.
However, Facebook post Likes on that funny meme are very unlikely to directly help support retention rate or client, so they would not be the right metric to align with either of those KPIs.
In short, aligning KPIs and related metrics is the key to charting an effective path towards the attainment of client goals.
Benefits of Combining Metrics and KPIs
Metrics | Key Performance Indicators (KPIs) |
|---|---|
Provide granular insights into the performance of particular campaigns, ad groups, ads, and keywords, as well as other tactics and activities, and helps track progress over time. | Determine when and where your client should allocate resources and how to improve sales, conversion rates, website visitors, customer lifetime value (CLV), etc. |
Helps campaign managers identify areas where they need to make changes to improve results through optimization. | Keep agencies and clients aligned on achieving specific goals. Although a single keyword may drop in ranking, if total organic traffic and conversions is exceeding target, your KPIs are aligned to the client’s needs. |
Useful to compare a client’s campaign performance against competitors, such as keyword ranking positions, CPCs, etc. | Evaluate where your client stacks up against competitors overall, not just on a campaign basis. |
Broader metrics help identify which KPIs are most important to the client’s success and how they connect to each other. | Provide a framework for setting targets, budgets, and measuring progress over time. |
When To Use KPIs vs. Metrics
There is no one-size-fits-all answer to this question, as the answer will vary depending on the client’s business and their specific situation. However, KPIs like net profit margin are essential for assessing a company's financial health and profitability. A few general guidelines help make the decision clearer:
1. Is the Client Looking For Overall Trends or Specific Details for Their Business?
KPIs may be more appropriate if the client is looking for general trends. If they’re looking for specific details, important metrics may be more appropriate.
For example, if your agency is trying to optimize a Google search ad campaign, the average cost per sale could be considered a KPI. However, if the client just launched a new blog post and wants to know how well they are ranking for a single keyword targeting a single page, that is more likely to fall under the metric umbrella.
2. How Complex Is the Data?
If the data is complex, then metrics may be more appropriate. KPIs can be used for complex data but must be simplified to be effective.
For example, the overall SEO site health score of a client’s website would be an SEO KPI worth tracking, and the number of critical issues, errors, or warnings would be the metrics.
3. How Much Time and Effort Is the Client Willing To Contribute?
Is this client a data-driven thinker who loves digging into their marketing data every month? Or are they a high-level visionary who hates getting bogged down in details?
Metrics are quantitative measurements that track the results of marketing campaigns and activities, which means that all metrics should eventually feed into a KPI. Therefore the big picture thinker may prefer KPIs while the granular thinker may be interested to dive into the metrics.
Best Practices for Identifying & Monitoring KPIs and Metrics
As an agency owner, you want to help your clients’ businesses grow, and retain those clients for the long run. The marketing team, alongside other departments, uses KPIs and metrics to measure their impact and achieve strategic goals. To do this, identifying and monitoring their KPIs and metrics is essential to improve campaign performance.
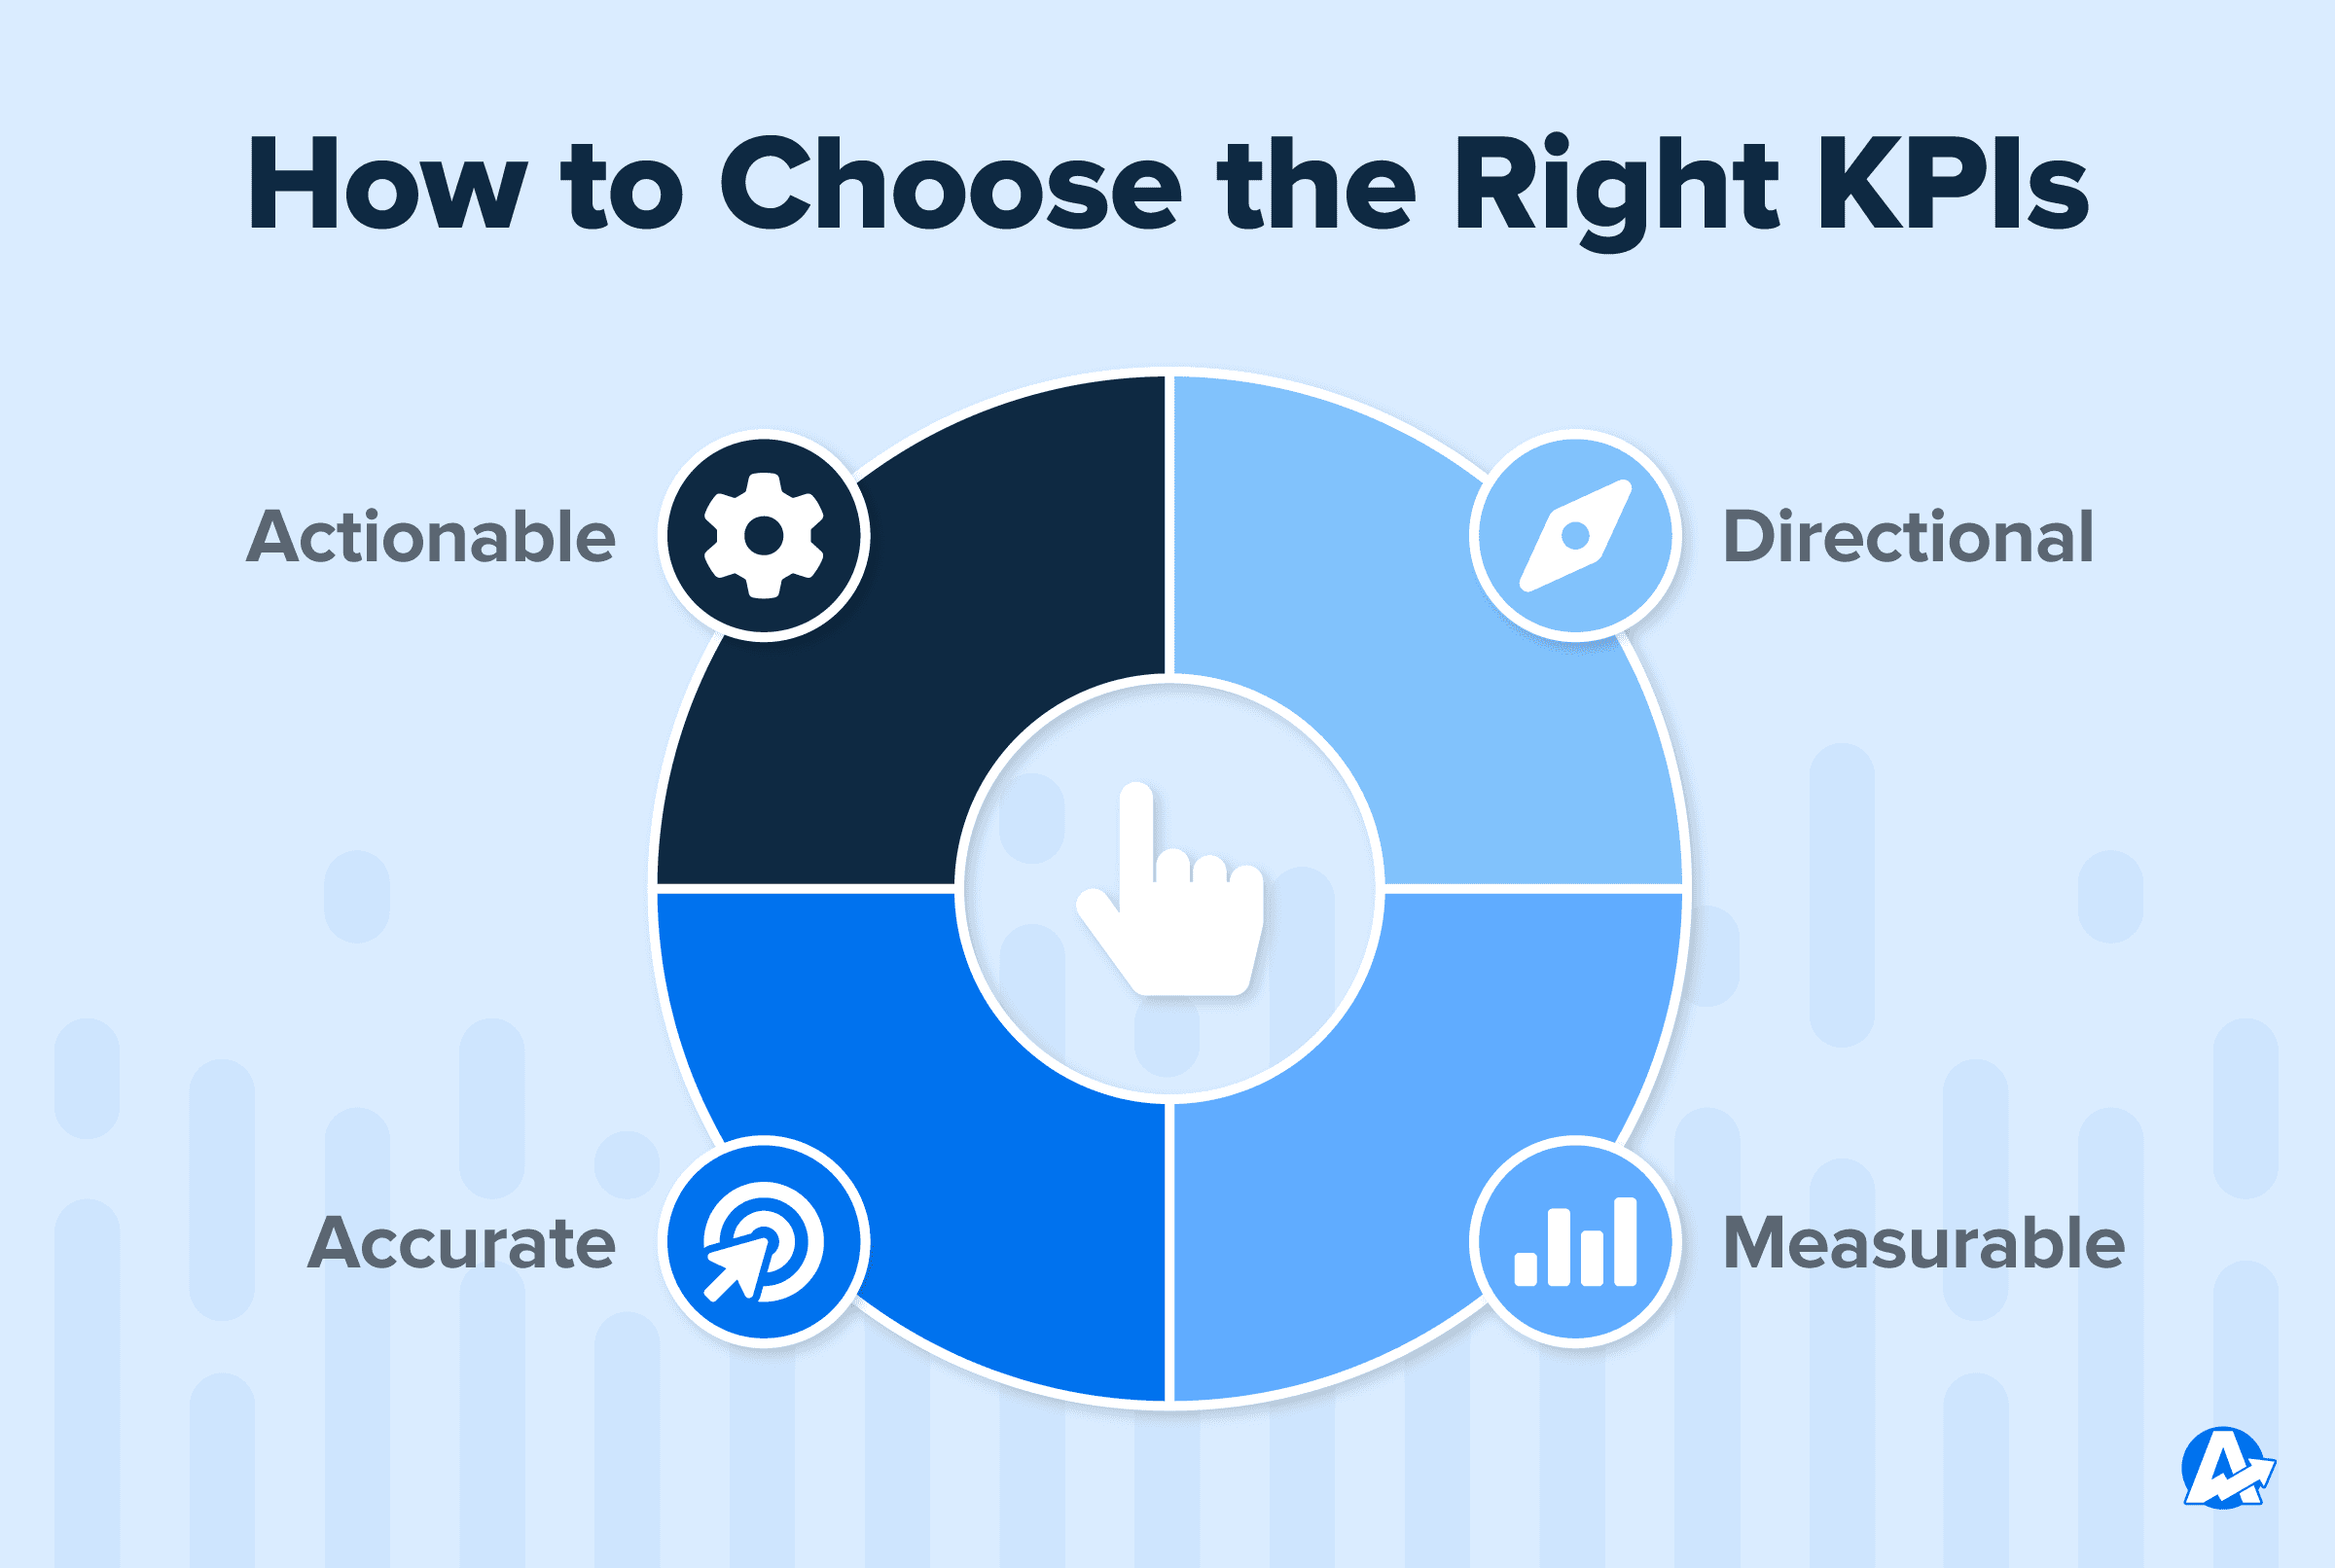
We’ve made a list of 5 best practices your agency should follow when identifying and monitoring your clients’ KPIs and metrics.
1. Choose Directional Metrics
Not all KPIs are created equal. Choosing the right metrics helps ensure your clients’ goals remain manageable and achievable.
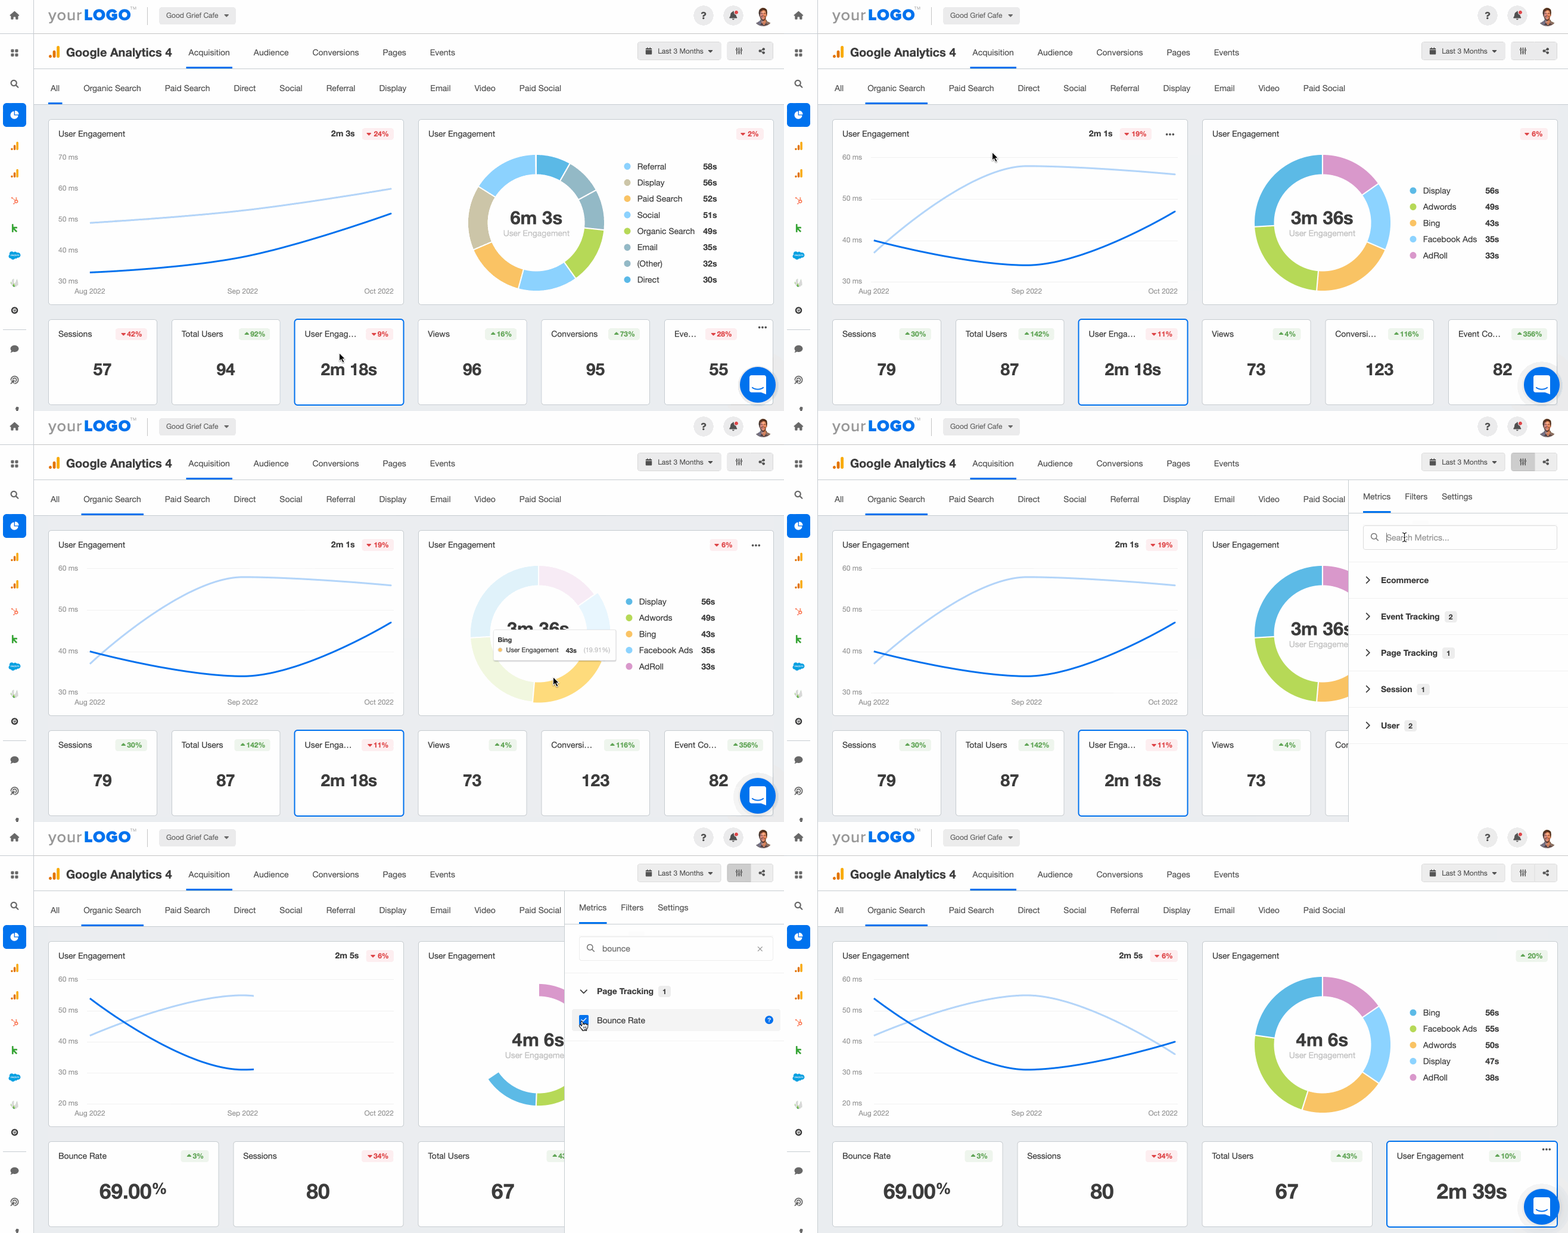
Show your clients how your agency is tracking against goals with a KPI and metrics report. Automate the entire process to save your agency's time each month. Try AgencyAnalytics free for 14 days!
One important factor to consider when choosing KPIs is what stage of development your client’s business is in. If they’re relatively new to market, for example, they should focus on growth metrics such as revenue or user adoption rates. On the other hand, established businesses may want to track profitability or market share.
Another key consideration is the type of business your client has. If they’re in the service industry, they probably want to focus on customer satisfaction or Net Promoter Score. Or, if they have a manufacturing business, they’ll want to track inventory turnover or return on assets.
Consider what services your client needs from your agency. For example, if their focus is building up blog content on their website, some great KPIs to focus on would be blog post views, website sessions, referrals from Google search results, or maybe keywords they’re ranking for.
Ask your clients what data they want to see. Often this is related to their KPIs. But also don't just leave it at the report going out. Talk the client through the report as the more you talk to them the more you get to know them and identify other opportunities.
Paul Morris, Managing Director of Superb Digital
On the other hand, if your client is focusing on social media this quarter, follower growth may be a good measure of whether their activity is working or not. But you’ll also need to monitor engagement and clicks to show your client what content is actually resonating with their audience.
2. Ensure KPIs Are Measurable
To measure the success of your client’s business, the KPIs you track should be measurable. Although it sounds simple, if you’re not measuring something, how can it be improved or adjusted?
Some common measurable KPIs include revenue, profit, customer satisfaction, and employee satisfaction. Make sure that the KPIs your client chooses are relevant to their business, your agency can realistically impact them, and can be clearly tracked.
3. Accurately Track KPIs and Metrics
To help your clients make informed business decisions, it’s crucial to use accurate data. This means ensuring that their KPIs and metrics are reliable. Unfortunately, there are many ways to manipulate data to present a false picture of success.
One way to ensure the accuracy of your clients’ data is to present it in a professional client report or marketing dashboard. This eliminates the risk of error inherent in manual reporting, while bringing the data to life in a visually appealing format.
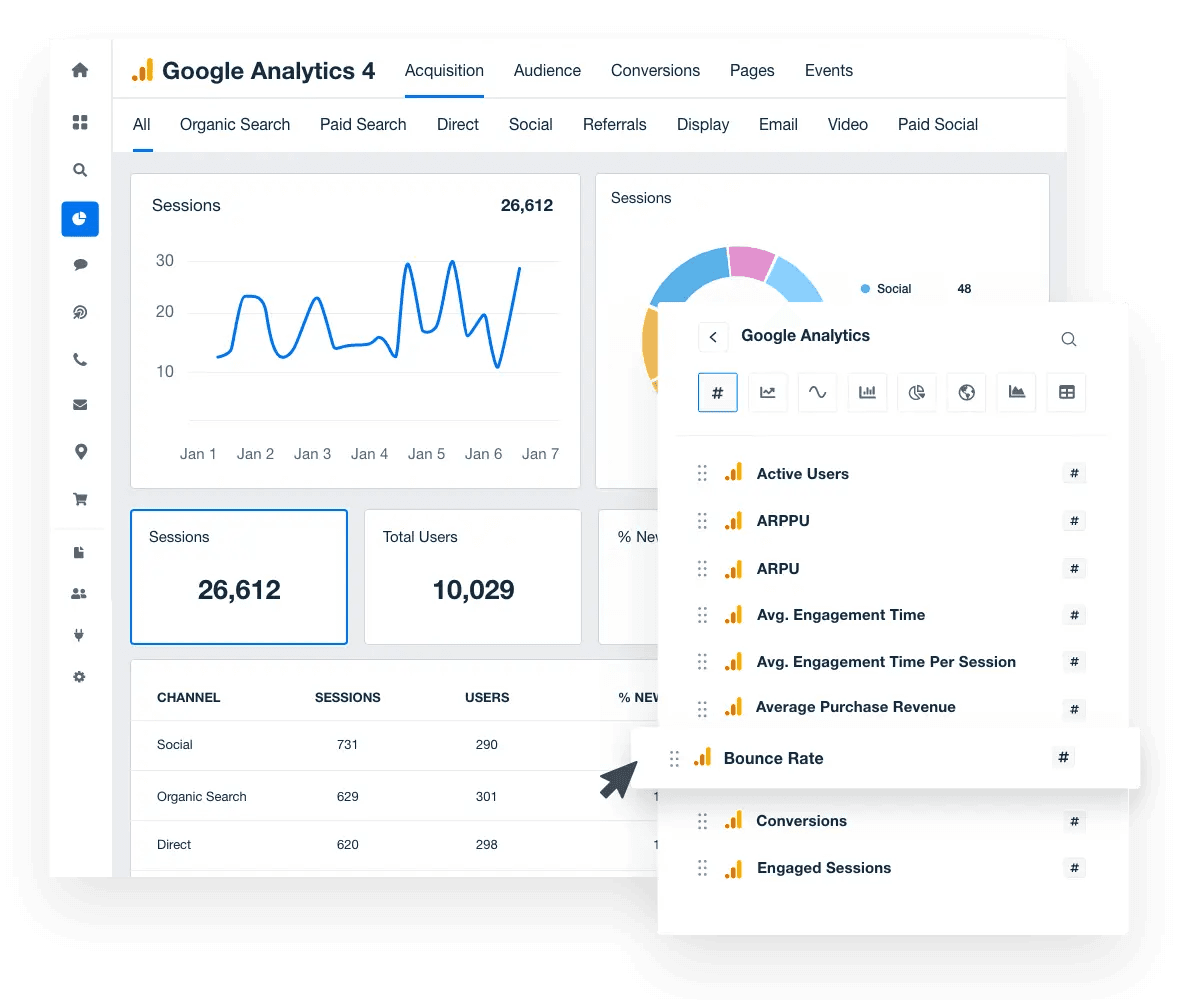
Ditch the screenshots, PowerPoints, and other time-consuming client reporting processes. Create clean, white-labeled reports in minutes that showcase your agency’s professionalism. Start your free 14-day trial with AgencyAnalytics today.
Another way to ensure accuracy is to perform regular audits of client data. Compare actual results against targets or goals that you’ve set for them. Identify any discrepancies and investigate the causes.
4. Understand Leading vs. Lagging Indicators
Navigating the labyrinth of marketing KPIs requires a strong understanding of leading and lagging indicators. Let's break these concepts down.
What are Leading Indicators?
Leading indicators are real-time, quantifiable measures that provide insights into future events. For example, when a new content strategy causes an increase in website visits, these are leading indicators. They suggest a possible rise in future sales.
Leading KPIs, part of leading indicators, directly connect to key objectives. They're important for understanding the steps towards achieving a main goal.
What are Lagging Indicators?
Lagging indicators, on the other hand, are retrospective. They measure the outcomes of a project or campaign, showing its success or failure. For instance, after a content strategy has been running for a few months, changes in sales are your lagging indicators. Similar to lagging indicators, lagging KPIs track a strategy's performance.
Leading and lagging indicators offer valuable insights into a marketing strategy's journey. The former offers a prediction of future performance, while the latter delivers a reflection of past outcomes. The key to successful marketing lies in balancing the insights from both types of indicators.
5. Provide Actionable Data
The best way to show agency value is to go beyond the metrics. Show your clients how their marketing data affects their bottom line and make useful recommendations to make decisions and improve operations. Without this level of analysis, they’re likely to get bogged down in data points that are not beneficial to them.
When your agency reports on metrics and KPIs, explain the significance of the results, and present solutions for any concerns that the data has surfaced. This will reassure your clients that your agency is consistently and proactively seeking positive results, and is willing to pivot to achieve them when necessary.

How Raincross Turned Metrics into Money
Raincross, a California-based digital marketing agency, has been serving clients nationwide since 2013. With a team of nine, they specialize in combining data analytics with customer personas to build successful marketing campaigns. They cater to various industries, from real estate and law to government and healthcare.
Problem: Reporting Challenges
Raincross faced a time-consuming dilemma. The agency spent hours compiling KPIs and metrics into spreadsheets and PDF files for client meetings that would often last only 15-30 minutes. This manual, time-consuming process was not only eating away at their efficiency but also impacting their professional image.
Solution: Overhauling Their Client Reporting Process
To resolve this, Raincross chose AgencyAnalytics as their go-to platform for streamlined client reporting. Now, instead of stitching data from multiple metrics from various sources together, they could easily and quickly generate comprehensive reports. They also explored new strategies by utilizing the 80+ integrations available on AgencyAnalytics to further boost their client campaigns.
Outcome: Improved Client Relationships and Agency Growth
The decision to switch to AgencyAnalytics paid off in multiple ways. Raincross could now respond to client requests for custom reports in as little as ten minutes, freeing up time for strategic initiatives and deepening client relationships. But the benefits didn't stop at client satisfaction. Employees, no longer burdened by tedious report preparation, found better work-life balance.
Lessons: Takeaways For Other Agencies
The Raincross experience underscores the transformative impact of efficient reporting. The right tools will not only optimize your reporting process but also contribute to both client satisfaction and employee well-being. Agencies looking to scale should view reporting not as a chore, but as an opportunity to provide clear, quick insights that keep clients engaged and staff happy.
Efficiently Tracking Your Clients’ Metrics and KPIs
There are a variety of online tools that help you track your clients’ progress. Using these tools gives your agency a better understanding of a client’s campaign performance and where to make improvements to their overall marketing strategies.
1. Managing Metrics and KPIs With a Dashboard
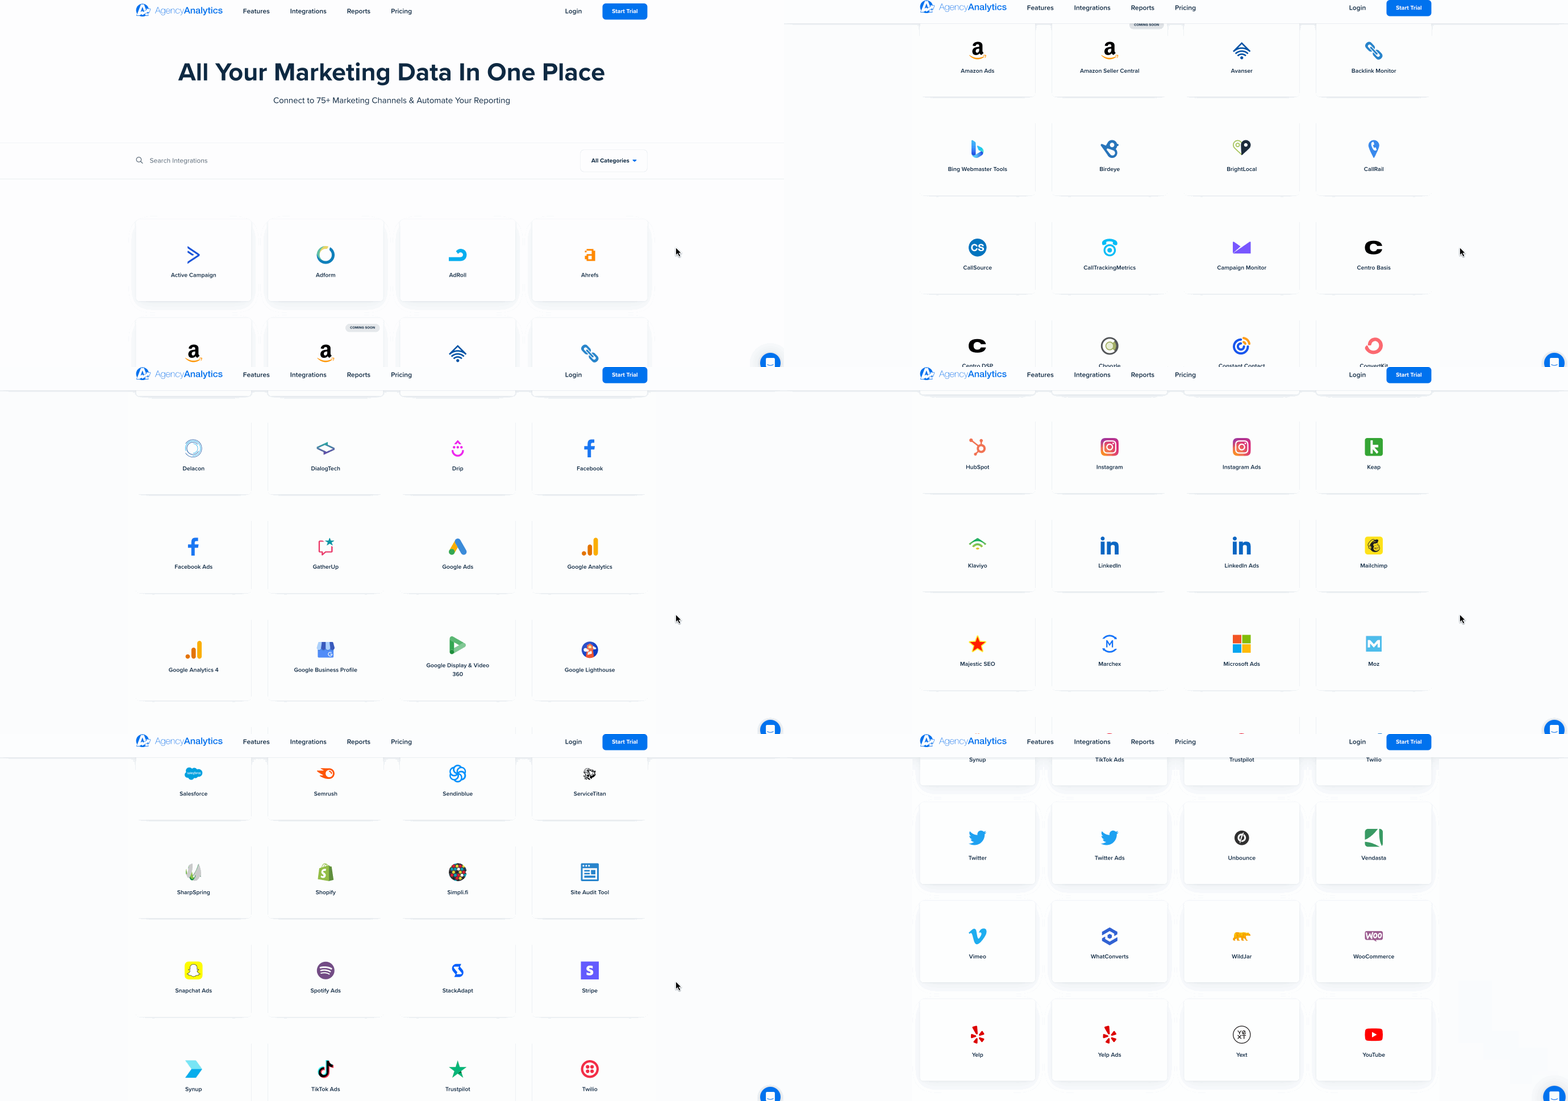
After determining what metrics and KPIs matter most to your clients, you’ll need to integrate their marketing platforms into a dashboard.
AgencyAnalytics excels in presenting key performance indicators (KPIs) from various departments, allowing clients to conveniently monitor and track their progress from a single, unified dashboard. With its comprehensive features and user-friendly interface, AgencyAnalytics delivers a seamless and powerful data experience for our clients.
Alexa Rees, SEO Manager of seoplus+
AgencyAnalytics has 80+ marketing integrations to choose from at no additional cost.
Depending on what platforms your clients are currently using, dashboards will vary from client to client. However, we recommend covering the basics–PPC, SEO, social media, email, and call tracking.
2. Use Goals and Annotations
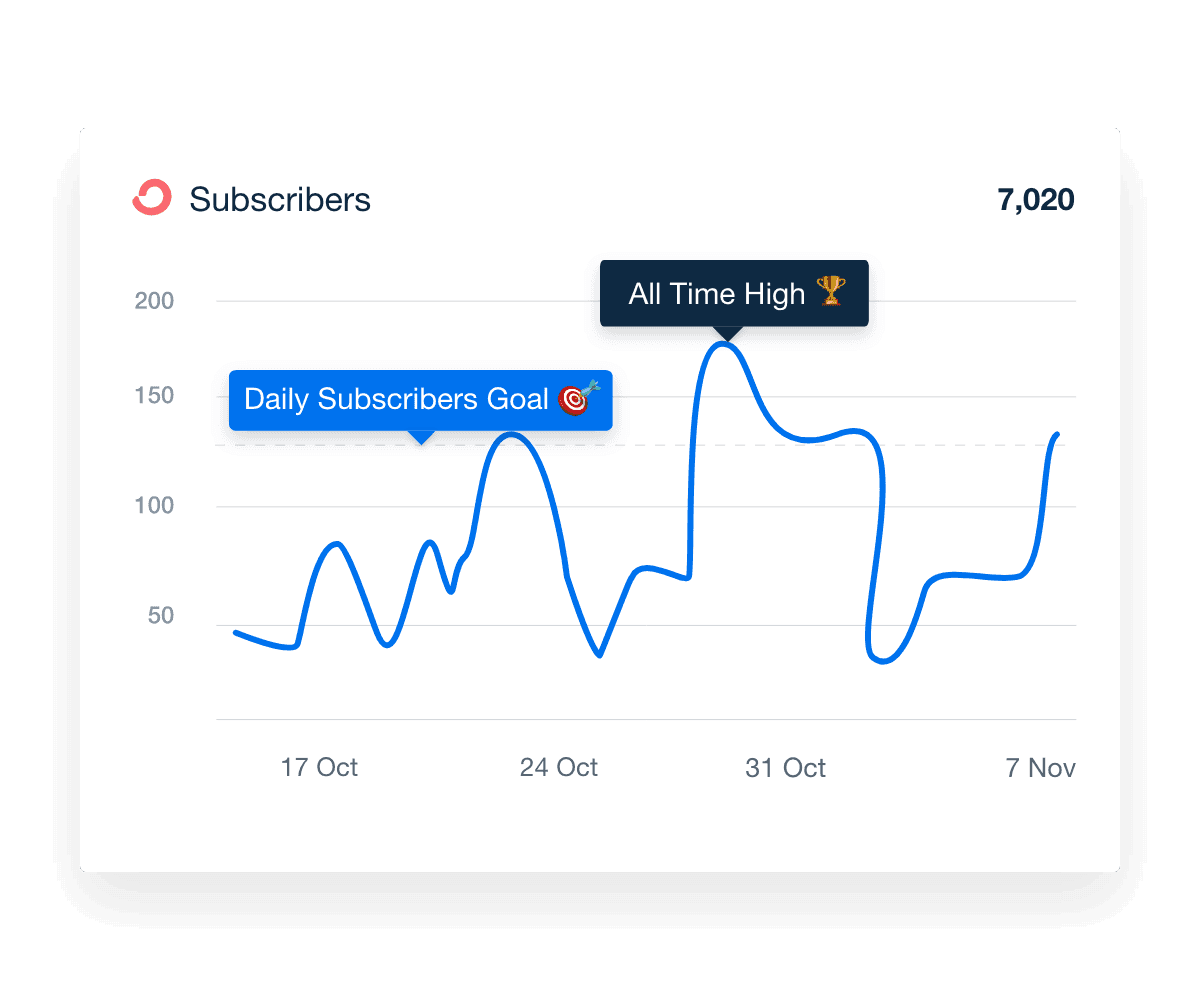
The next step is analyzing their data and identifying which trends or patterns stand out. Creating annotations and goals is a great way to highlight your agency’s progress toward achieving your clients’ KPIs, and explain any key trends you’ve discovered.
The KPIs our clients care about are leads, revenue generated, and Cost Per Acquisition. Their marketing dollars need to translate to top-line revenue, and so it's our job to help our clients connect the dots to that in our reporting.
Lane Rizzardini, Co-owner of Marion Relationship Marketing
3. Create a Report Schedule
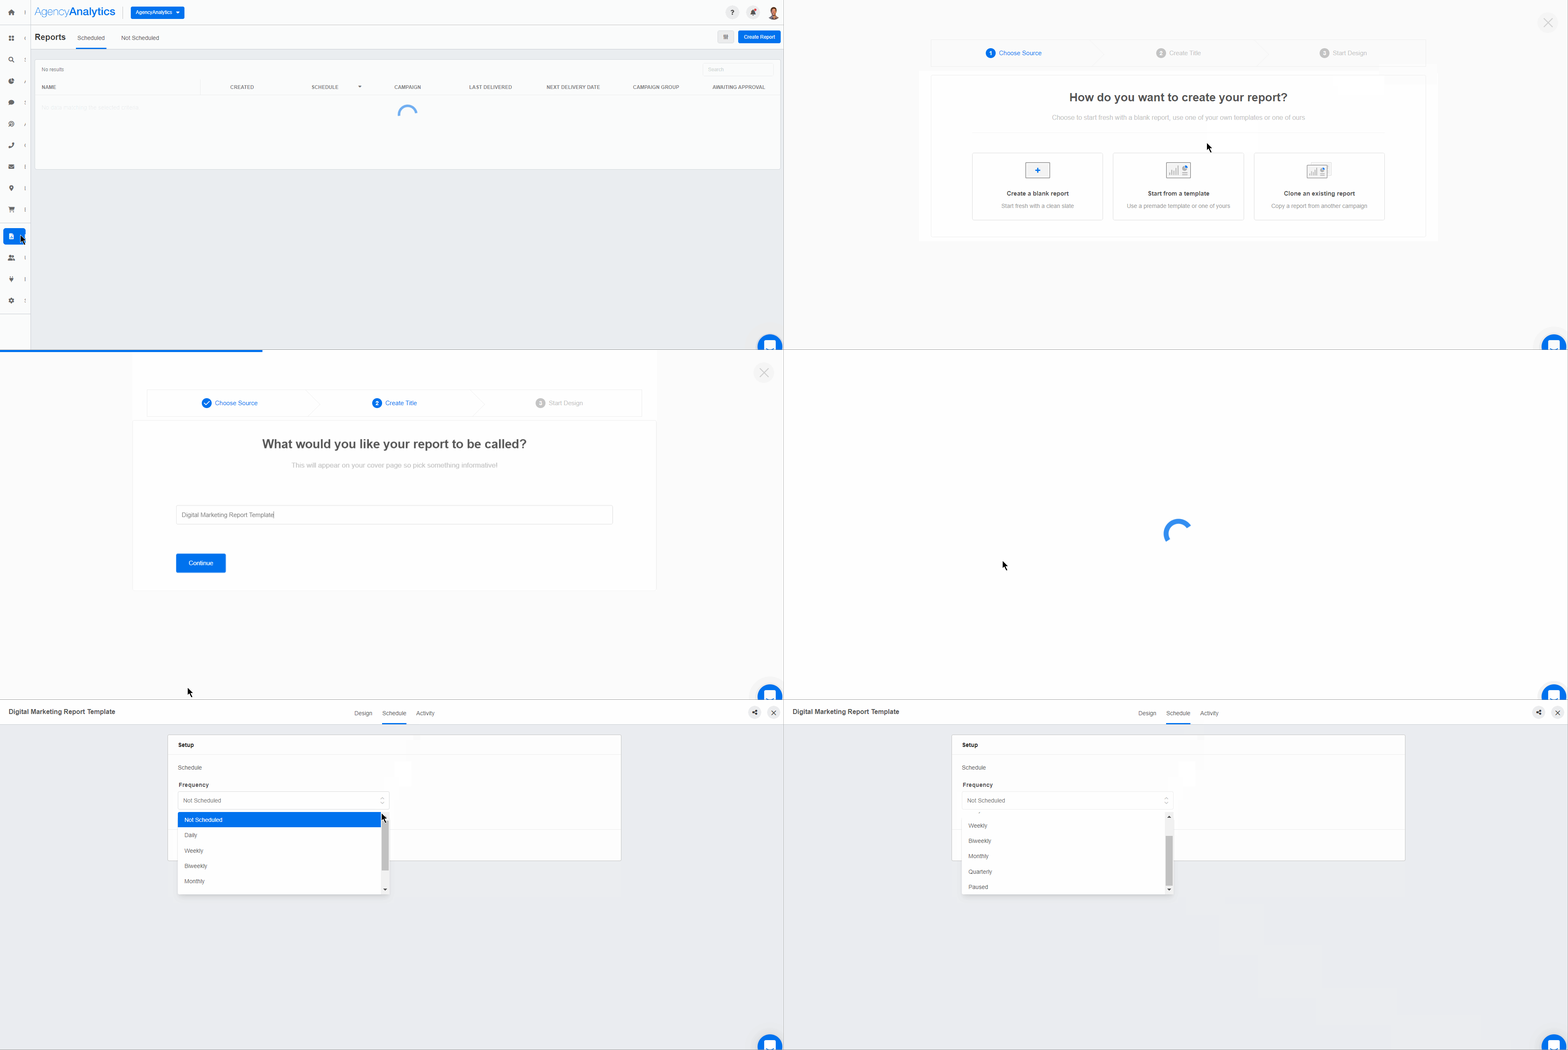
A great way to maintain constant and transparent communication with your clients is to regularly review their KPIs and metrics. Save your agency’s time by setting up an automated reporting schedule.
AgencyAnalytics is one of the most essential tools we use as an agency. Not only do we use it daily with our internal team to check specific KPIs we are tracking through various dashboards, but it has also saved us countless hours with our monthly reporting.
Brian Ferritto, Partner at 42connect
Instead of wasting billable hours creating manual client reports every month, speed up your agency’s data retrieval and reporting workflow with the report scheduling feature. Choose to send out reports on a daily, weekly, or monthly basis and get notified before they’re sent out to make final comments, adjustments, or approvals.
See how 7,000+ marketing agencies help clients win
Free 14-day trial. No credit card required.

