NOW AVAILABLE: Unlock Data-Driven Insights with AI, Benchmarks, Anomaly Detection & Forecasting
DashboardsInstagram Ads

Instagram Ads Dashboard

Discover the power of a live Instagram Ads dashboard. Pinpoint optimization opportunities, enhance efficiency, and drive better outcomes. Offer clients real-time access to their ad performance, ensuring full data transparency. Maximize campaign ROI and build stronger agency-client relationships along the way.
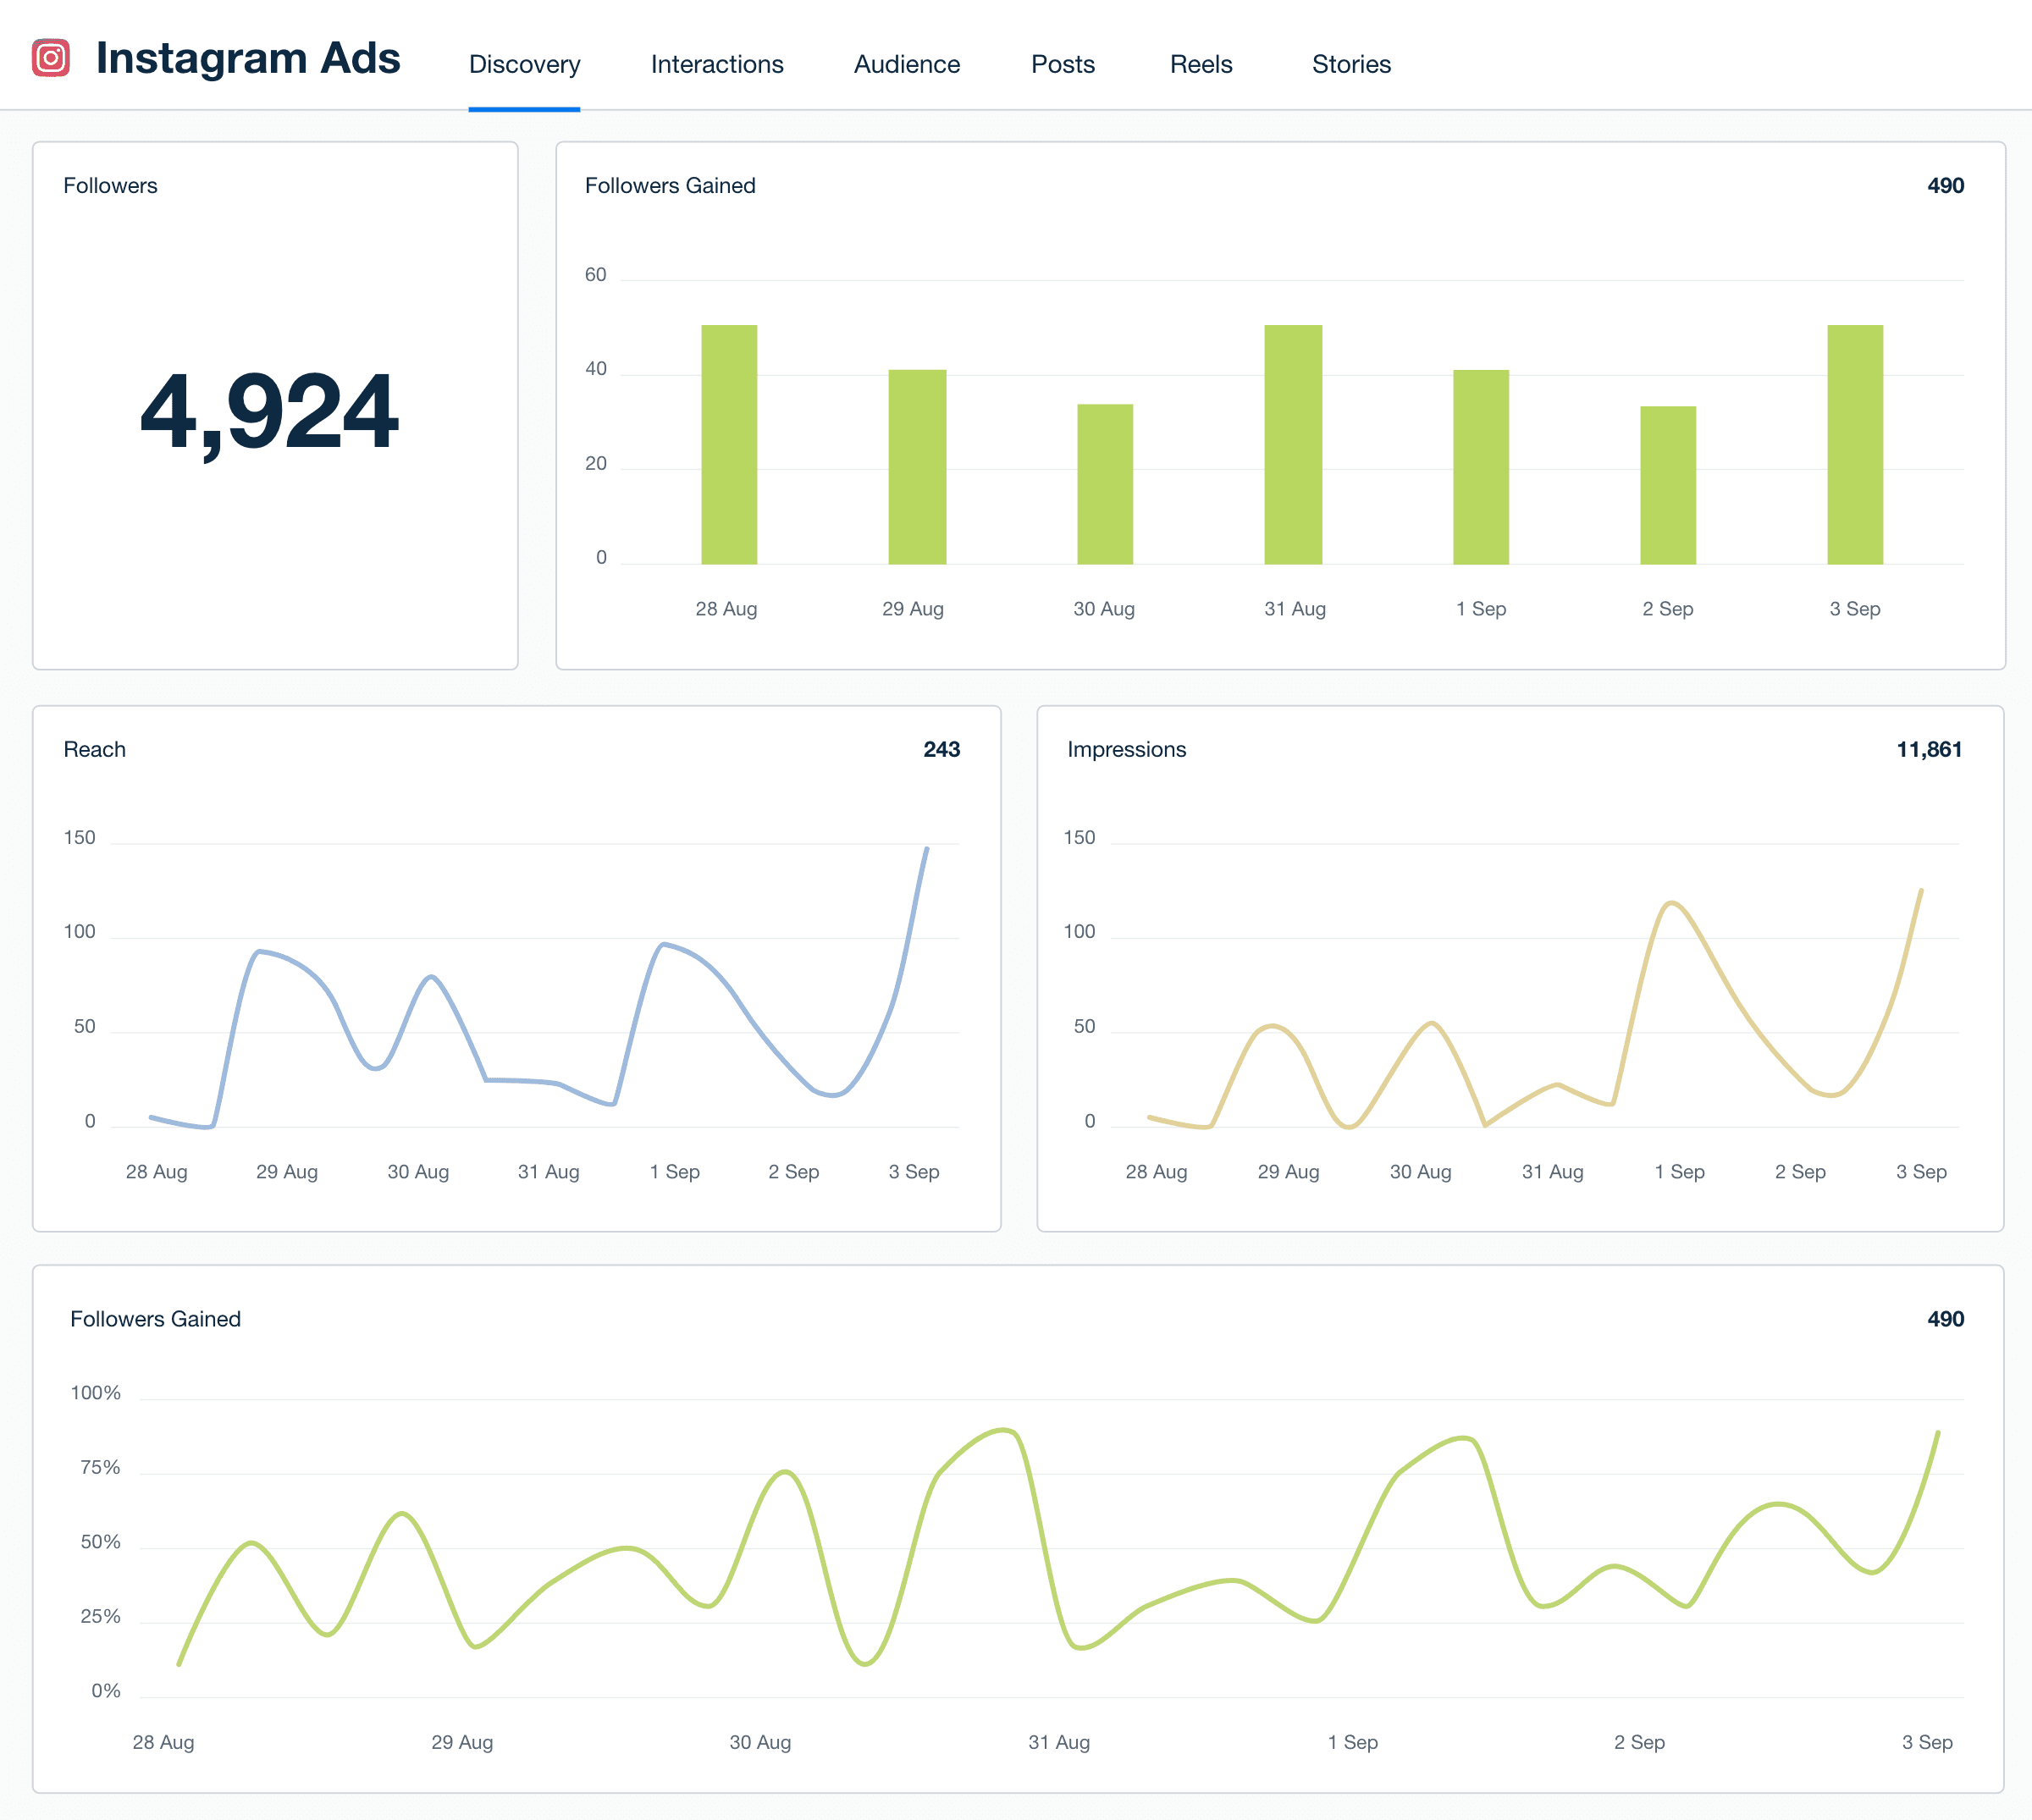
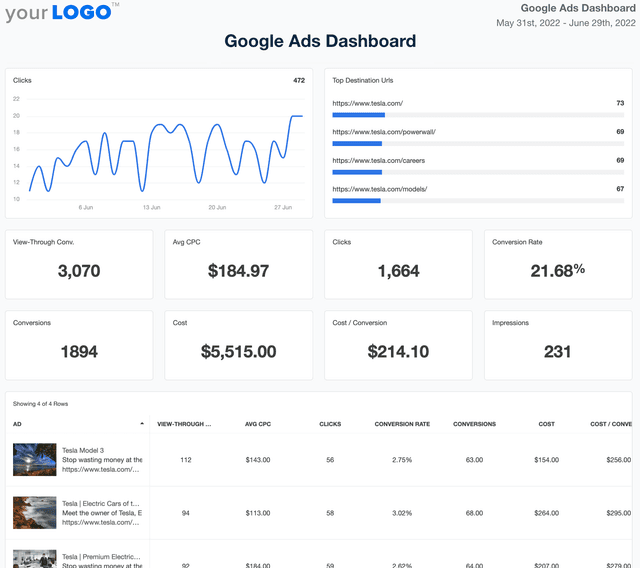
Instagram Ads Dashboard Template Example

What Is an Instagram Ads Dashboard?

An Instagram Ads dashboard is a tailored reporting tool that allows agencies to track and showcase ad metrics. With the white label feature, it’s easy to connect Instagram ads reporting to your agency's brand identity and go beyond data presentation. Deliver a polished finish, all while showing your commitment to performance and aesthetics.

Bonus: Remember that Instagram Ads belongs to the Meta ecosystem. So, instead of manually compiling metrics from the back end of Meta Ads Manager (aka the Facebook Ads Manager), this automated tool does the heavy lifting for you.

Effortlessly consolidate insights like Impressions, Conversions, and Engagement Rate, all in one place. If your client is running related marketing efforts across other Meta platforms, customize this dashboard to view these insights side-by-side. 

Is your agency looking to streamline your Instagram Ads client reporting? This dashboard removes the grunt of manual data collection. It automatically retrieves Instagram Ads metrics, streaming them into a visual format that both your agency and clients will easily grasp.

Why Your Agency Needs an Instagram Ads Dashboard

Why settle for a one-size-fits-all reporting approach? Instead, customize your dashboard as needed. Add annotations, create custom goals, or rearrange widgets; it all depends on your preferences. 

To keep data transparency on the table, consider granting clients access to their live dashboards. That way, they’ll have the autonomy to check in on ad performance whenever they choose.

It isn’t about overwhelming clients with data, though–set user permissions to decide precisely what’s shared. That way, they won’t be bogged down by vanity metrics or irrelevant data. Experiment with data visualizations, showcase trends, and make informed recommendations, all in a few clicks.

An Instagram Ads reporting system is more than a pretty interface. It’s a way to track real-time data, keep clients in the loop, and solidify your agency’s value proposition. 

Create Professional Instagram Ads Dashboards in Minutes
Start Your 14-Day Free Trial

8 Sections To Include in an Instagram Ads Dashboard

An effective Instagram Ads dashboard is a powerful tool for bringing data to life. By including these key sections, you’ll be better positioned to share clear insights and ensure clients understand their metrics. 
1. Impressions

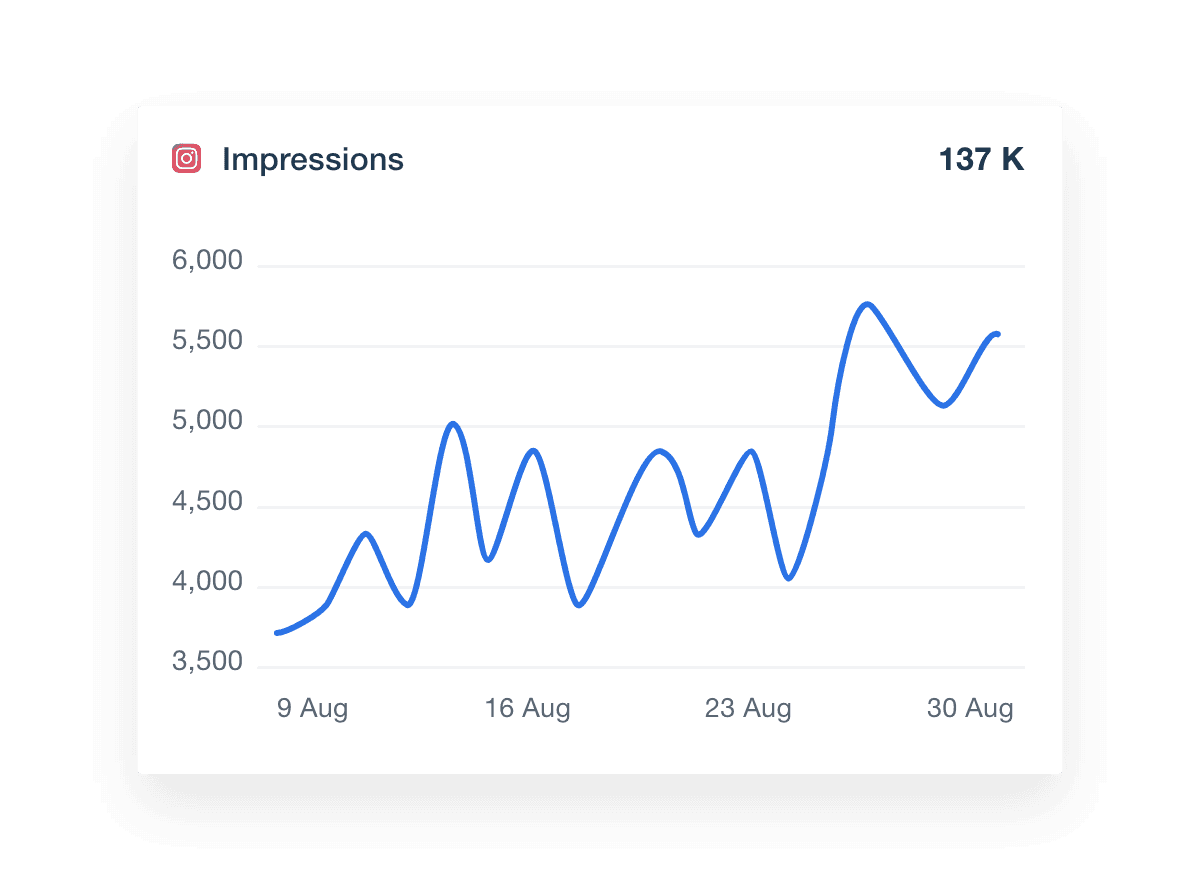
Impressions count the number of times a client’s Instagram Ad is displayed to users, regardless of whether they engage with it. Essentially, it’s a metric that gauges visibility and overall reach.

Instagram Ads dashboard impressions metrics visualization

For example, a high number of impressions on feed ads means the client's ad is being seen frequently, which indicates substantial reach and visibility. However, if impressions are low, it could mean that ad spend is too low or that broader targeting is required. 

2. Engagement Rate

Typically expressed as a percentage in marketing reports, engagement rate measures how often users interact with your client’s Instagram Ad. This includes actions like likes, comments, and reactions to Instagram stories. Highlighting this metric showcases your agency’s expertise in driving interactions and sparking curiosity.

Engagement rate dashboard widget

A high engagement rate indicates that your client’s ad resonates with their target audience in some way. Conversely, a low engagement rate may suggest that improvements are needed (e.g., ensuring there’s not too much text in a single image).

3. Click-Through Rate (CTR)

Click-through rate (CTR) measures the percentage of users who click on an Instagram Ad after seeing it. It’s also helpful to monitor which Meta platform drives the most engagement, which could be used to refine your client’s overall advertising strategy. 

instagram ads reporting compared to other platforms example

A high CTR indicates that the ad is compelling and relevant to the audience, leading them to take action. Conversely, a low CTR suggests the ad may need to be more interesting and relevant. To fix this, ensure your client’s offer is aligned with the audience’s interests. Also, experiment with different ad placements to see what works best (e.g., Instagram feed vs. Stories).

4. Cost Per Click (CPC)

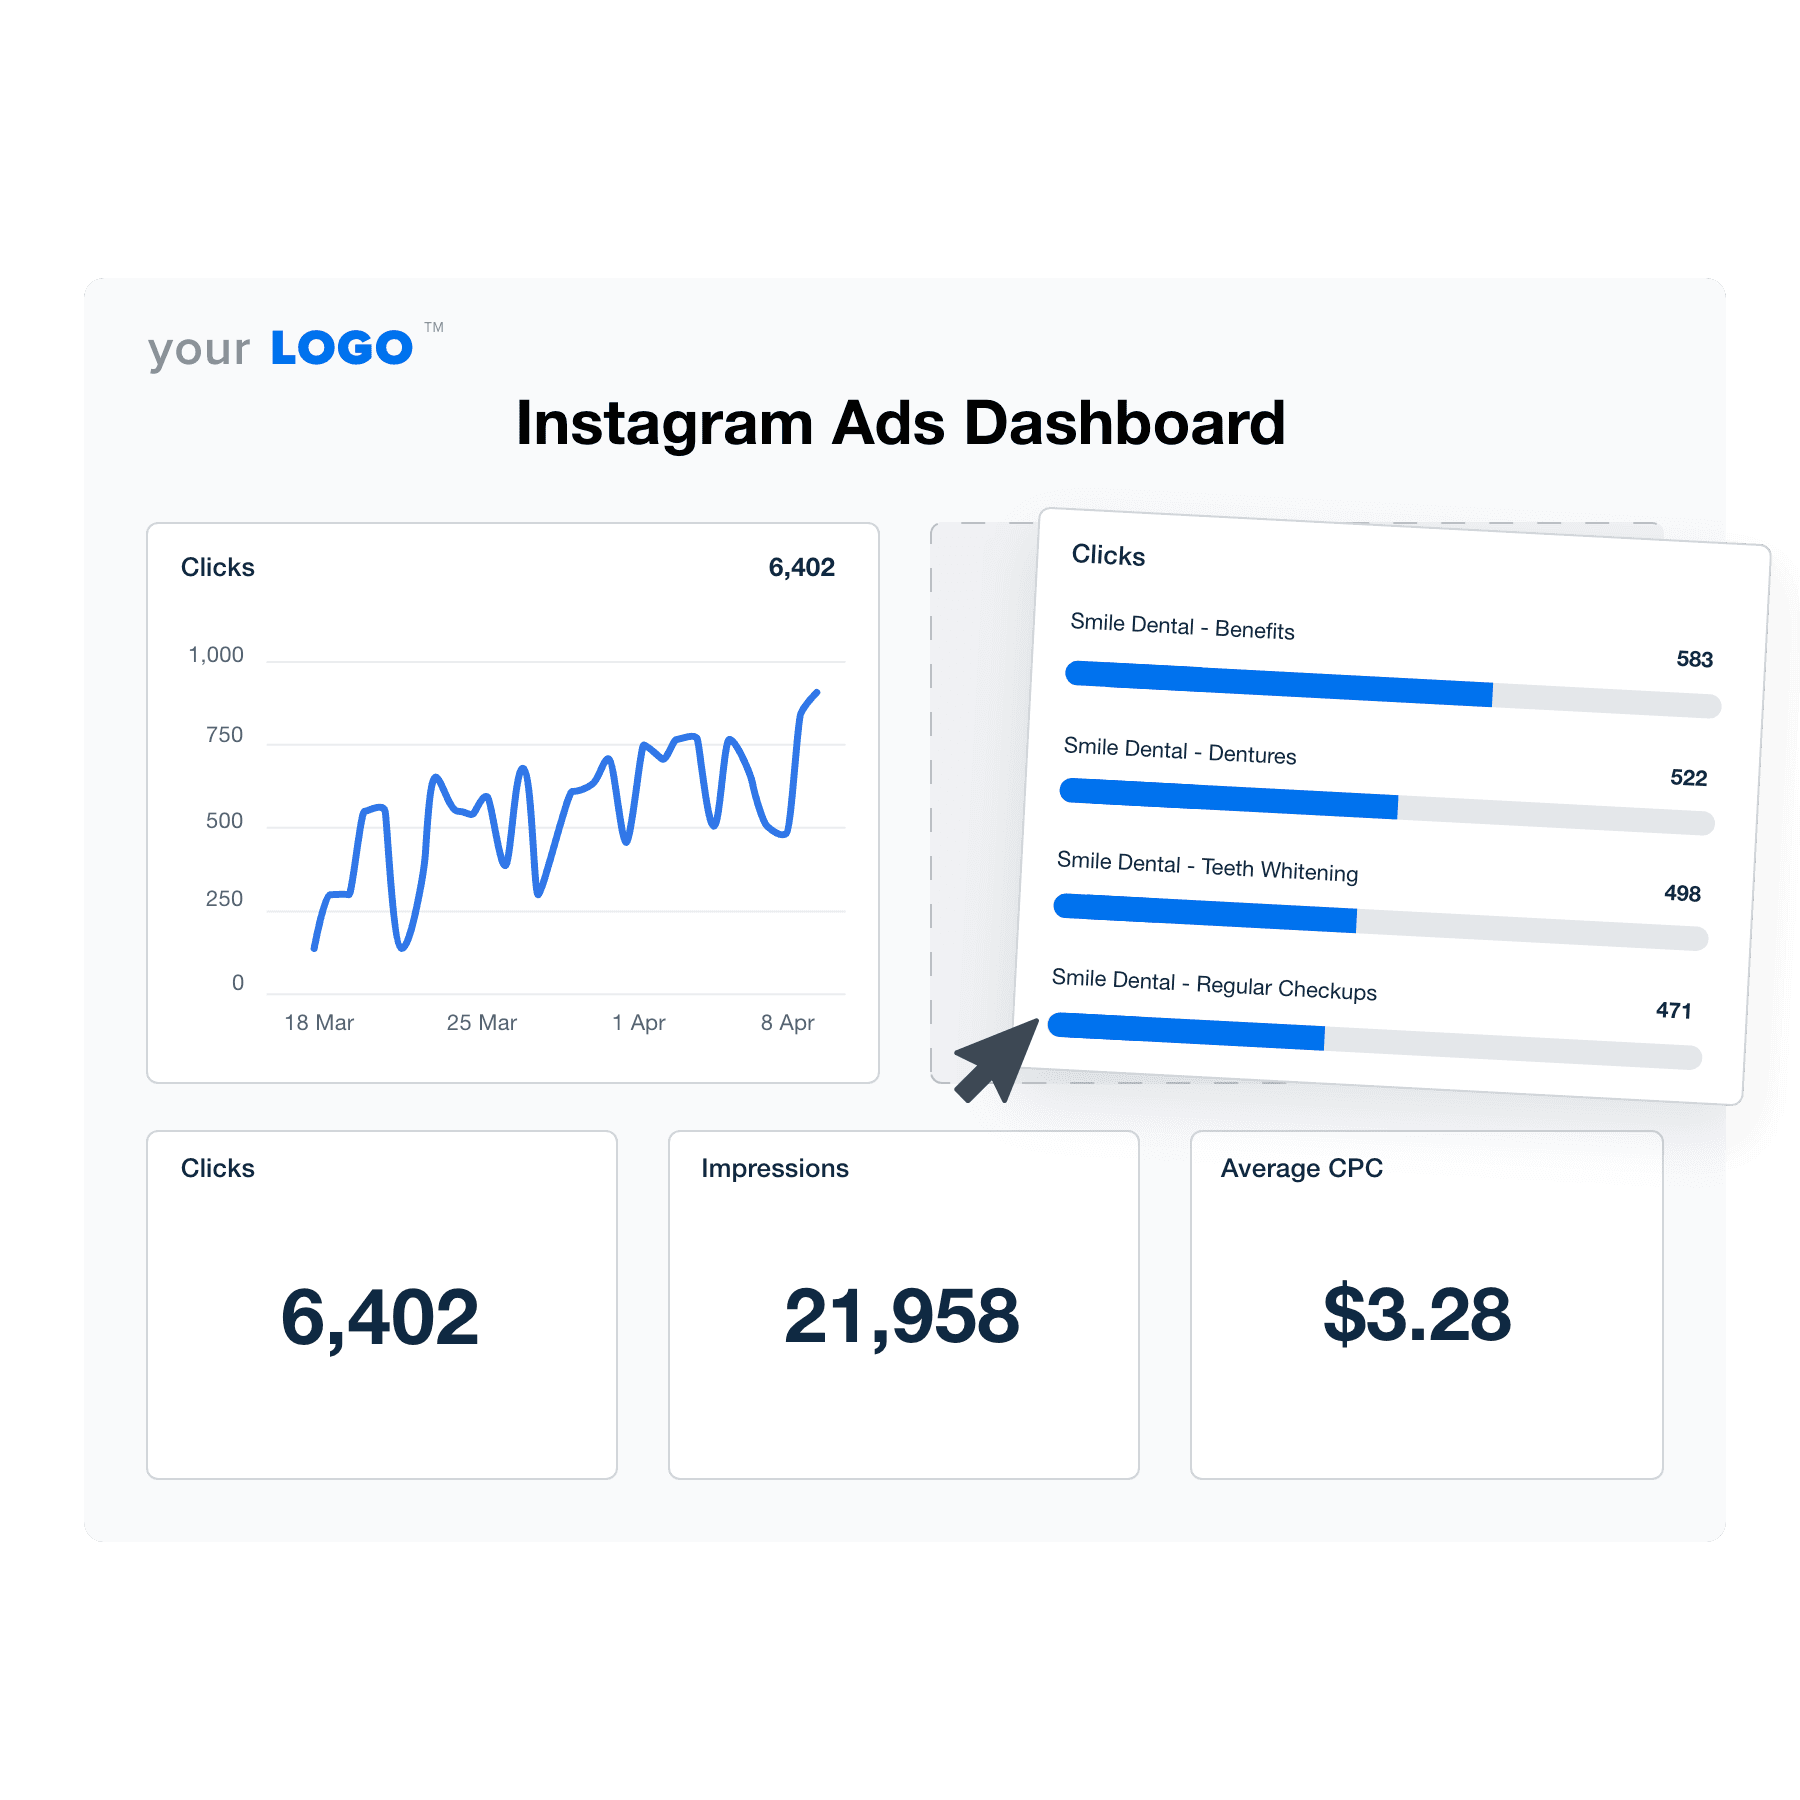
Cost per click (CPC) measures how much your client pays for each click on an Instagram Ad. This metric evaluates cost-effectiveness, providing insight into profitability and campaign ROI.

Instagram Ads dashboard cost per click data visualization

A low CPC indicates that your client’s ad efficiently drives traffic at a lower cost, which is an ideal scenario. On the other hand, a high CPC suggests that more budget is needed to attract clicks. In this scenario, take a look at your client’s Instagram strategy. Consider adjusting their bidding approach, narrowing audience targeting, or using less competitive keywords. 

Automated Client Reports. Ready in 30 Minutes or Less.
Spend Less Time Creating Reports and More Time Delivering Results
Start Your 14-Day Free Trial

5. Add To Cart

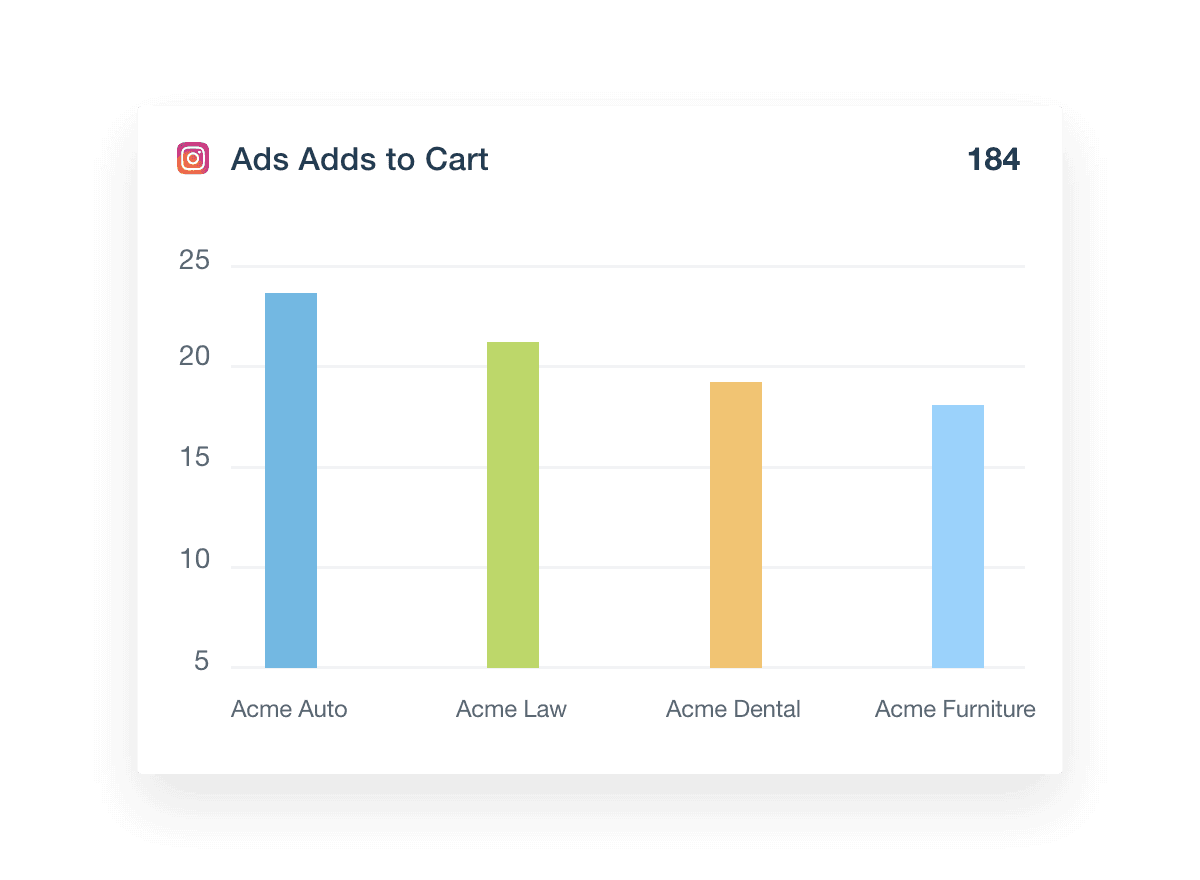
The add to cart metric tracks how often users add items to their shopping cart after engaging with your client’s Instagram Ad. 

Add To Cart Instagram Ads dashboard metrics widget

A high rate indicates strong purchase intent, which is one step further in the conversion funnel. On the other hand, a low number suggests that your client’s offer may not be compelling enough to drive buying decisions. 

Aside from issues with the actual ad, it could be due to pricing, product appeal, or user experience issues. 

6. Conversions

Conversions reflect the number of users who complete a desired action after interacting with your client’s Instagram Ad (e.g., making a purchase or filling out a form).

Instagram Ads dashboard conversion metrics

A high rate suggests that the ad is successfully driving users to take action. If there’s a low number of conversions, there may be barriers preventing users from completing an action (e.g., a lengthy checkout process). Assess the customer journey, address any bottlenecks, and make improvements as necessary.

7. Amount Spent

Amount spent represents the total money invested in an Instagram Ad campaign. Reporting on this metric maintains transparency, showing clients exactly how their funds were allocated. 

Instagram Ads dashboard amount spent metric

It’s also a way to show the correlation between money invested and achieved outcomes. For example, it’s helpful to explain how increased ad spend led to more conversions.

8. Goal Tracking 

Goal tracking is a way to demonstrate progress toward specific objectives (e.g., achieving 1000 ad clicks per quarter). It bridges the gap between raw data and meaningful outcomes, showing how Instagram campaigns are progressing in real-time. 

It also helps clients make informed decisions before the end of the reporting period. For example, they may decide to use another bidding strategy to spend their budget more evenly. Simply put, monitoring goal progress helps clients assess Instagram performance and plan ahead.

Goal tracking data in AgencyAnalytics dashboard

To create impactful Instagram Ad goals, be sure to:

  • Align goals with your client's specific business objectives.

  • Set clear, realistic targets based on historical data and industry benchmarks.

  • Regularly adjust goals to reflect evolving priorities and performance trends.

See the Meta Ads Dashboard Template in Action
Use This Template To Create Custom Dashboards in Minutes
View Template Demo

Customizable Dashboards To Meet Client Needs

Clients have diverse campaigns, business models, and objectives. Therefore, your agency must have a tailored approach to deliver solid value. 

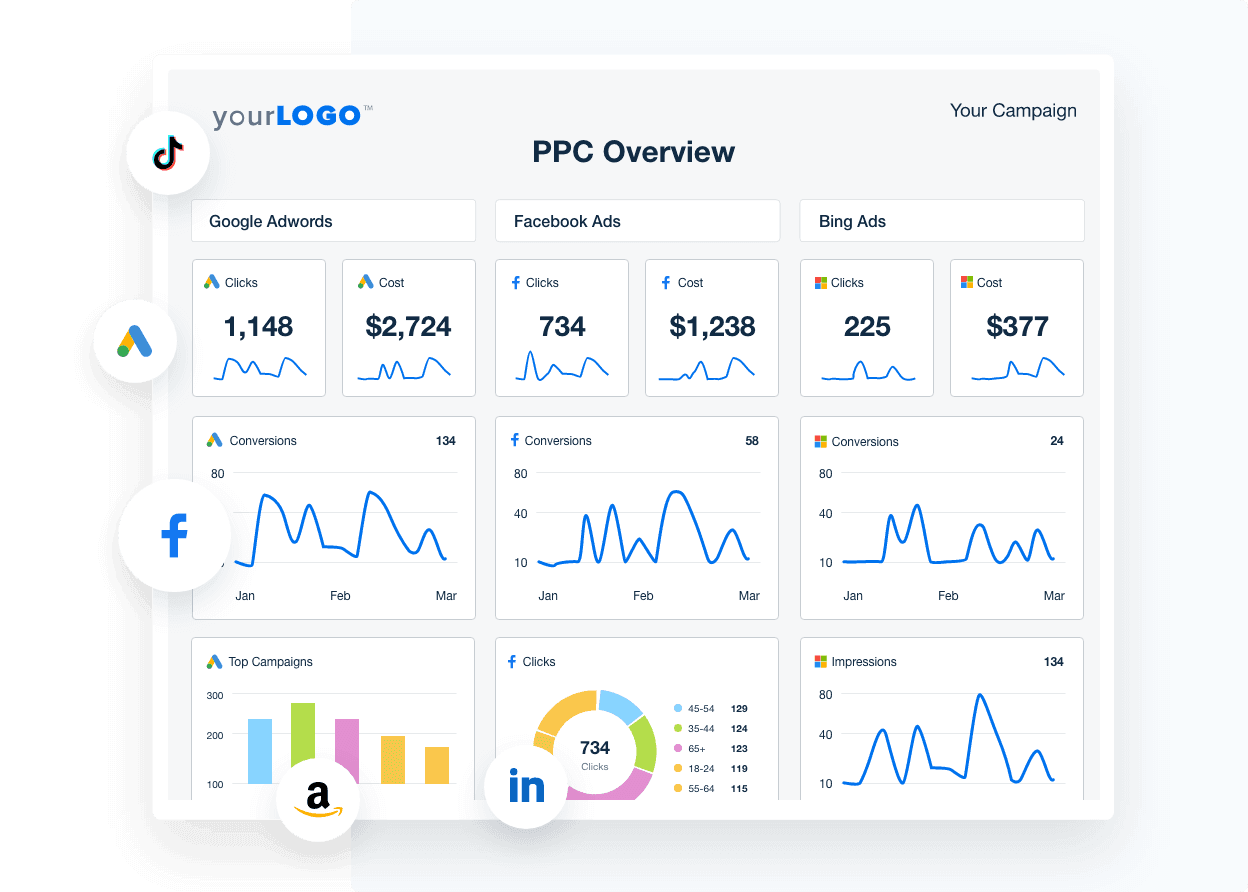
That’s where a custom dashboard comes in. Use this tool to add annotations, share easy-to-grasp visualizations, and blend multiple metrics into a single data point. Not happy with the current layout? Shift things around using the drag-and-drop editor–it’s all up to you. 

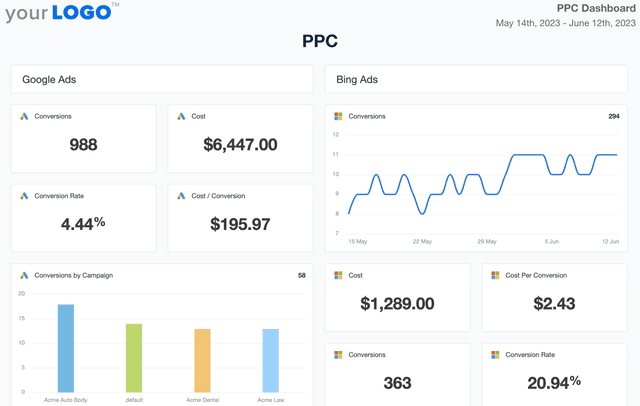
A screenshot of a sample PPC report

Need a way to up your efficiency even more? Try the 11-second Smart Dashboard feature. Instantly generate data-rich dashboards that auto-populate with client’s unique metrics; it’s that simple. 

Plus, all AgencyAnalytics dashboards are easy to replicate, which means you’ll save precious billable time and speed up the client onboarding process. Think of this tool as an investment in your agency’s future–it’s designed to grow with your agency, handle an increasing volume of data, and ensure no disruptions to your service delivery.

Spend less time on complex configurations. Focus on what truly matters: Delivering results to your clients. 

The AgencyAnalytics platform beautifully and simply consolidates data from all the major platforms that our clients utilize. This saves them (and us) from having to receive, find, or generate multiple reports from multiple platforms.

Glenn Marvin
Glenn Marvin

Konnector

Save Time on Reports and Gain More Time for Strategy
Automate Client Reporting and Free Up Hours Every Month
Start Your 14-Day Free Trial

Custom Instagram Ads Dashboards as Unique as Your Agency

Everything You Need in One Place

Instantly Access All Your Clients’ Instagram Ads Data

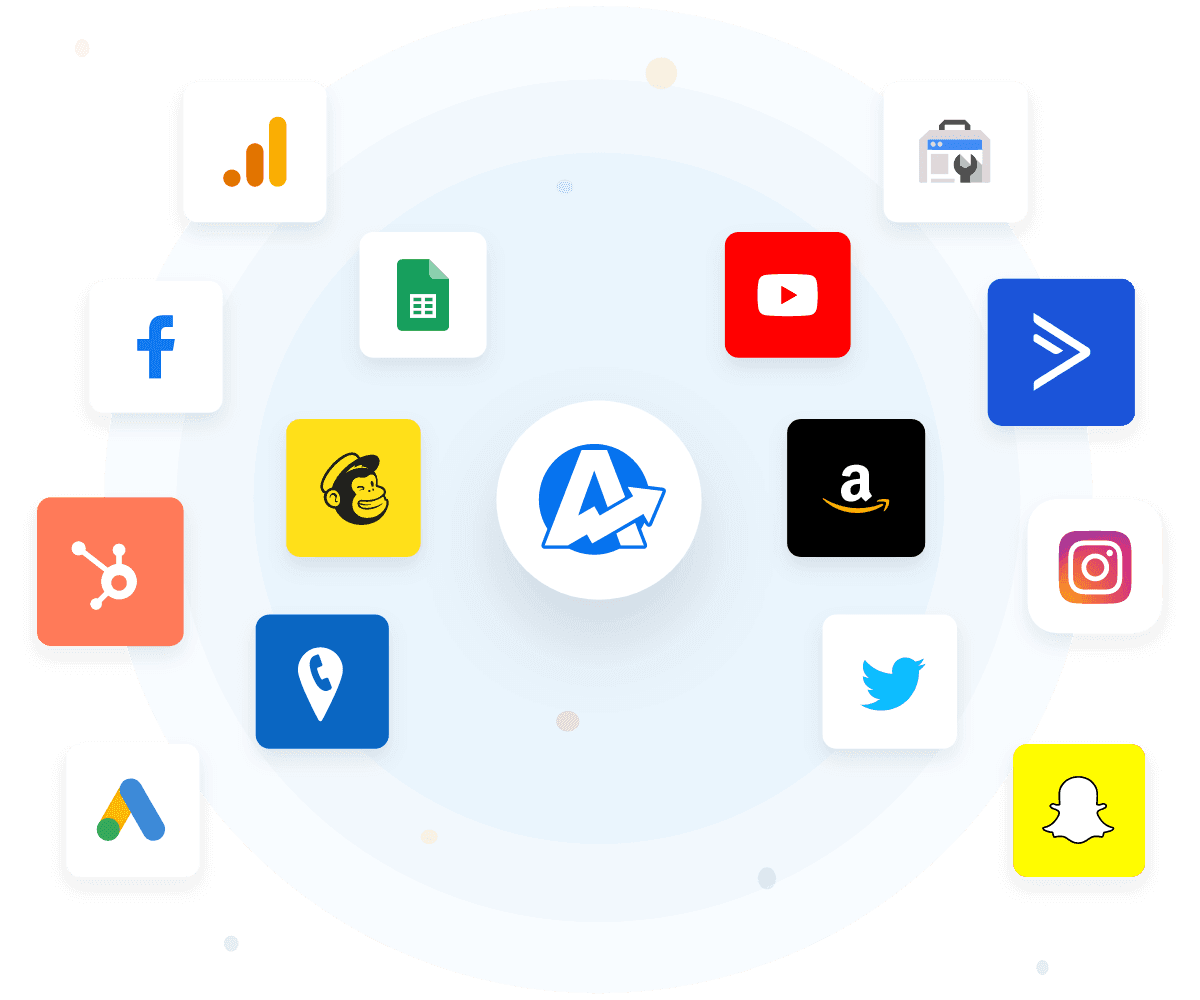
No need to manually log into your client’s Instagram account each time! Consolidate data from 80+ integrations, all in a central hub. 

Simplify data management, streamline agency operations, and reclaim billable time. Invest in a visual interface that helps clients quickly understand their data.

An example of the available marketing platform integrations AgencyAnalytics offers to connect your clients' marketing data
Make Your Brand the Hero

White Label Your Instagram Ads Dashboards

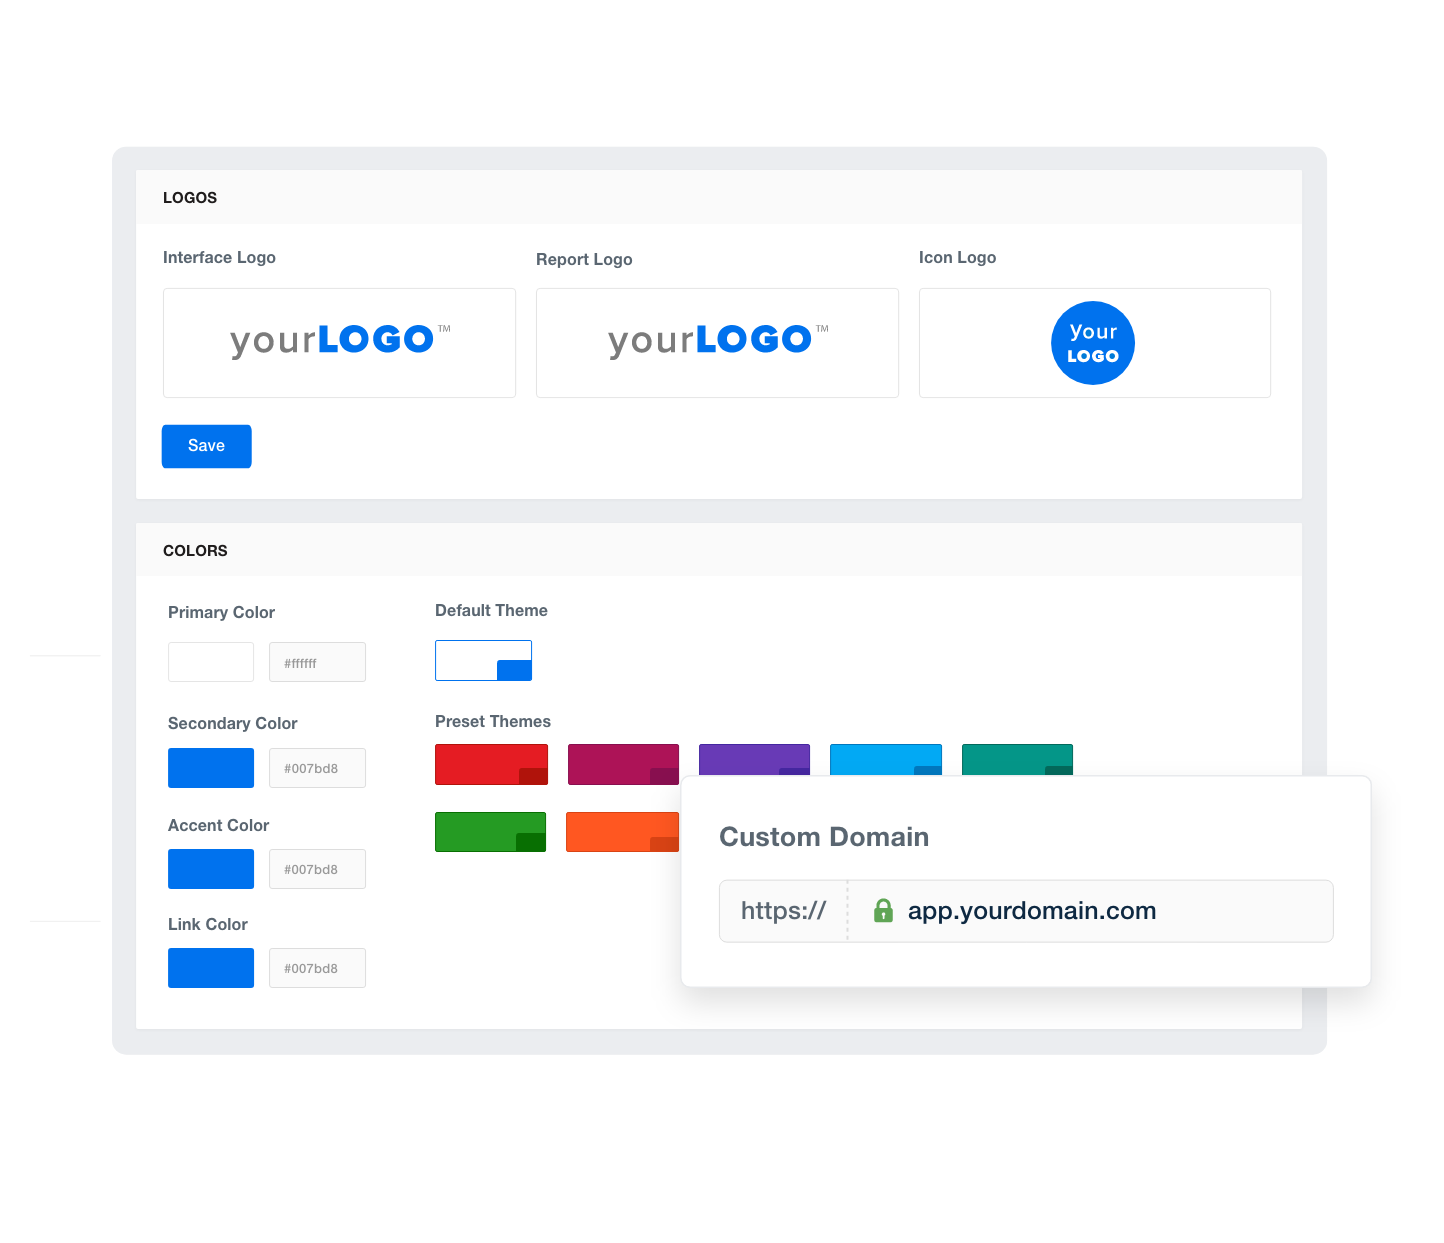
Elevate your agency's brand with white label dashboards! Customize the reporting experience to match your brand's identity perfectly.

In a few clicks, incorporate your logo, color palette, and even a custom cover page. Boost your dashboard presentation and show clients you mean business.

Add Your Own Branding To Your Customizable SEO Reporting Software
Customization Made Easy

Provide Granular Insights With Custom Metrics

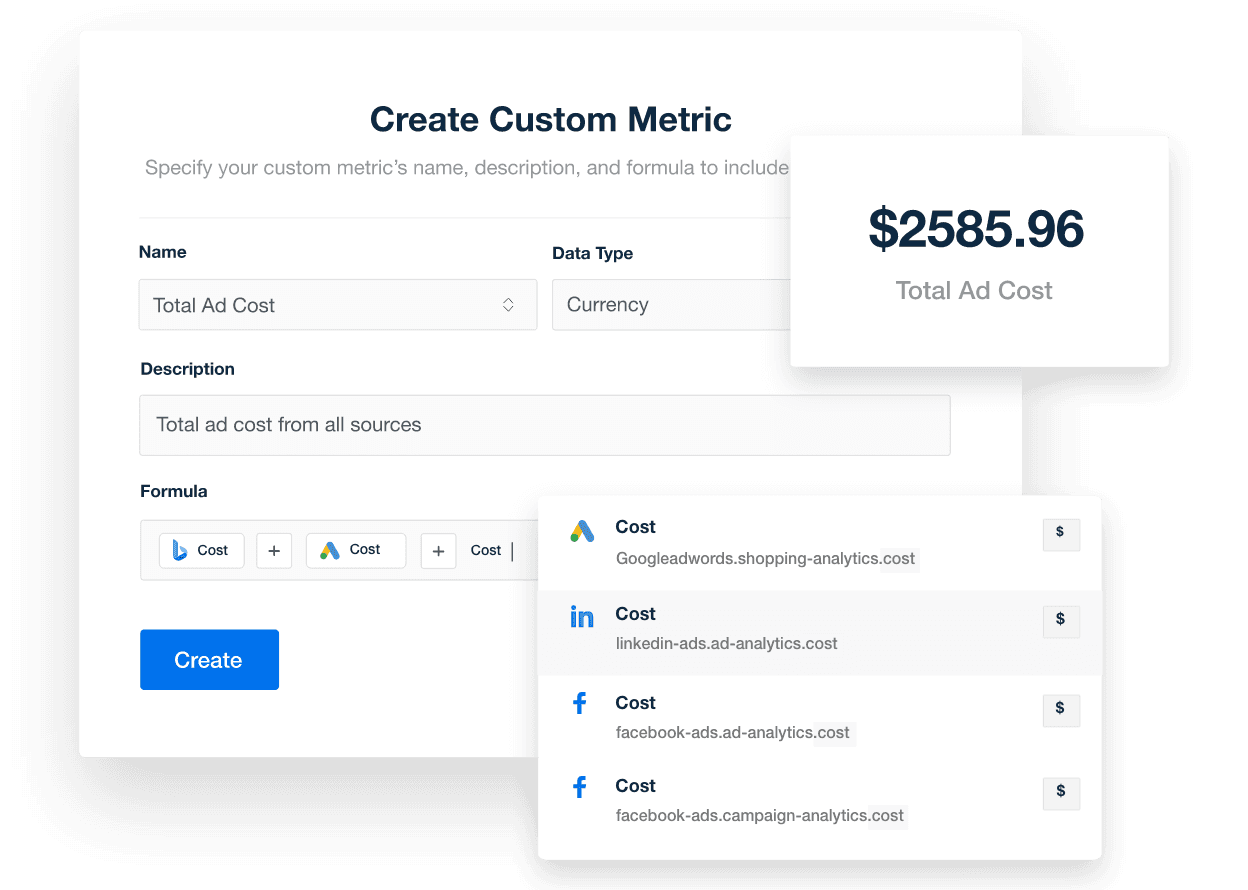
Got clients that monitor more than in-platform insights? Combine data points across 80+ platforms and create custom metrics that reflect these objectives. 

Deliver impactful reports that align with real-life business strategies. Show clients that you’re willing to go above and beyond.

AgencyAnalytics Custom Metrics Feature
Streamline Your Agency's Workflow

Monitor All of Your Clients at a Glance

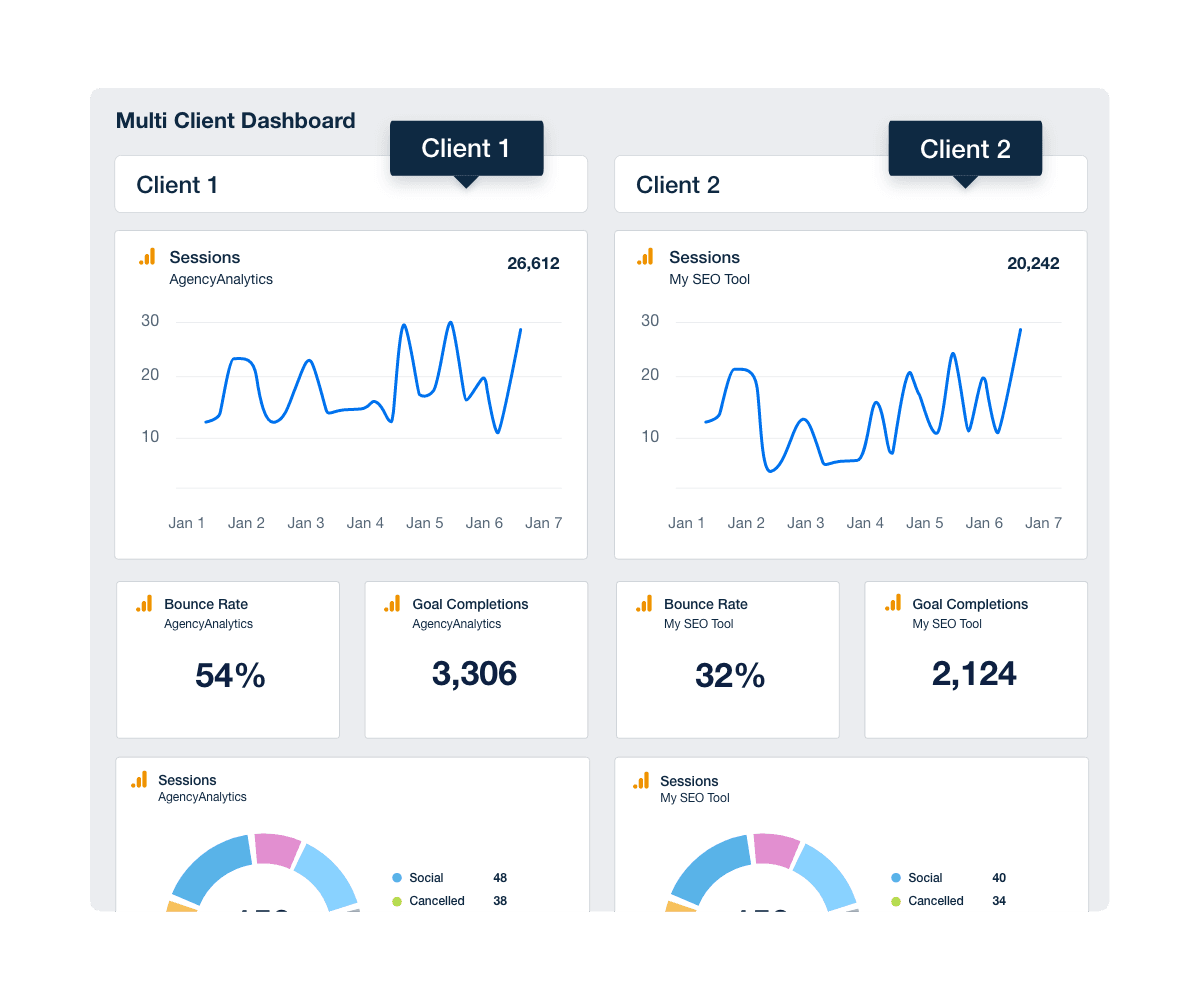
See the bigger picture in one interface. Create an internal agency dashboard to monitor account performance across multiple client campaigns. 

Have a system to identify hiccups, observe trends, and make course corrections. Improve your operational efficiency and deliver value to clients–all with a single data visualization tool.

Track important KPIs across more than one of your client campaigns.
We’re Invested In Your Success

Customer Support is Our Top Priority

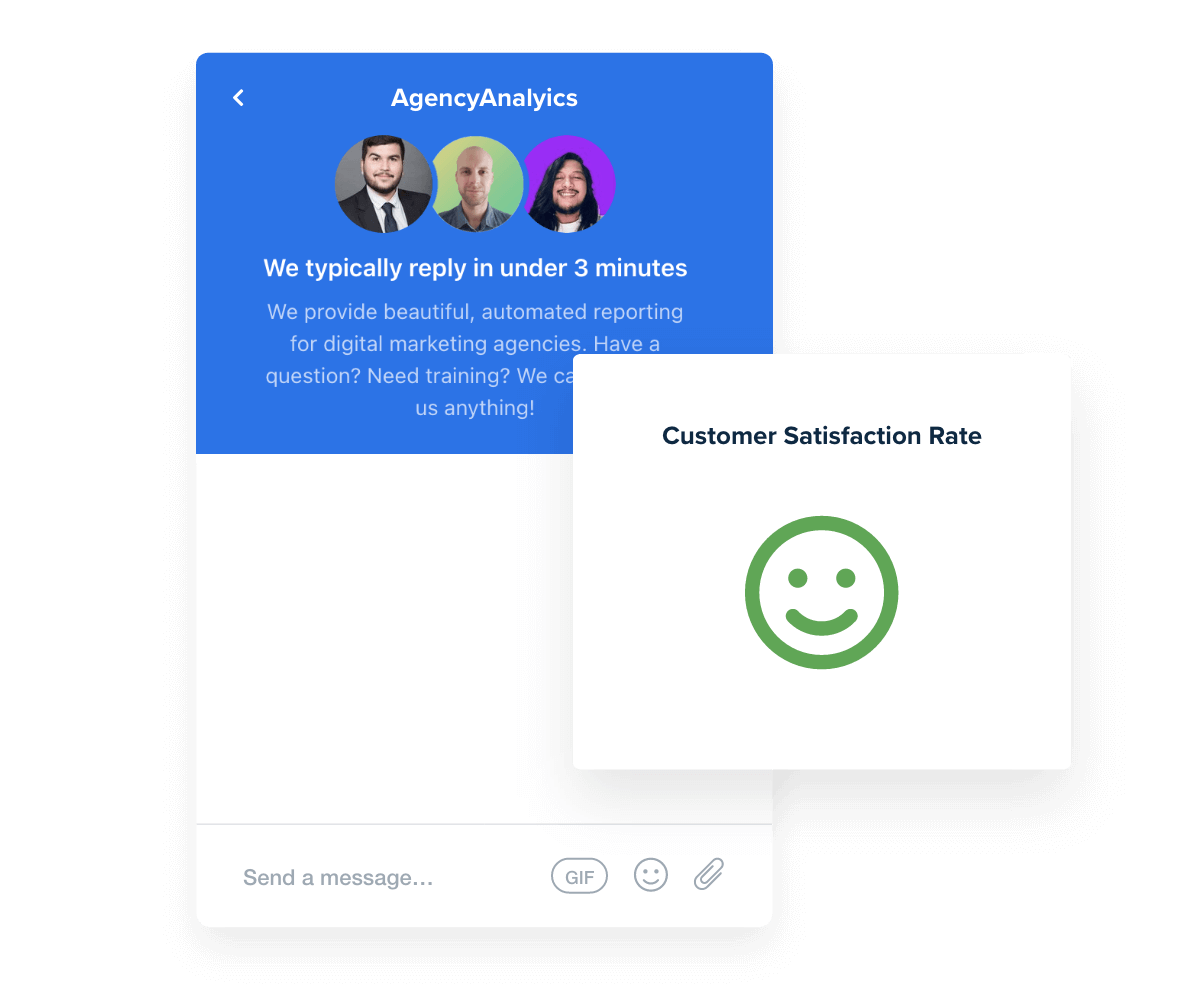
Need some assistance? Reach out via our 24/5 live chat; we’ll gladly help! In fact, our average response time is consistently under 3 minutes, with a satisfaction rate exceeding 95%. 

Simply put, we're committed to providing the support you need. You care about your clients' success. We care about yours.

Best in Class Customer Support
Boost Agency Efficiency

Report Smarter. Not Harder.

In a few clicks, view Instagram Ads data alongside metrics from 80+ other platforms. Share a holistic overview of your client’s marketing performance in a visual, intuitive format. 

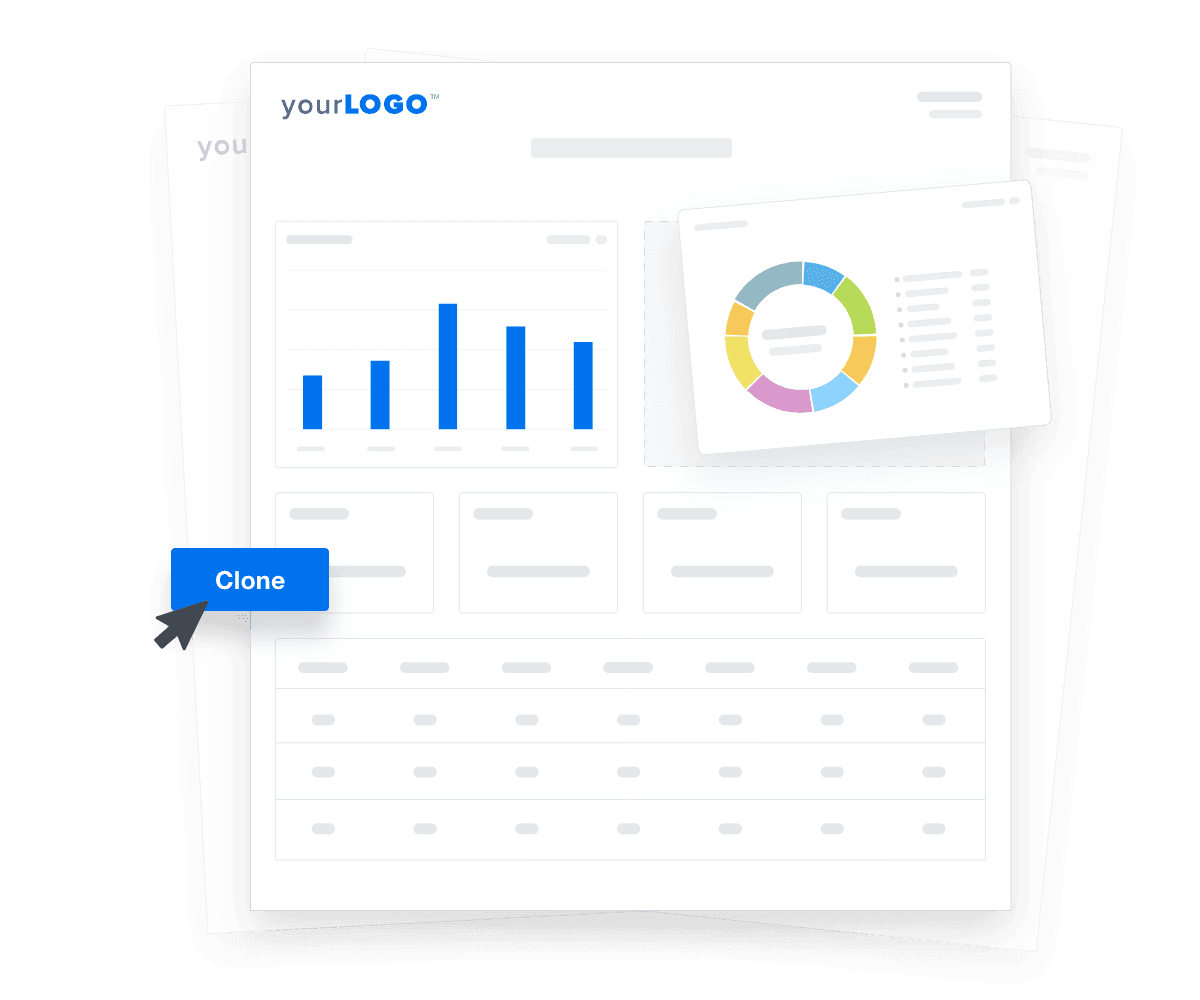
To save time, clone any AgencyAnalytics dashboard whenever a new client comes along. That way, you’ll speed up onboarding and quickly get back to business.

Smarter Client Reporting Platform

Tracking data is a vital part of our business, and the accuracy of data is a must. AgencyAnalytics brings all our tracking accounts into one place, streamlining our internal work processes.

Keith Griffiths
Keith Griffiths

DataRush Ltd

Get Started for Free

Try AgencyAnalytics risk-free for 14 days. No credit card required.
AgencyAnalytics Dashboard Preview