Table of Contents
QUICK SUMMARY:
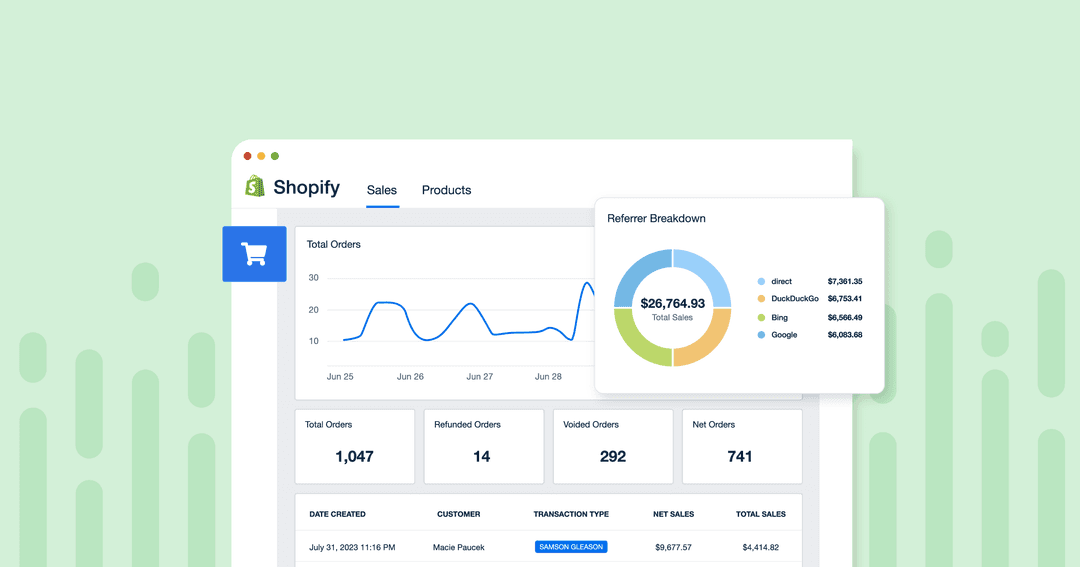
Shopify Analytics offers key insights into Shopify eCommerce site performance, customer behavior, and sales trends. With a focus on transforming data into meaningful insights, Shopify Analytics aids in tailoring marketing strategies and product offerings to customer trends and preferences. Discover 12 key Shopify analytics metrics to report success to your clients.
Any marketing agency worth its salt appreciates the value of good data—especially when it directly contributes to clients' bottom line. When it comes to making business decisions, your clients need the right Shopify analytics metrics on hand. Meanwhile, your agency needs a way to manage Shopify's analytics at scale, helping clients with:
Tracking order metrics to make data-driven business decisions
Increasing repeat purchases
This article explores 12 key Shopify analytics metrics to include in your agency's Shopify reports. The goal is to provide insight into your clients' key performance indicators and metrics to help them successfully run their online business using a Shopify analytics dashboard.
What Is Shopify Analytics?
Shopify Analytics is a crucial component for any Shopify eCommerce site. This tool provides a detailed analysis of store performance, customer behavior, and sales trends. Beyond collecting raw data, such as AOV, Cart Abandonment Rate, Checkout Abandonment Rate, and Conversion Rate, Shopify store analytics provide a comprehensive system for understanding and improving an online store's operations.
At the heart of Shopify Analytics is the dashboard. This central hub offers immediate access to key performance indicators essential for monitoring and responding to store activity in real time. The dashboard displays critical information such as sales figures, customer demographics, and purchasing behaviors, allowing quick and informed decisions.
Analytics for Shopify extends into various aspects of store management. It includes monitoring visitor interactions on your website, analyzing sales patterns, and understanding customer engagement. Each element plays a vital role in developing strategies for growth and customer retention.
Shopify data analytics focuses on transforming raw data into meaningful insights. Analyzing customer trends and preferences aids in tailoring marketing strategies and product offerings to meet the needs and interests of your target audience.
Moving into Shopify website analytics, explicitly addressing how customers interact with the eCommerce site. It provides insights into page performance, visitor flow, and engagement levels, which are crucial for optimizing the user experience and increasing conversion rates.
It’s a systematic way to gather insight data that helps agencies keep their clients' Shopify stores ahead in a competitive market and is an integral part of strategic eCommerce planning.
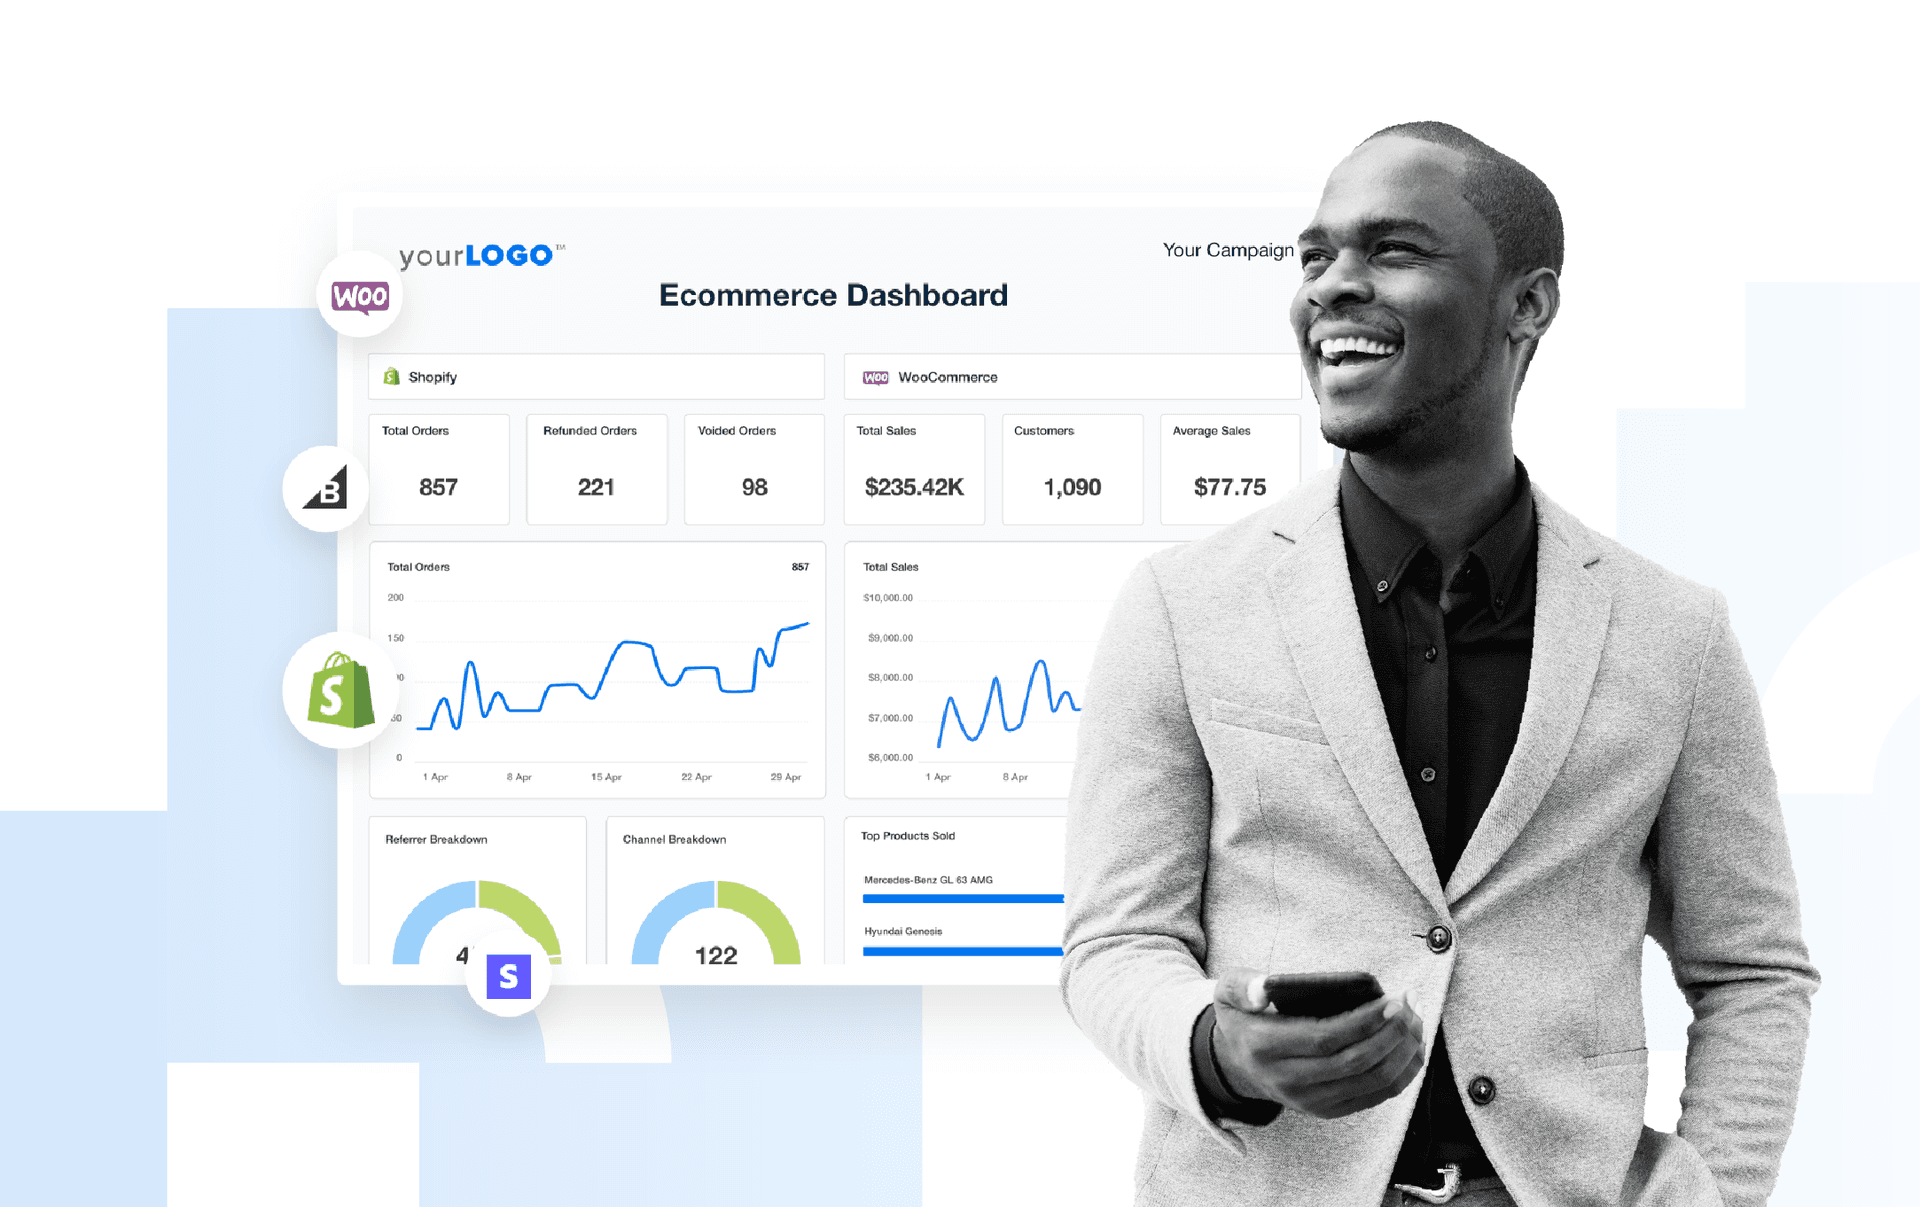
Easily track your clients' most important analytics with an easy-to-use, customizable Shopify dashboard. Try AgencyAnalytics free for 14 days.
Shopify Analytics: 12 Key Metrics Agencies Should Track
Ready to optimize your client's Shopify admin and have a live view of all your clients' Shopify order metrics?
#1. Total Sales
This order metric refers to a Shopify store's total sales or revenue over a specific date range. In addition to showing you the overall sales, it also provides several other insights:
Peak sales periods
Most successful products
Customer buying behavior
Your clients will use Shopify reports for inventory. It enables store owners to analyze patterns and better prepare for peak times while letting them know which products to focus on.
#2. Net Sales
Net sales represent total sales, less discounts, returned goods, shipping costs, and allowances for damaged goods. This metric communicates the actual revenue of your clients' online store and whether it has grown or dipped.
This stat influences everything from product pricing to inventory. If your clients' Shopify store's gross and net sales are higher than an industry average, they may be offering higher discounts or getting an excessive amount of returns compared to industry competitors.
#3. Average Order Value (AOV)
Tracking the average order value is essential to any Shopify report because it tells your clients exactly how much they can spend to profitably make an acquisition. (Shopify suggests these top five strategies to increase AOV over time.)
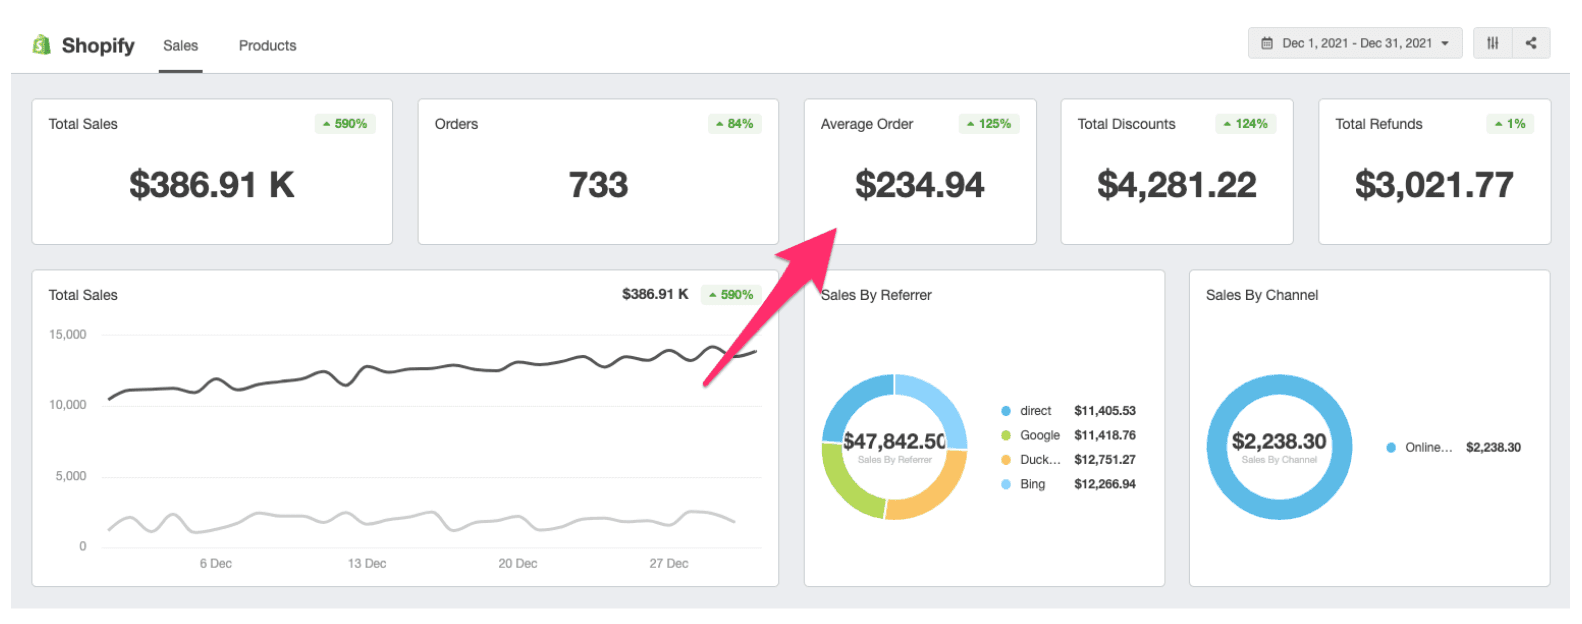
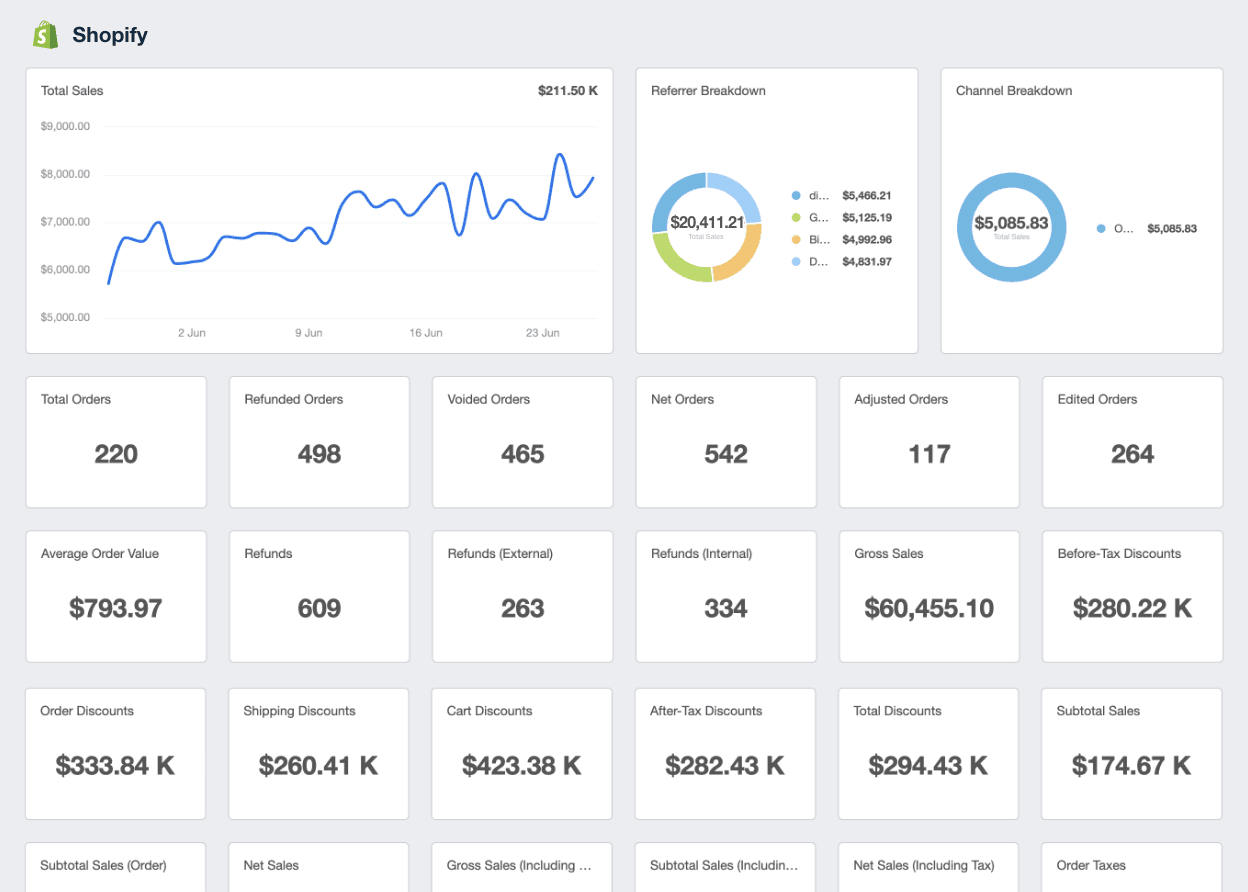
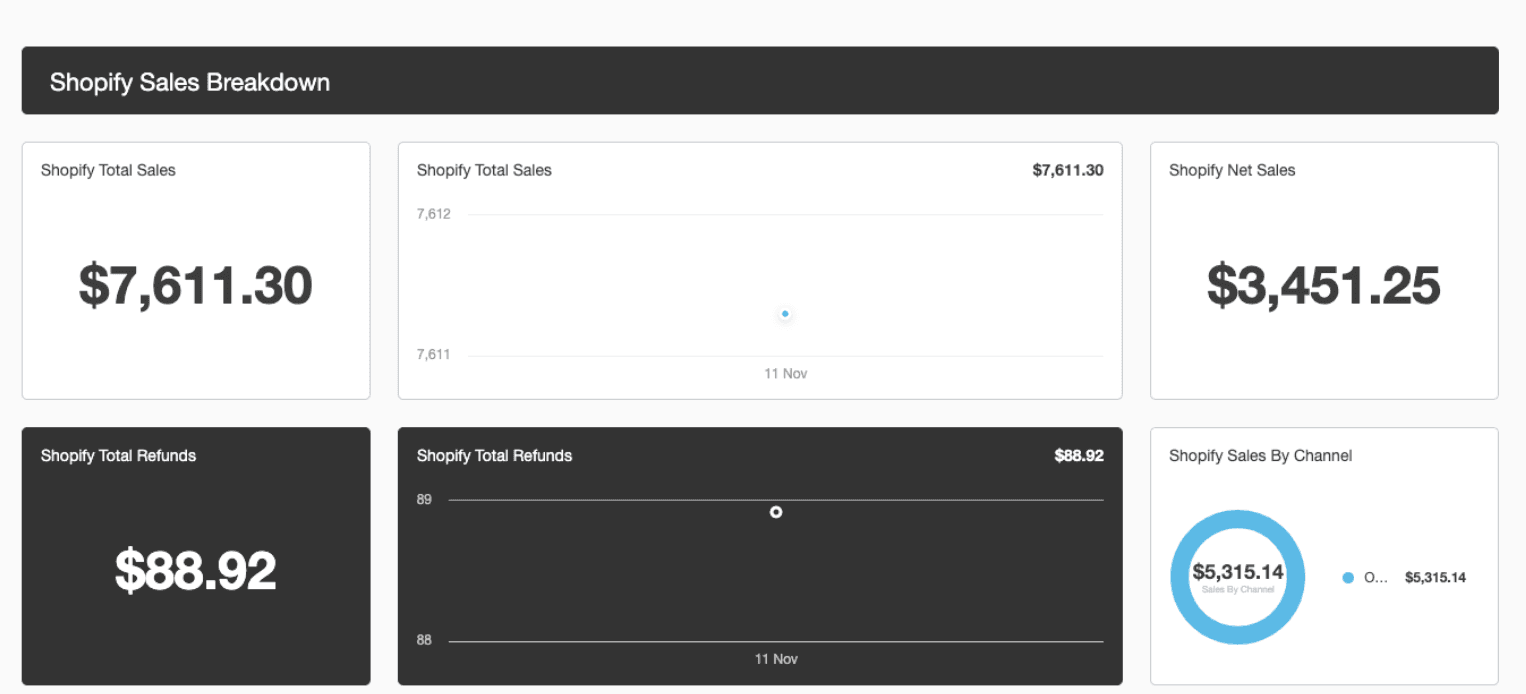
Image of a Shopify Analytics Dashboard in AgencyAnalytics
#4. Purchase Conversion Rates
Monitoring this metric is crucial to ensure your clients’ websites are properly designed to encourage visitors to make a purchase. On average, online stores enjoy a conversion rate of about 3%. According to a recent survey, the average conversion rate of Shopify stores is around 1.3%.
The conversion rate is not just about sales. Calls To Action (CTAs) might be used to encourage your clients’ site visitors to:
Click on ads
Opt-in to a mailing list
Add an item to their shopping cart
Share social media posts
Combining native Shopify Analytics with Google Analytics 4 metrics like conversion rates provides a more in-depth report that clients will appreciate.
#5. First Time Purchasers
Another GA-4 metric that is worth adding to any eCommerce dashboard is First Time Purchasers. Understanding the difference between first-time and returning customers helps clients understand how many of their customers are buying for the first time.
A higher number of first-time customers is an indication that demand gen programs are doing what they are meant to do.
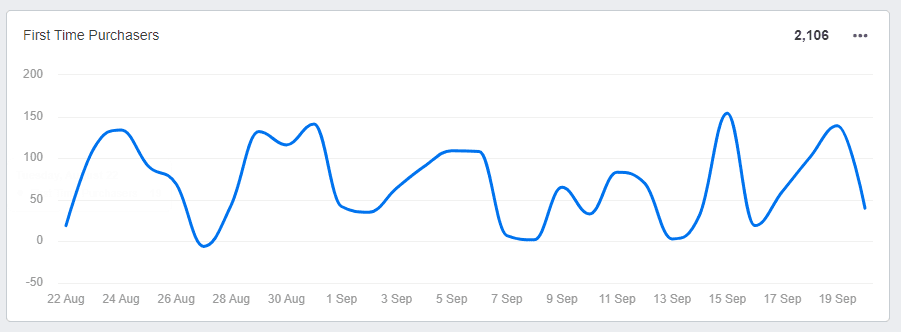
While first-time purchasers are a positive indicator of demand generation programs, it's also important to consider the repeat purchase rates. This helps gauge a customer's loyalty and lifetime value. In most studies, the average repeat customer rate is between 20% and 40%.
💡 Use the drag-and-drop editor to create custom eCommerce dashboards that combine data from multiple sources to paint a complete picture of Shopify success.
#6. Refund Rate
The refund rate is one of the order metrics that acts as a quality assurance metric.
Your clients will want to know which products are not meeting customer expectations. They can either choose to remove these products from their catalog or make pricing adjustments.
#7. Sales by Channel
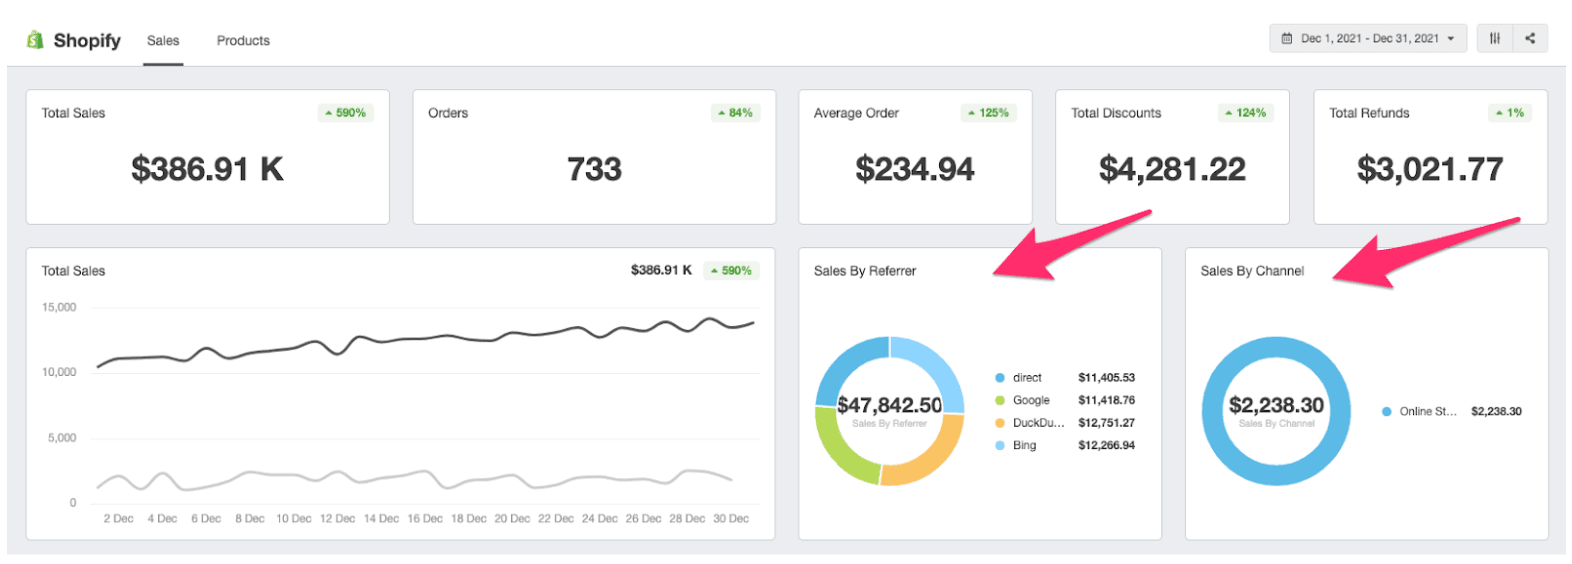
The Sales by channel metric shows the number of sales for your clients’ various sales channels and whether it’s from an online store, buy button, or app. It will help your agency focus its marketing efforts on increasing sales in areas of need.
#8. Sales by Referrer
The sales by referrer metric shows your clients where their sales are coming from, like:
Social: They clicked a link on social media
Email: They clicked a link to your store in an email
Direct: They enter your store's URL into their browser
Search: They clicked your store from a search engine's results page
Unknown: The referral source isn't known
#9. Products by Type
Another essential metric to track is products by type. Which types of products are moving and which ones are hardly being sold? Knowing this will help create a marketing strategy that will help sell the slower-moving products.
#10. Top Products Sold
This metric tells you which products are most popular by the number of products sold. While it doesn't necessarily mean that they generated the most revenue or had the most orders, it helps your clients know which products are most popular and avoid going out-stock.
#11. Shipping
The shipping metric tracks how much your clients are spending on delivering products to customers. Shipping equates to shipping charges, less shipping discounts, less refunded shipping amounts.
#12. Taxes
Track how much your clients’ Shopify store is spending on taxes. This metric tracks the total amount of taxes based on the orders.
How To Build Shopify Reports to Wow Your Clients
AgencyAnalytics automates the process of tracking and reporting these key metrics with feature-rich dashboards that show live sales for each client's Shopify account.
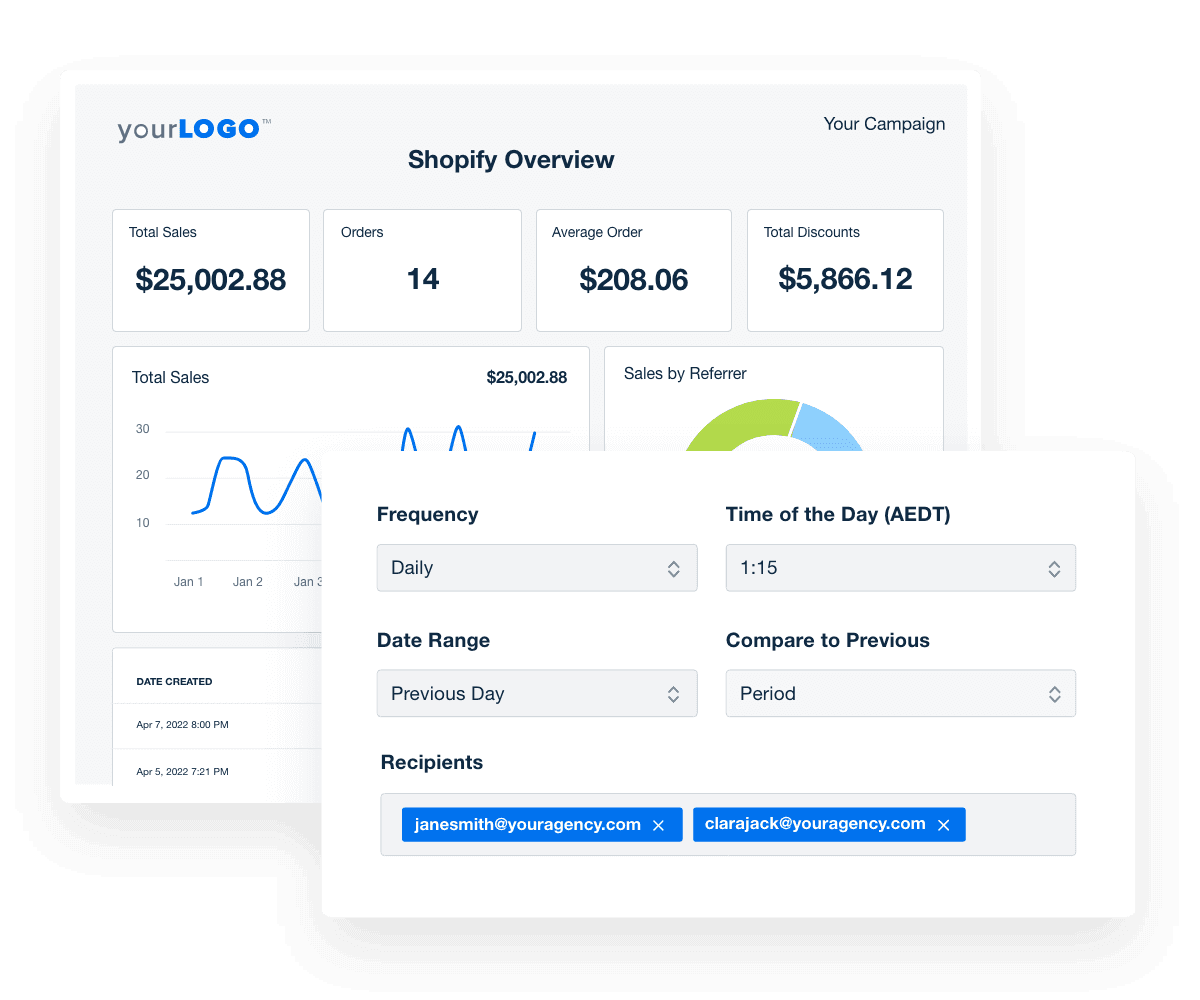
Automate your agency's Shopify reporting with a customizable Shopify report template or a comprehensive eCommerce report template today! Start your free 14-day trial with AgencyAnalytics, no credit card required!
#1. Highlight Your Clients' Shopify Performance
Monitor and share Shopify data alongside other tools and integrations, all designed to showcase your agency's marketing efforts across channels. AgencyAnalytics has robust features and an intuitive drag-and-drop interface to help clients instantly understand your agency’s contribution to their bottom line.
#2. Simplify Your Shopify Accounts
Whether your clients have an advanced Shopify account or basic Shopify plan, AgencyAnalytics provides a robust overview dashboard that can be customized with easy-to-use widgets. With AgencyAnalytics, you don't have to keep logging in and out of different Shopify accounts. Organize each client's Shopify data into separate campaigns and customize exactly what you see in feature-packed dashboards and reports.
Want to know what landing pages are getting the highest number of orders? Done. With the Google Analytics integration, your agency provides advanced insights on metrics such as:
Gross sales from points of sale
The number of visitors or number of sessions over a period of time
Traffic referrers
And more.
#3. Interpret Key Insights
AgencyAnalytics allows tracking of every store owner's Shopify sales, customers, referrers, and more. This enables you to see top products and instantly view sales breakdowns. You can also uncover trends across time and spot opportunities to maximize your client's Shopify profits.
#4. Track Key Metrics in Real-Time
With AgencyAnalytics, you benefit from feature-rich dashboards that show the live sales of each Shopify customer account. Your team can monitor the eCommerce store performance, and clients can log in at any time.
Choose from hundreds of drag-and-drop widgets to build custom Shopify dashboards, including notes, images, and data from all other integrations.
Automate Your Agency's Shopify Analytics Reports
Clearly communicating your clients’ Shopify analytics allows them to run a successful online store by making continual improvements. And chances are, your clients are also on other sites.
Shopify's analytics won't mean much without the bigger picture. Use a digital marketing analytics tool to combine data from over 80 marketing integrations of your choice, including Google Analytics, Facebook Ads, Instagram, and more.
Knowing how their Shopify store performs at any moment allows your agency to drive marketing efforts that will ultimately increase sales.
By automating your clients’ Shopify analytics with a dedicated reporting dashboard, change your agency’s focus to more high-value tasks like improving conversion rates, driving more traffic, and ultimately improving your client’s bottom line.
Use an eCommerce dashboard template, or create your custom dashboard with your clients' relevant data. Include their order metrics, the total number of sales, and a wide array of ROI metrics to impress your clients and beat sales goals. With a live view of your agency's progress, you'll always be a valued part of your clients' online business decisions.

Flip your analytics dashboards into a client-ready report in minutes! Show the bigger picture with an all-in-one analytics tool and client reporting platform. Try AgencyAnalytics free for 14 days.

Written by
Melody Sinclair-Brooks brings nearly a decade of experience in marketing in the tech industry. Specializing in B2B messaging for startups and SaaS, she crafts campaigns that cut through the noise, leveraging customer insights and multichannel strategies for tangible growth.
Read more posts by Melody Sinclair-BrooksSee how 7,000+ marketing agencies help clients win
Free 14-day trial. No credit card required.


