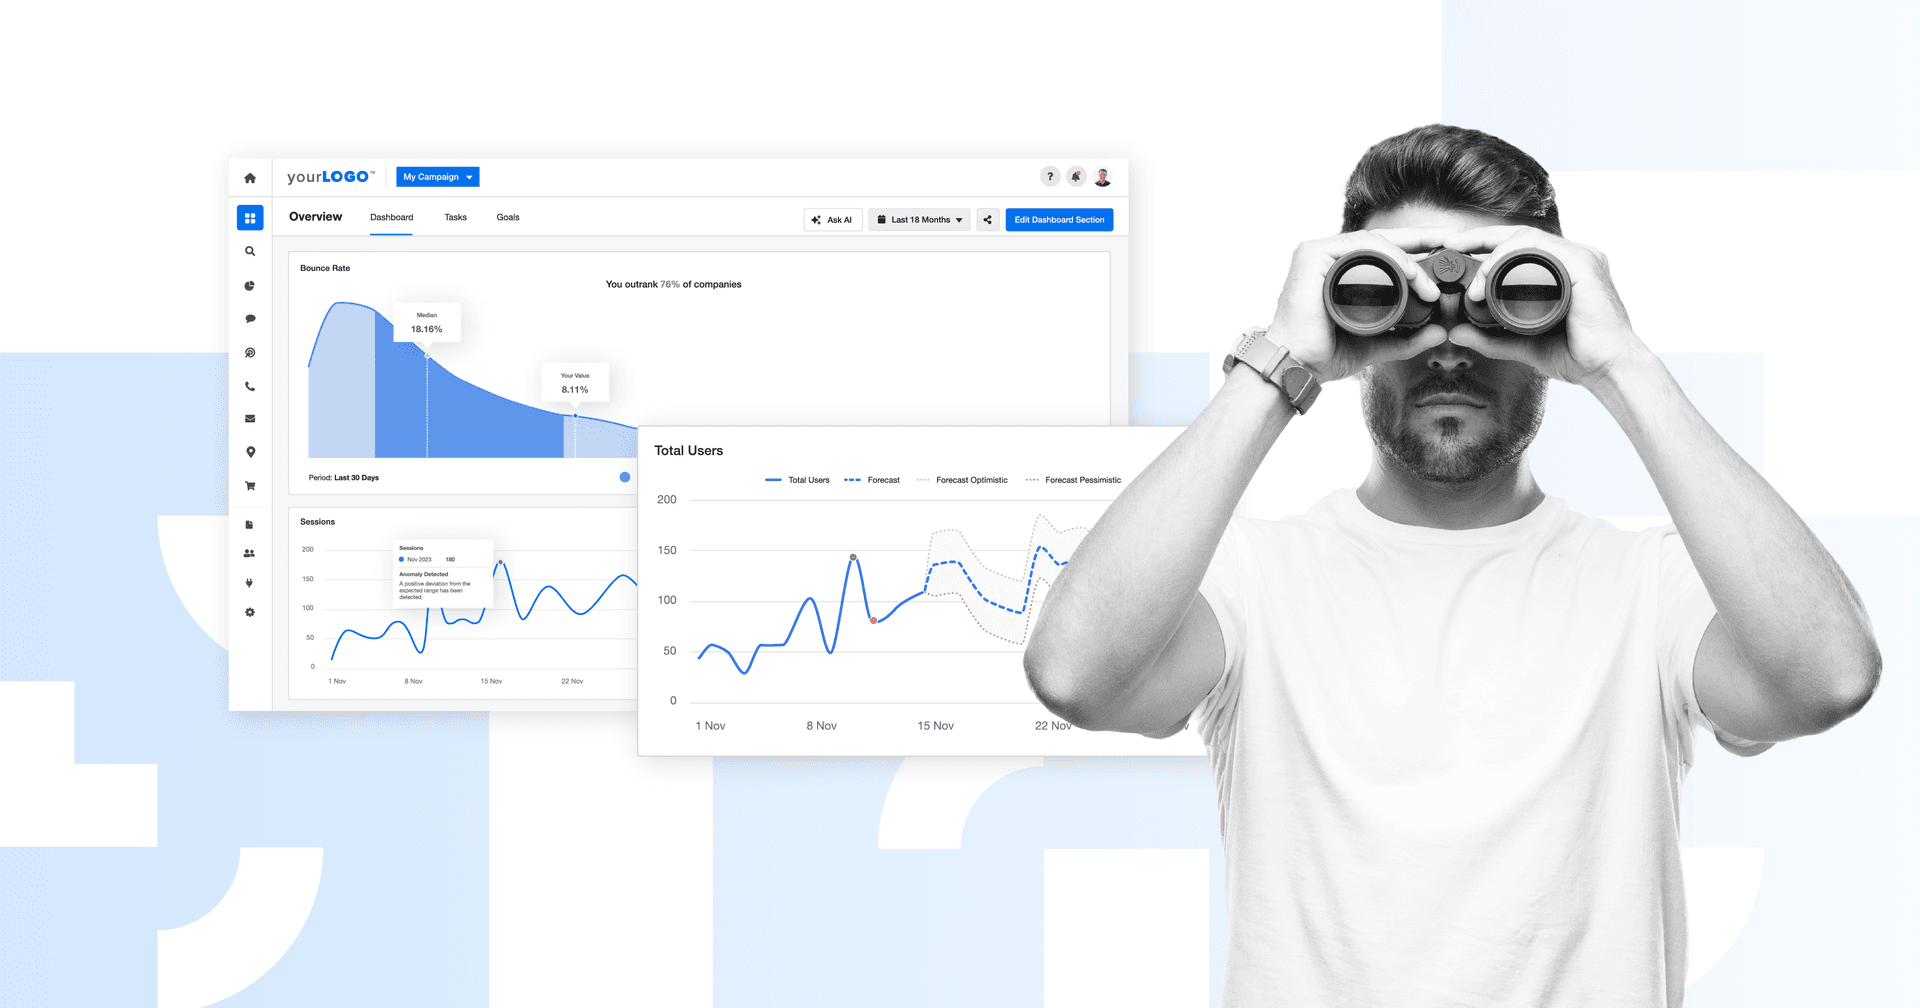
Aggregate Data
Spot Trends
Quickly highlight campaign patterns across channels and timeframes.
Audience Insights
Reveal group behavior without diving into individual user data.
Prove ROI
Showcase results in reports to reinforce agency value.
Optimize Spend
Help shift budget toward better-performing campaigns or tactics.
Why Aggregate Data Is Important
Aggregate Data makes it easier to spot what’s working and what’s not without getting lost in individual data elements or raw data. Instead of chasing isolated numbers, teams use this summarized format to understand overall campaign performance, audience behavior, and content trends at scale.
This type of data aggregation brings consistency to reporting and cuts through noise, especially when working across multiple sources like paid ads, organic traffic, or social media communications. It simplifies decision-making, supports faster pivots, and builds a reliable baseline for statistical analysis—critical when speed, accuracy, and clarity matter.
Stop Wasting Time on Manual Reports... Get Insights Faster With AgencyAnalytics
How Aggregate Data Relates To Other KPIs
Aggregate Data draws from multiple sources—clicks, impressions, conversions, bounce rates, and more—to create a summary representing campaign performance. Data aggregation reflects trends that individual KPIs often miss, making it a valuable part of data aggregation and strategic planning.
It also acts as a checkpoint for data analysts and data scientists. If performance dips, the use of Aggregate Data helps pinpoint which specific KPIs are underdelivering. When trends improve, it can validate successful optimizations using statistical analysis and specified statistical functions built into many software tools.
This broader view is especially helpful when managing social media communications, email campaigns, or ads across channels. Data aggregators work to centralize insights from siloed platforms, giving teams one aligned snapshot—essential for presenting critical insights and guiding future moves.
Key Factors That Impact Aggregate Data
Factors like audience size, campaign reach, and data freshness shape how accurate and useful aggregated data becomes. A highly segmented audience or small sample size may skew statistical results, while a broader reach supports a more relevant aggregate. Timing also matters—outdated data can produce misleading conclusions compared to real-time inputs.
Platform and source variability also influence outcomes. Data from social media communications, call centers, or paid search campaigns each behave differently. Without consistent tracking, data aggregation may suffer, making it harder for data analysts or data warehouse administrators to extract critical insights from large databases.
Data quality is another major factor. Duplicate entries, bot activity, or issues capturing non numeric data elements can distort results. Clean tracking, supported by reliable software tools and proper attribution, ensures the summary form of data stays reliable and ready for statistical analysis or predictive analytics.

With custom reports, we can zoom in on the key performance indicators and metrics that matter most to our clients, making our reporting experience incredibly valuable and directly relevant to their success.
How To Visualize Aggregate Data
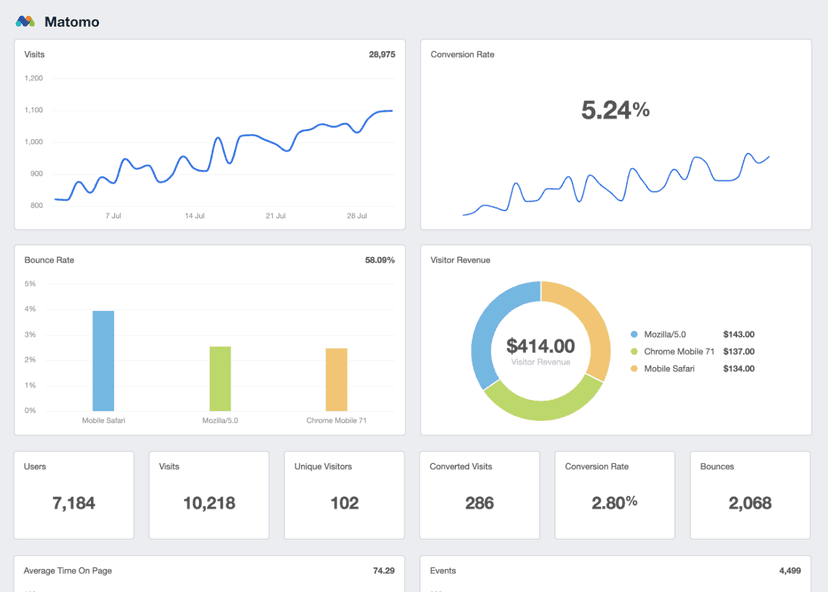
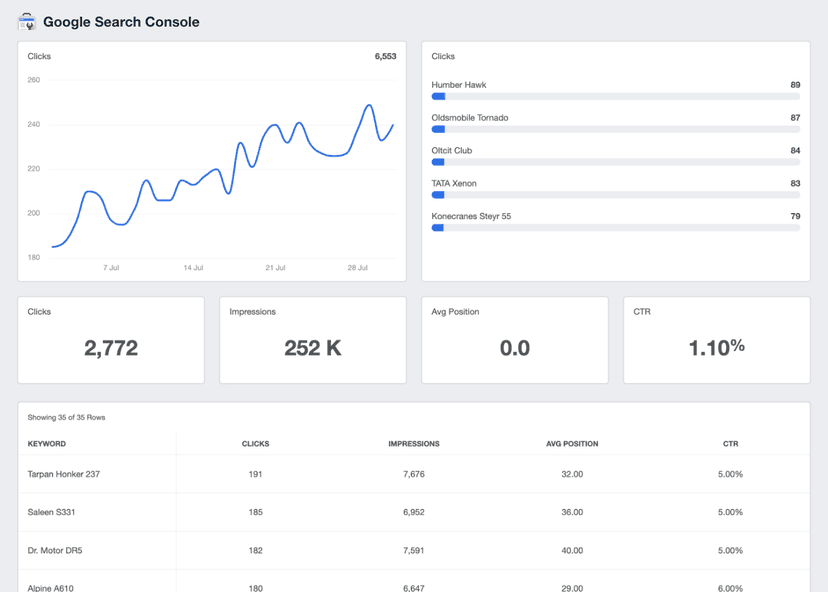
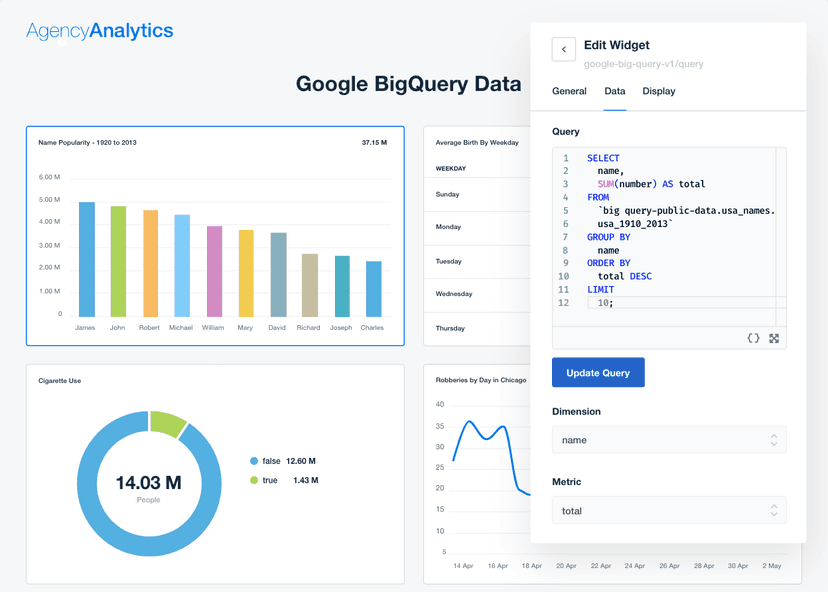
Visualizing aggregated data helps teams gain insights faster by turning raw data into clear, client-friendly visuals. Instead of scanning spreadsheets, trends and patterns appear instantly. Use visuals to track performance over time (line graphs), compare campaign results (bar charts), and break down totals by channel or source (pie charts). This simplifies data aggregation, especially when working with multiple sources like ad platforms, email, or social media communications.
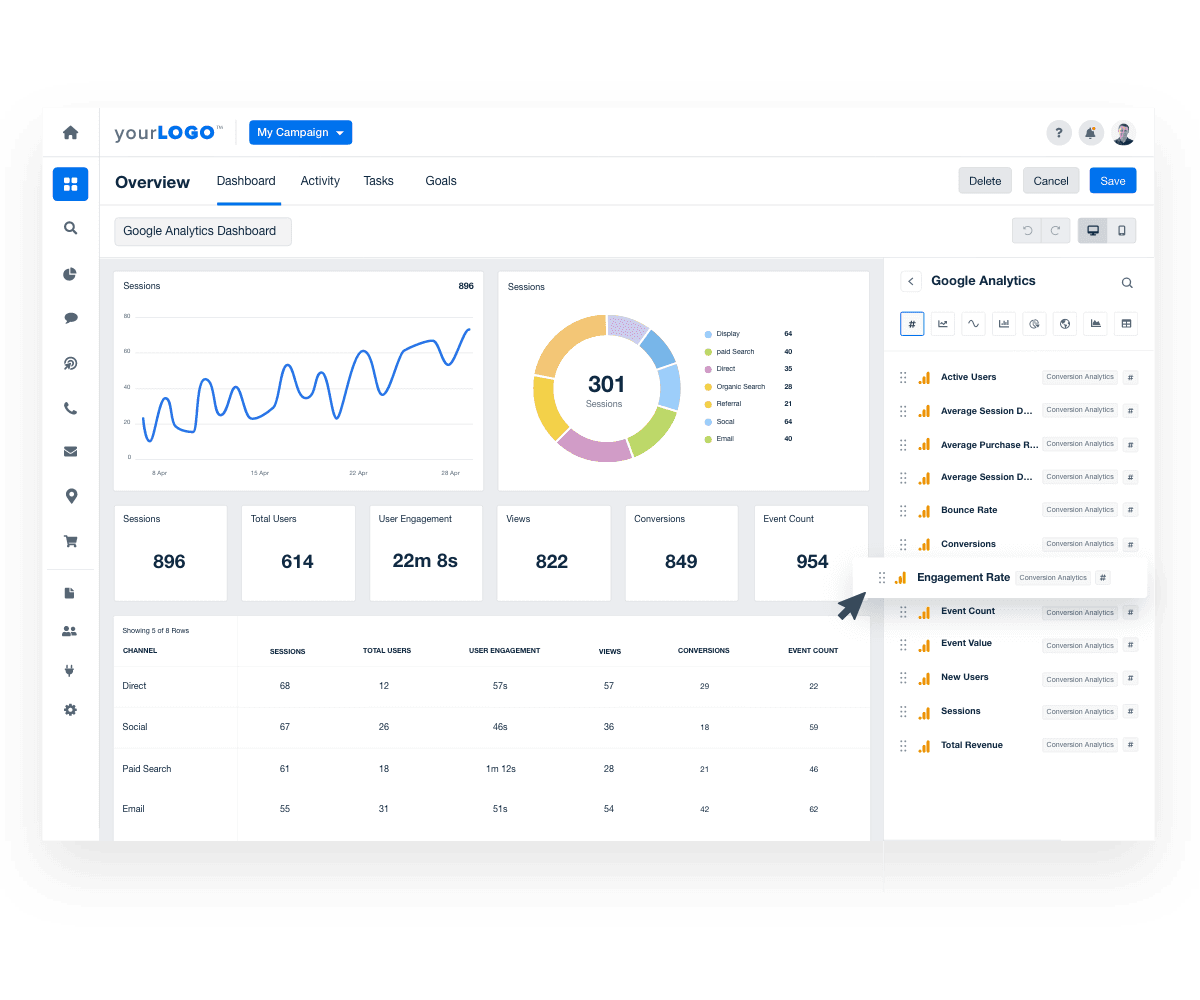
AgencyAnalytics makes visualization even easier by combining data from all connected platforms into a single, customizable dashboard. Metrics appear in a clean, visual format that clearly shows the summary form of individual data. With less manual setup and more automation, teams can focus on delivering insights—not formatting spreadsheets.
When Is a Good Time To Use Aggregate Data?
Aggregated Data is best used when identifying trends across multiple sources, consolidating campaign performance, or building reports for clients. It simplifies large volumes of collected data into a clear, high-level view that supports strategic planning and helps obtain information quickly. In these moments, data aggregation gives stakeholders a useful snapshot without exposing individual level data or overwhelming details.
When Is a Bad Time To Use Aggregate Data?
Aggregate Data becomes less useful when precision is required. Situations that call for individual level data, such as evaluating specific user behavior, A/B test performance, or troubleshooting conversion issues, require more granular insights. Relying on aggregate totals in these cases could mask underlying problems, causing teams to overlook meaningful differences between audiences, campaigns, or channels. It’s also a poor fit when analyzing behavioral variables, atomic data, or patterns tied to location data or browsing history.
Why Aggregated Data Matters to Clients
Clients want proof that marketing efforts are delivering value, and aggregated data offers that in a clear, digestible way. It combines results from various channels and metrics into one simplified view—whether it’s leads, sales, or reach. Instead of sorting through fragmented dashboards, clients see at a glance whether goals are being met.
This type of data aggregation builds trust. When campaign data is tracked, consolidated, and consistently reported, it becomes easier to tie marketing activity back to business outcomes. Clients feel more confident about where their budget is going and whether the investment is producing measurable results—without needing to review individual data or interpret complex spreadsheets.
Why Aggregated Data Matters to Agencies
Agencies use aggregated data as a real-time pulse check across all campaigns. It highlights early signs of underperformance, reveals optimization opportunities, and surfaces high-impact wins. With input from multiple data sources, teams move from scattered metrics to one cohesive view that sharpens focus and drives better strategy.
It’s also a major time-saver. Instead of analyzing individual data across platforms, teams use data aggregation to streamline reporting. This reduces manual effort, supports machine learning algorithms for forecasting, and enables smarter, faster decisions that improve results and boost client retention.

Save Time and Streamline Your Agency’s Web Analytics Reporting
Best Practices When Analyzing and Reporting on Aggregate Data
Looking at aggregated data from different angles reveals what’s working, what needs work, and where to go next—creating a clearer path toward stronger, more efficient campaigns. Understanding the meaning of Aggregate Data helps unlock trends hidden in large volumes of data.
Verify Data Accuracy
Start with clean tracking. Check for missing tags, duplicate entries, or platform mismatches to avoid flawed or inflated totals. Solid data aggregation improves reliability across reports.
Track Changes Over Time
Use time-based views—daily, weekly, or monthly—to spot shifts in frequently accessed data. Tracking patterns over time helps reveal whether results are improving or stalling.
Spot Trends and Anomalies
Look for spikes, dips, or plateaus in the aggregate view. Unexpected movements often signal deeper issues or standout successes that deserve a closer look.
Put Numbers in Context
Even strong totals can mislead if disconnected from benchmarks or business goals. Always consider whether the aggregated data reflects real progress or just surface-level wins.
Show Results Visually
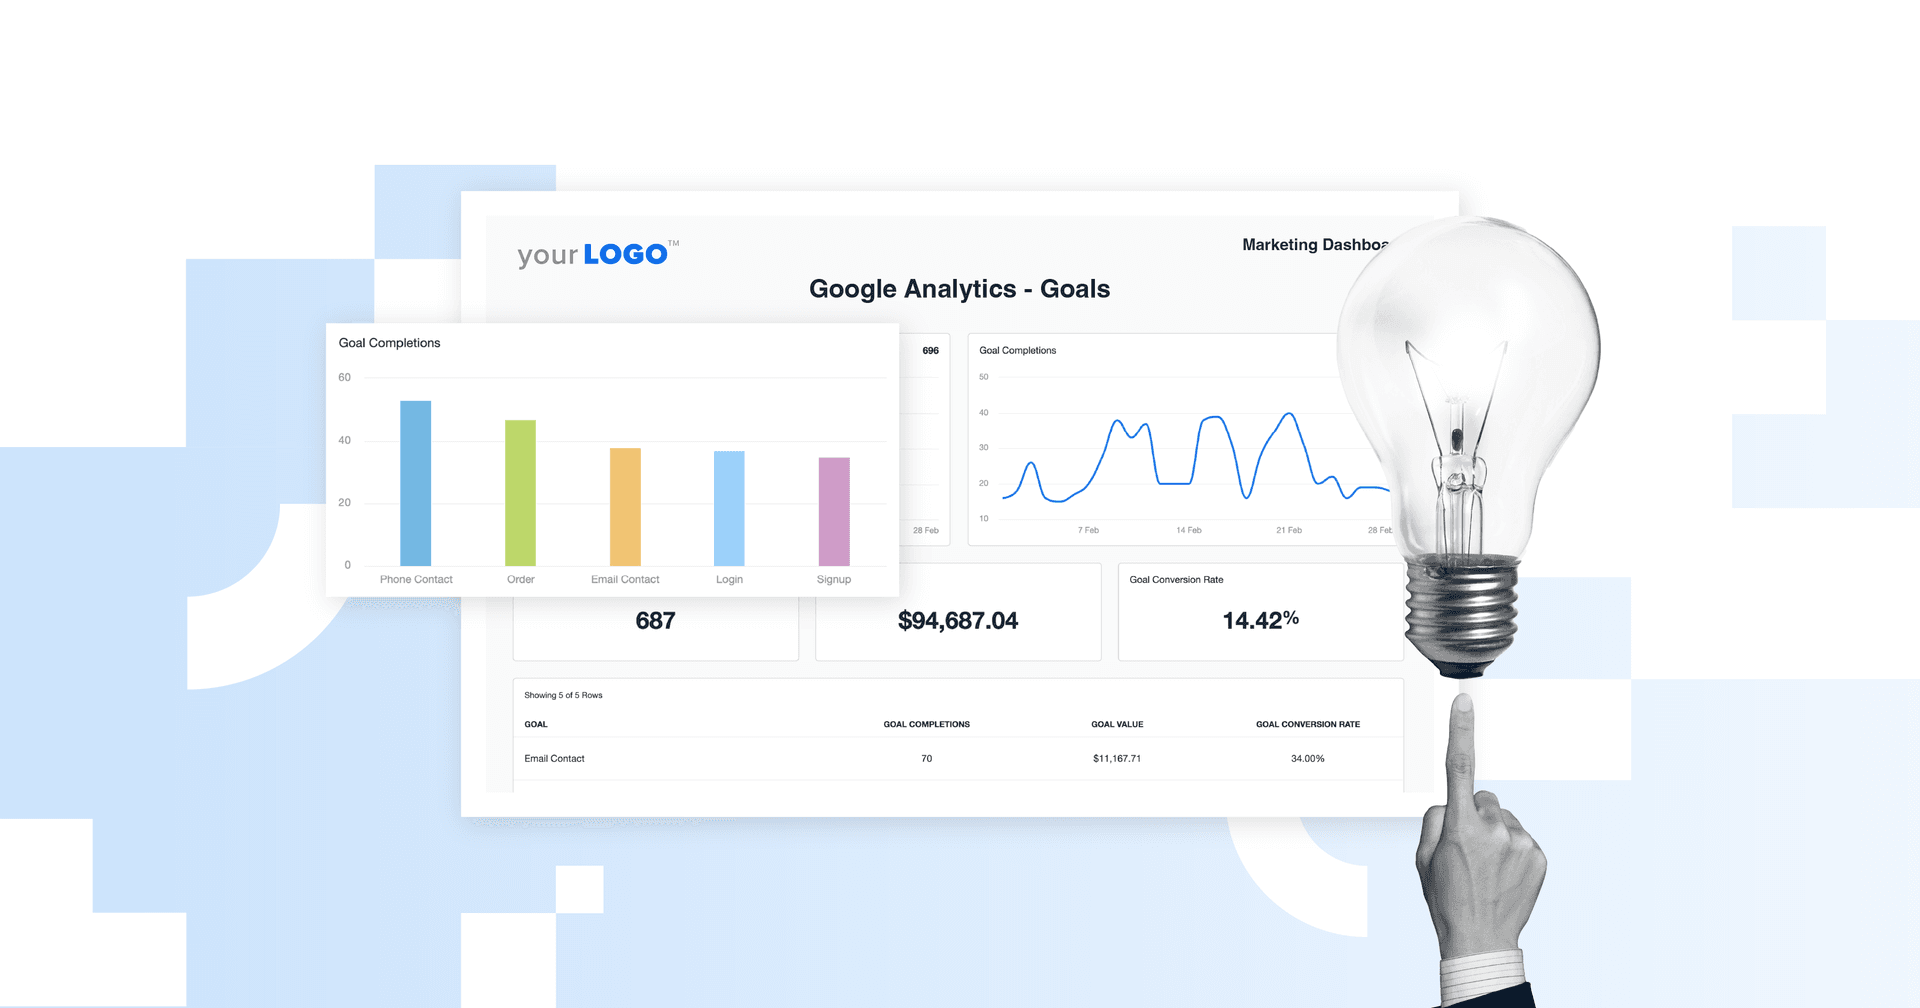
Use charts, graphs, or data visualizations to surface key insights quickly. A visual snapshot helps stakeholders digest performance without digging into every number.
Match Data to Goals
Filter and present aggregate metrics that speak directly to client objectives. Aligning data to KPIs like revenue, leads, or cost-efficiency keeps reports focused and relevant.
Professional reports help communicate the results of marketing campaigns, website performance, and other key metrics to stakeholders such as clients, management, and investors. This helps demonstrate the value of the work being done and provides a clear picture of progress towards goals and objectives.
Google Analytics 4 Dashboard Example
Related Integrations
How To Use Aggregate Data To Improve Marketing Insights
Aggregate Data helps marketers move beyond isolated metrics to uncover broader patterns, optimize performance, and make smarter decisions. When used correctly, data aggregation highlights what’s working, reveals overlooked opportunities, and sharpens overall strategy. Here are five practical ways to turn aggregated data into deeper marketing insights.
Detect Market Shifts
Aggregating engagement and conversion data over time helps spot changes in behavior—like seasonality, device preferences, or evolving search intent—before they become obvious at the granular level.
Validate Buyer Journeys
By combining data across touchpoints, it becomes easier to confirm how people actually move from awareness to conversion. This helps fine-tune funnel stages and optimize content timing.
Refine Audience Segmentation
Use aggregated data to identify shared traits across high-converting audiences—like device usage, geography, or referral source—then tailor segments based on real performance, not assumptions.
Related Blog Posts
See how 7,000+ marketing agencies help clients win
Free 14-day trial. No credit card required.


