Table of Contents
QUICK SUMMARY:
Conversion rate is a key metric for evaluating the effectiveness of digital campaigns since it reveals how often visitors complete desired actions. However, these rates vary significantly across industries and platforms. This guide outlines median conversion rates for platforms like Google Ads, LinkedIn Ads, and TikTok Ads, based on data from 150,000+ campaigns on the AgencyAnalytics platform. Use these benchmarks to evaluate client performance, identify areas for improvement, and drive better results.
Conversion rate is the ultimate measure of whether marketing efforts turn clicks into actual results–leads, sign-ups, sales, you name it. But here’s the catch: Without a solid benchmark, it’s hard to know if a site’s conversion rate is solid or slipping behind the competition.
Industry benchmarks provide a clear baseline to measure against, helping your agency identify what’s working… and what’s not. Whether you're trying to boost ecommerce conversion rates on Google Ads or a TikTok Ads online store conversion rate, this data helps uncover real growth opportunities.
Curious how your client campaigns stack up? This guide breaks down conversion rate benchmarks from 150,000+ marketing campaigns, providing the clarity you need to fine-tune strategies and enhance performance.
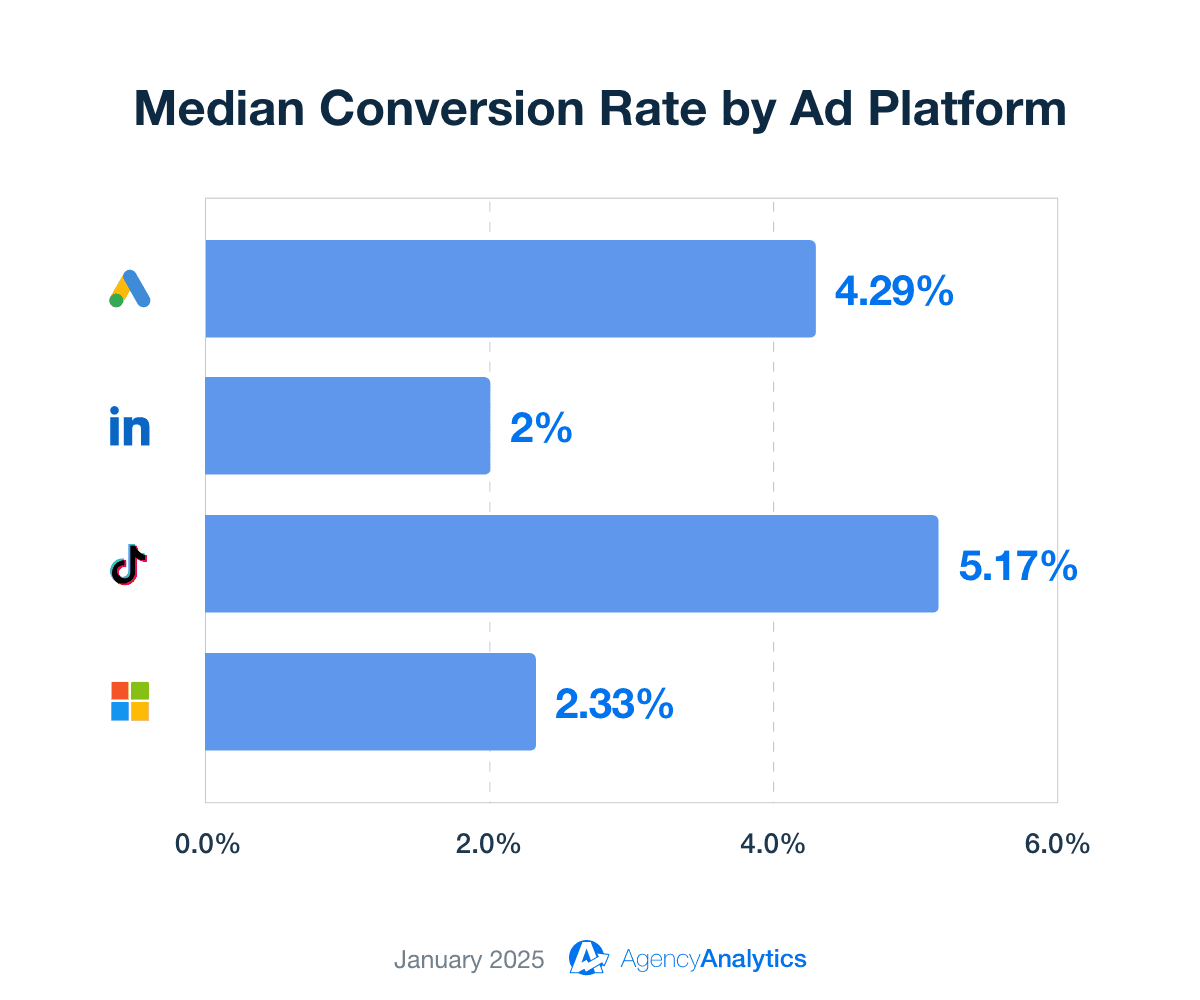
Here’s a quick look at where the benchmarks stand:
Google Ads: 4.29% – Capturing high-intent users with search-driven strategies.
LinkedIn Ads: 2% – Reaching decision-makers in professional niches.
TikTok Ads: 5.17% – Engaging users with creative, video-first campaigns.
Microsoft Ads: 2.33% – Leveraging less competitive, high-value search traffic.
Keep reading as we explore first-party benchmarking data derived from the AgencyAnalytics platform. The best part? It’s reliably sourced from over 7,000 marketing agency professionals like you.
Why Conversion Rate Matters
Conversion rate measures the percentage of users who take a desired action, such as completing a purchase, filling out a form, or signing up for a service. It’s a solid indicator of campaign performance, providing deeper insight into how effectively an ad or landing page drives user actions.
A high conversion rate typically indicates that your client’s marketing strategy, audience targeting, and user experience are on point. On the other hand, a low conversion rate suggests issues with demographic relevance, ad copy, or landing page design.
By tracking conversion rate, agencies identify what’s working, pinpoint areas for improvement, and optimize campaigns to achieve ROI for clients.
The Value of Conversion Rate Benchmarks by Industry
Industry benchmarks set a foundation for assessing conversion rates on a macro level. This helps agencies determine whether client campaigns are performing as they should. If ad results are lagging behind, it’s a sign to make strategic improvements (e.g., creating better offers or adding more CTAs on a landing page).
That said, you’ll need more than generic benchmarks to make informed decisions. It’s exactly why we’ve analyzed our extensive database of 150,000+ campaigns to provide real-world insights specific to agency needs.
Below, we dive into the nuances of benchmarks, their role in shaping ad strategies, and what makes our data uniquely actionable.
Average vs. Median Values: Which Is More Relevant?
The terms “average” and “median” belong to the same family, but they serve different purposes. Wondering what’s the difference? Here’s a breakdown:
An average is calculated by summing all values and dividing by the total number. While it provides a general sense of performance, averages may be skewed by outliers (i.e., exceptionally high or low conversion rates). Therefore, they’re often less reliable in understanding typical performance.
On the other hand, a median value represents the middle value when all data points are arranged in order. Medians eliminate the impact of outliers, offering a clearer picture of what’s "typical" across campaigns.
AgencyAnalytics uses median benchmark values because they provide a more accurate representation of industry norms–particularly when working with large datasets. While industry leaders may seek averages out of habit, medians tend to be more actionable. That’s because they reflect the true center of performance.
Common Misconceptions About Conversion Rate Benchmarks
Conversion rate benchmarks are essential for gauging performance, but they’re not one-size-fits-all. Misunderstanding their purpose could result in poorly aligned strategies or inaccurate conclusions.
To avoid this from happening, here are a few misconceptions to be aware of:
Benchmarks Are Universally Applicable: Many digital marketers may think benchmarks apply to every campaign. However, context is key–industry, audience, and goals significantly impact these numbers.
Meeting Benchmarks Equals Success: Exceeding a benchmark doesn’t always mean a campaign is thriving. For example, a high number of leads may look good on paper. However, it won’t mean much if they’re not qualified or part of your client’s target market.
Benchmarks Are Fixed Targets: Some marketers see benchmarks as static goals. However, they change with trends, consumer behavior, and technology. Therefore, agencies must monitor these markers to ensure accurate comparisons.
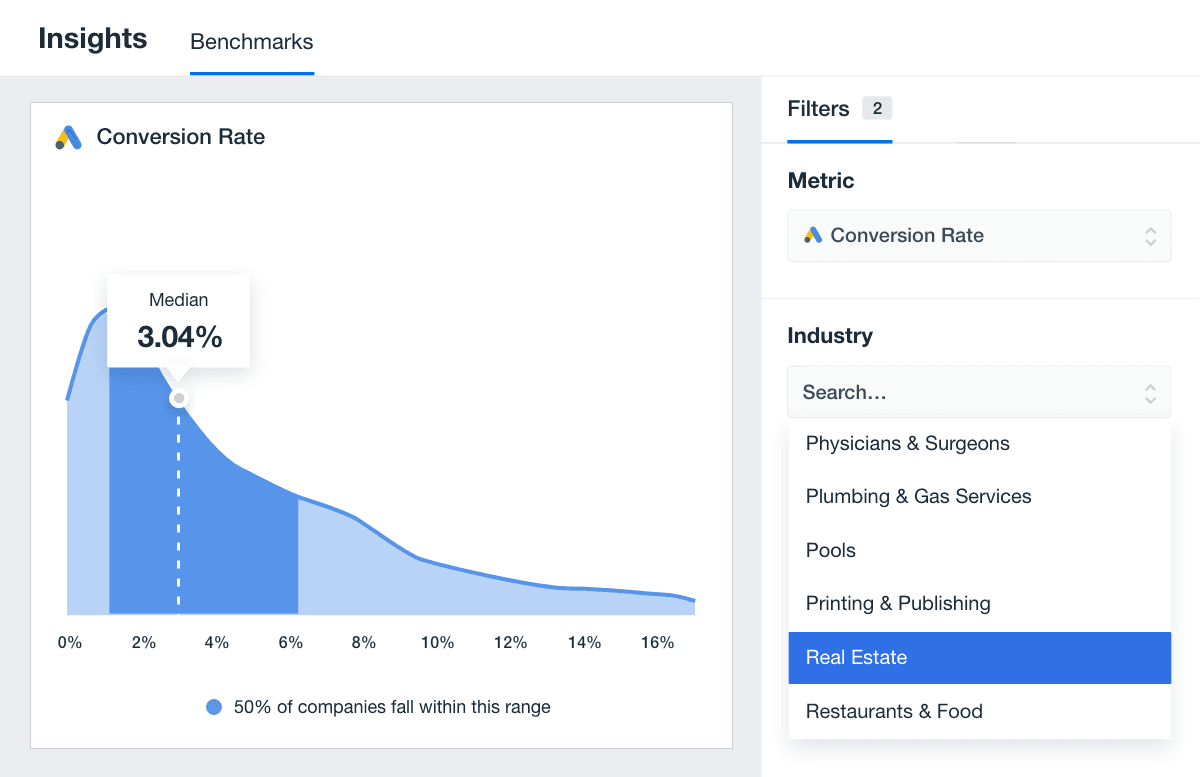
No need for multiple analytics tools. Analyze average conversion rates by industry, access smart insights via Ask AI, and more–try AgencyAnalytics today, free for 14 days.
To sum it up, benchmarks guide decision-making, but they shouldn’t dictate it. It’s important to consider the bigger picture, understand limitations, and adapt to market changes when necessary.
Average Conversion Rate by Ad Platform
Conversion rates tend to vary by platform, mainly due to user intent, placement, and ad spend (among other factors). Therefore, agencies must consider these nuances and optimize campaigns based on platform-specific insights.
Here’s a detailed breakdown of median conversion rates by ad platform and what they mean for client campaigns.
Average Conversion Rate for Google Ads
The average conversion rate for Google Ads is 4.29%. This reflects the platform’s strength in capturing high-intent traffic–particularly through paid search ads–where users actively look for products or services.
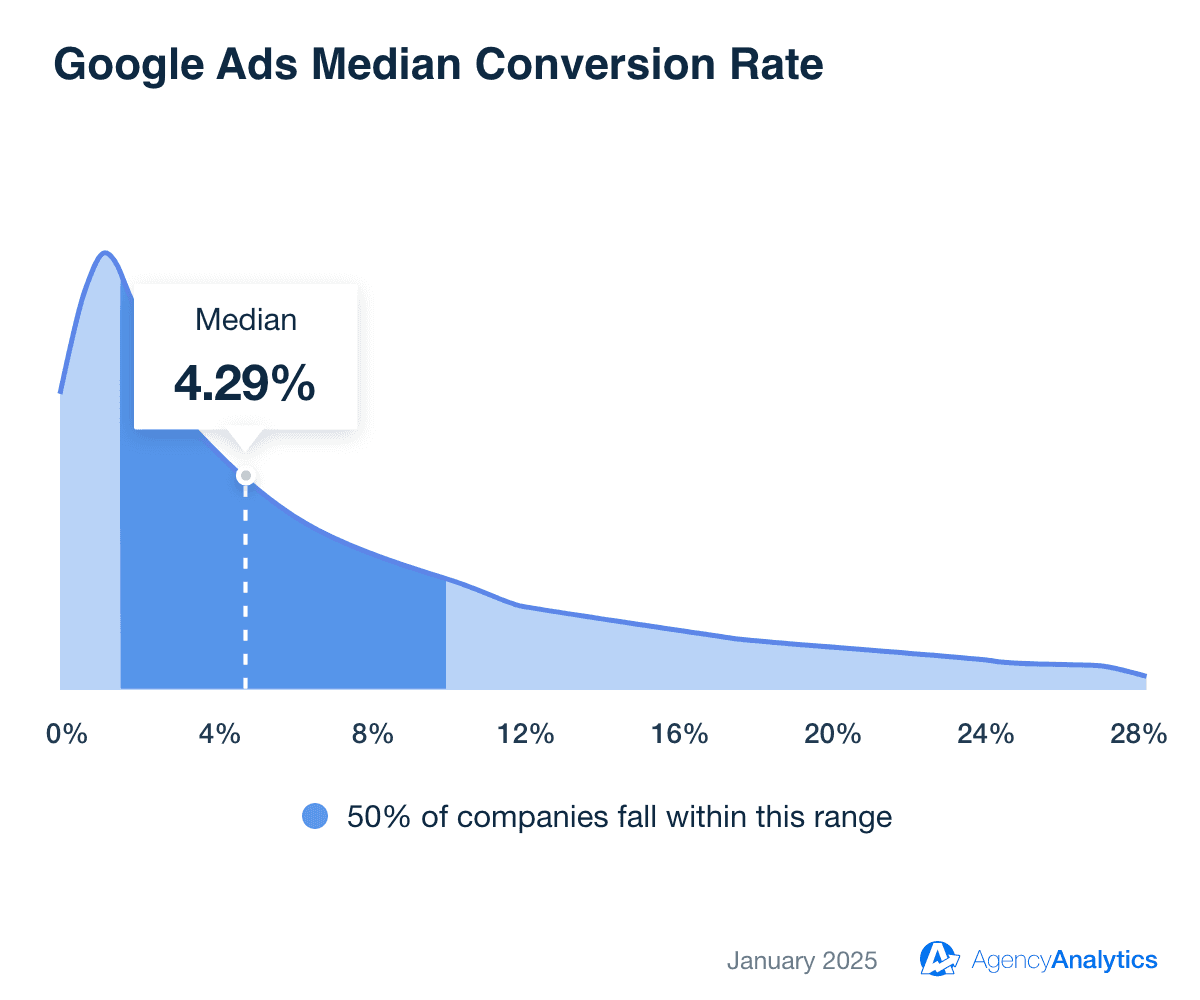
Seamlessly incorporate benchmarks into your Google Ads dashboard or Google Ads report template. Explore AgencyAnalytics today, free for 14 days.
To improve a lower conversion rate, focus on high-intent keywords with strong commercial intent, such as “buy,” “get,” or “hire.” Also, use negative keywords to filter out irrelevant traffic (e.g., excluding the word “cheap” or “free” for luxury good search campaigns).
Additionally, explore Google’s automated bidding options like Target CPA or Target ROAS to optimize bids for conversions.
Average Conversion Rate for LinkedIn Ads
The average conversion rate for LinkedIn Ads is 2%. This reflects the platform’s focus on professional audiences, where users are often researching solutions, building connections, or considering business opportunities.
While this conversion rate seems lower compared to other platforms, LinkedIn excels at generating high-quality leads (especially for B2B campaigns).
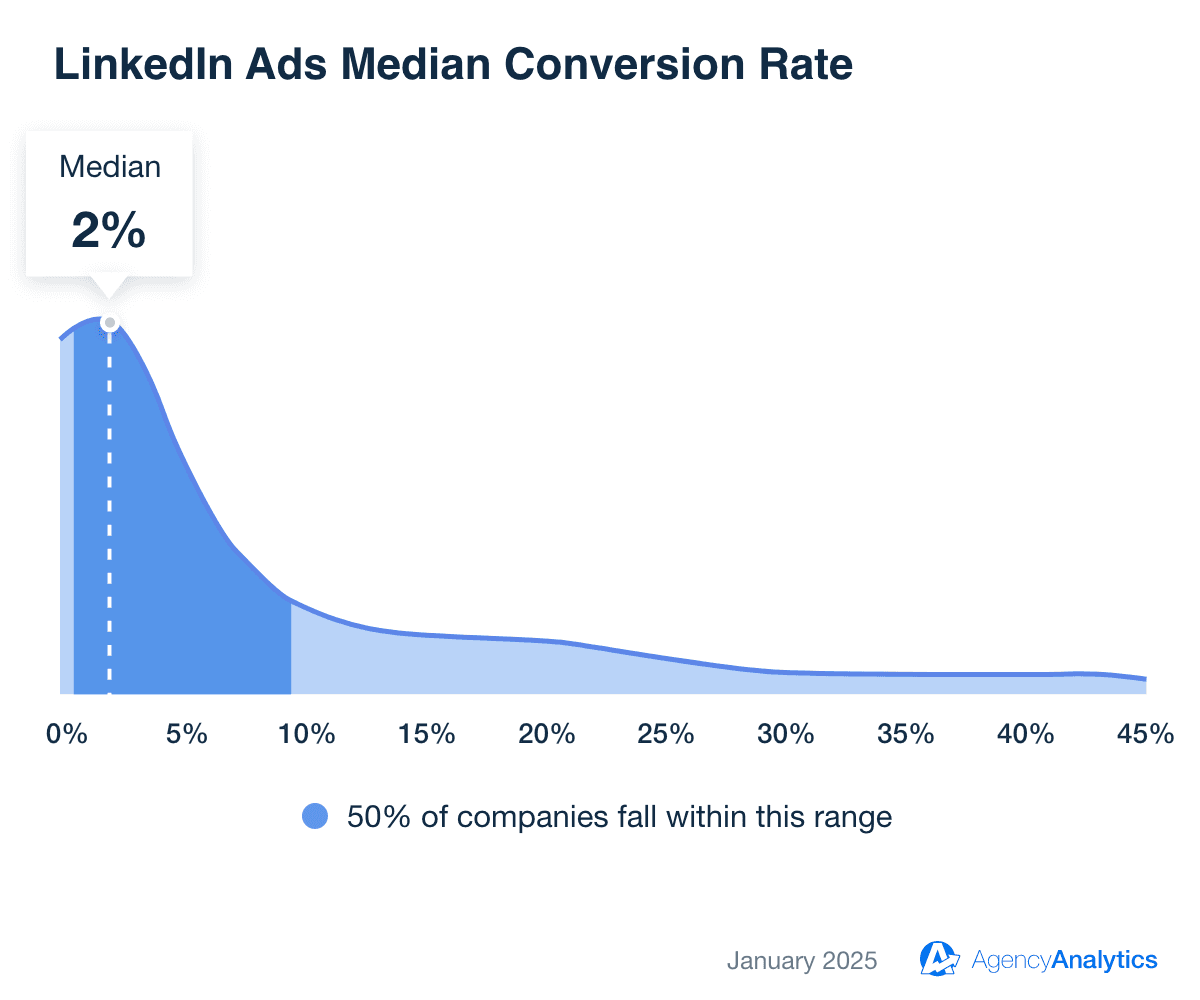
Share LinkedIn Ads benchmarks to show clients the bigger picture. Add these insights to any LinkedIn Ads dashboard or LinkedIn report on the AgencyAnalytics platform–sign up for a free 14-day trial today.
To improve conversion rates, use LinkedIn’s robust targeting options–such as job titles, industries, company size, and seniority–to reach decision-makers most likely to convert.
When applicable, use LinkedIn’s native Lead Gen Forms to auto-populate user information, simplify the conversion process, and reduce friction.
Average Conversion Rate for TikTok Ads
The average conversion rate for TikTok Ads is 5.17%. This higher conversion rate reflects TikTok’s ability to engage users with creative, short-form video content that captures attention quickly.
Additionally, this platform thrives on authentic, entertaining, and visually impactful ads. It’s an excellent choice for driving conversions among younger, highly engaged audiences.
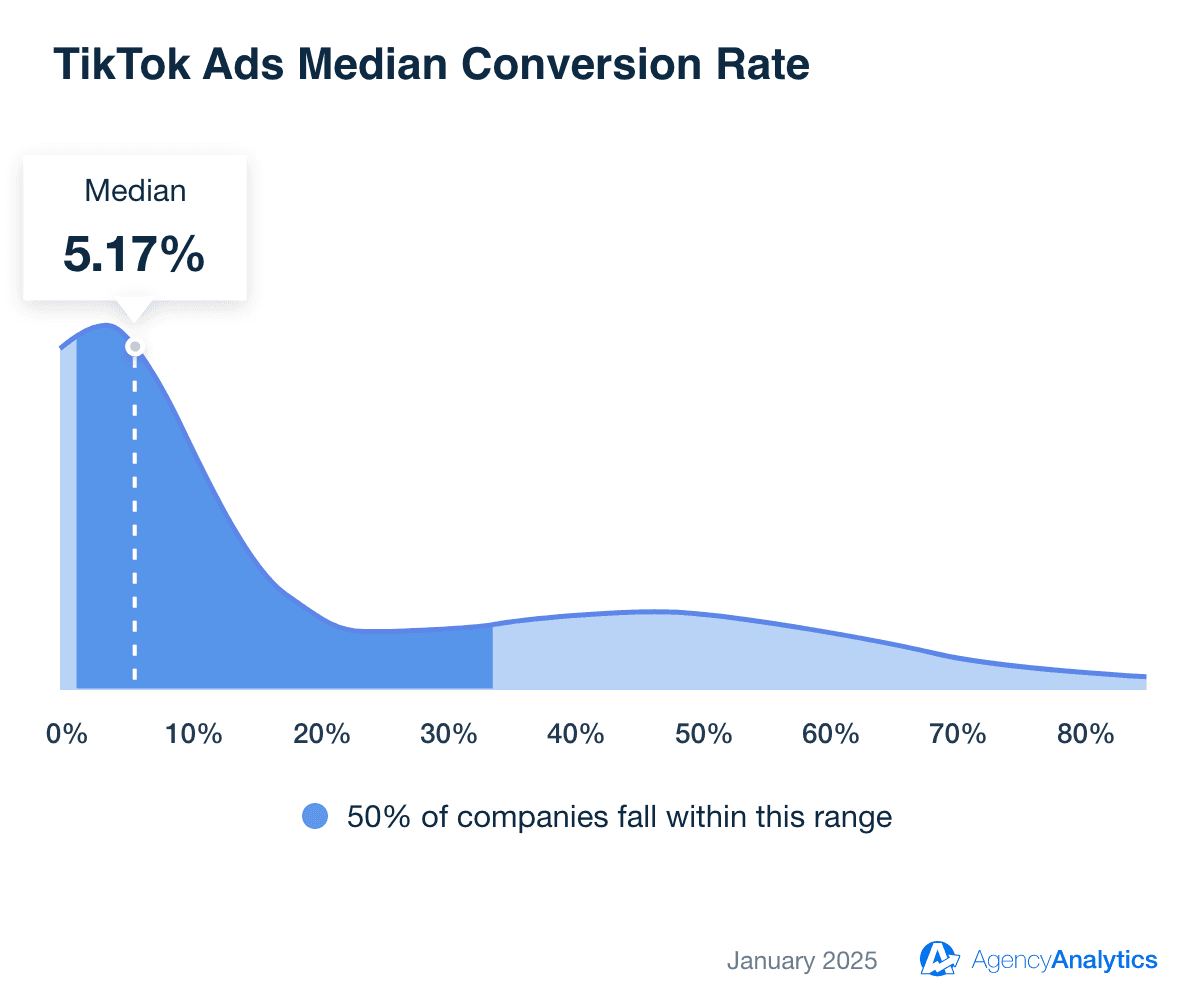
Easily include these benchmarks in your TikTok Ads dashboard or TikTok Ads report template to optimize campaigns. Try AgencyAnalytics today–it’s free for 14 days.
For best results, create ads that align with current TikTok trends, challenges, or popular sounds to increase engagement. Utilize TikTok's video templates, effects, and music library to create high-quality, platform-native content.
Additionally, sustain attention by hooking users in the first few seconds (e.g., using bold text overlays, eye-catching visuals, or a question that sparks curiosity). Pair this with clear CTAs like “Shop Now” or “Learn More” to drive conversions effectively.
Average Conversion Rate for Microsoft Ads
The average conversion rate for Microsoft Ads is 2.33%. This reflects the platform’s ability to reach a high-intent target audience–often through desktop searches–making it a valuable channel for targeting professionals and older demographics.
Microsoft Ads also benefit from less competition than Google Ads, resulting in more cost-effective conversions for certain industries.
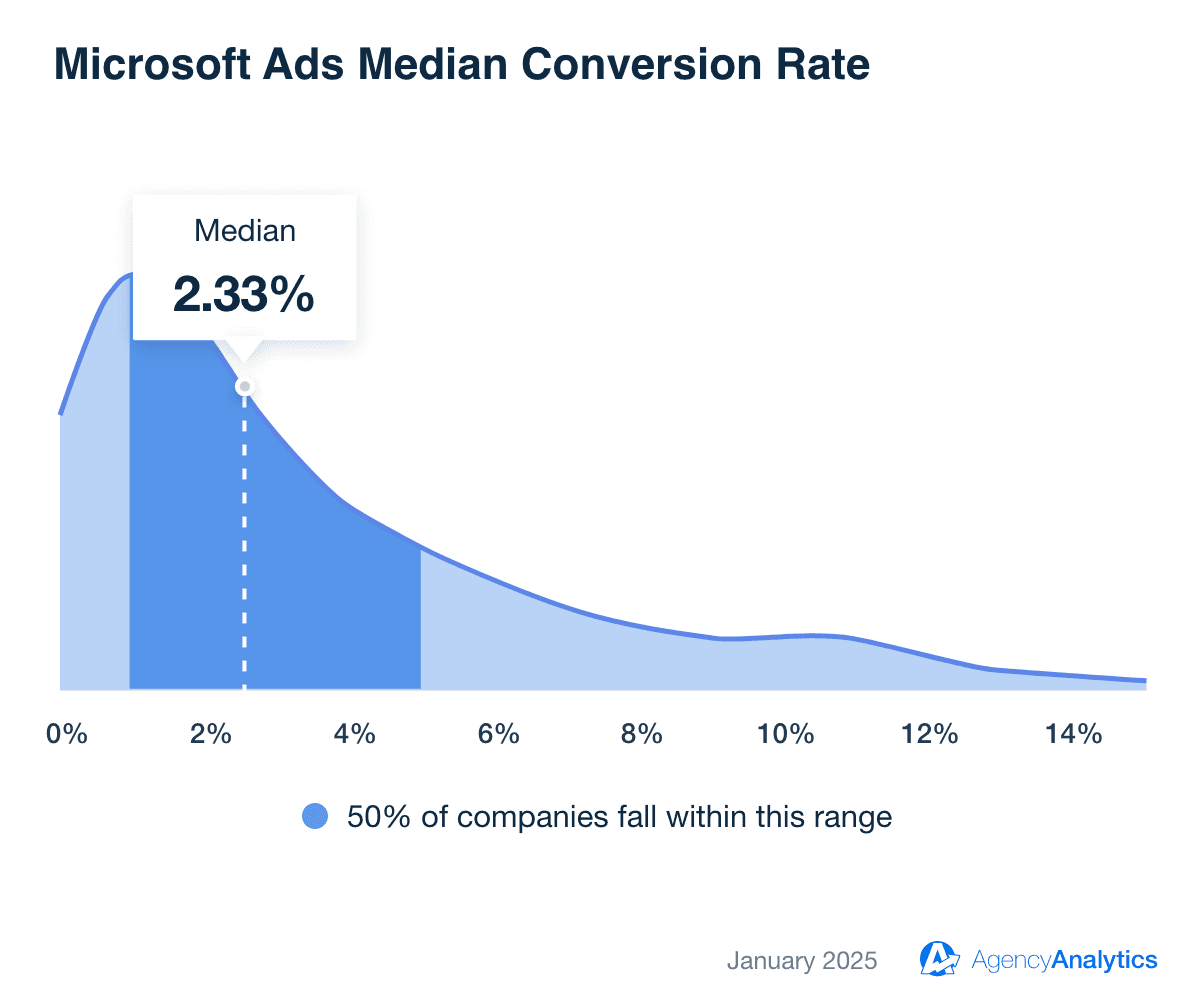
In a few clicks, add industry benchmarks to your Microsoft Ads dashboard or Microsoft Ads report template. Check it out on AgencyAnalytics–sign up for a free 14-day trial.
To get the most from conversion-oriented Microsoft Ads campaigns, prioritize keywords with strong commercial intent. This will be particularly important for industries like finance, healthcare, and B2B services.
Also, consider increasing bids for desktop users, as they may represent a larger share of your client’s Microsoft Ads traffic. To make well-informed decisions, analyze demographics, consider historical data (e.g., desktop conversion rates over a fixed period), and identify the most effective targeting approach.
Impress clients and save hours with custom, automated reporting.
Join 7,000+ agencies that create reports in under 30 minutes per client using AgencyAnalytics. Get started for free. No credit card required.
How To Interpret Conversion Rate Benchmarks
Conversion rate benchmarks offer valuable context for assessing client results, but they require careful interpretation. Even if you’ve achieved the highest average conversion rates, it won’t mean much if they don’t align with your client’s broader goals.
Below, we’ll explore how to analyze conversion rates and what they mean for a client’s overall campaign performance.
When a Low Conversion Rate Isn’t Always Bad
A low conversion rate might seem like a red flag at first glance, but it doesn’t always signal underperformance.
That’s because some industries or campaign types naturally have lower conversion rates due to longer sales cycles or high-ticket products. For example, a B2B campaign might prioritize lead generation over a high ecommerce conversion rate (at least in the early phases).
Some campaigns also target larger audiences to drive mass brand recognition. In these cases, conversions may not be an initial priority, especially if prospects need nurturing or more time to progress through the sales funnel.
When a High Conversion Rate Might Signal Potential Problems
While a high conversion rate often appears to indicate success, it could mask underlying issues.
For instance, say a landing page has an exceptionally high conversion rate but low lead quality. This could be a result of overly broad targeting criteria, low-cost incentives that attract unqualified prospects, or unclear CTAs that prompt accidental conversions.
Take another example. Imagine a retail client who decided to offer significant discounts with the goal of attracting more buyers. While their average ecommerce conversion rate was high, profit margins suffered, and the average order value dropped significantly. What looked like a “good” conversion rate actually ended up costing their business.
In both scenarios, solely focusing on ecommerce conversion rate benchmarks is misleading. Instead, agencies should analyze the downstream impact of conversions, ensuring results are both meaningful and sustainable.
Using Benchmarks To Identify Opportunities for Optimization
Benchmarks act like a health check for client campaigns, helping pinpoint areas that could use fine-tuning.
By comparing your client’s performance to industry benchmarks, you’ll uncover exactly what might need adjustment. For example, it may mean:
Improving Page Performance: A lower-than-average landing page conversion rate may indicate that the design, copy, or CTA needs tweaking.
Addressing Ad Configuration Issues: Higher Google Analytics traffic but lower-than-average conversions may signal problems with targeting or ad messaging.
Optimizing for Mobile Users: Low conversion rates on mobile devices could point to slow load times, difficult navigation, or unclear CTAs on smaller screens.
Focusing on High CLV Opportunities: Say your client has a lower-than-average conversion rate but a strong customer lifetime value (CLV). This may prompt your agency to prioritize existing customers through remarketing, loyalty programs, or upsells.
By analyzing benchmarks alongside other key performance indicators, you’ll identify inefficiencies and prioritize optimizations with the greatest impact.
Tips for Improving Conversion Rate
Conversion rate optimization means factoring in controllable elements while adapting to external influences. To summarize, here are some key actionable tips to consider.
Strategy | Details |
|---|---|
Craft Effective Headlines and CTAs | Use clear, benefit-driven language and urgency (e.g., “Claim Your Free Trial Today” instead of “Learn More.”) |
Test Creative Formats | Experiment with videos, carousels, or platform-specific formats to find what resonates with the audience. |
Refine Audience Targeting | Segment audiences by demographics, behaviors, and past performance to reach the right users. |
Leverage A/B Testing | Test individual elements (like different CTAs or visuals on ecommerce websites) to figure out what works best. |
Optimize Landing Pages | Ensure landing pages are fast, aligned with ad messaging, and designed for mobile usage. This may significantly boost conversions and customer interactions. |
Analyze Conversion Data | Review conversion metrics regularly to identify trends and uncover insights. Use other analytics tools (like Google Analytics) to assess conversions across all traffic sources. |
By implementing these strategies, agencies will take a proactive approach to improving conversion rates. Remember—successful optimization is an ongoing process of testing, analyzing, and refining. Consider using AI conversion rate optimization methods to speed up time to results.
Using Benchmarks to Position Your Marketing Agency
Reporting on conversion benchmarks gives agencies a clear advantage.
To sum it up, sharing industry standards builds trust and shows that you’re focused on tangible results, like improving conversion rates or optimizing the sales process.
Using reliable benchmarks–like those from AgencyAnalytics–offers insights backed by relevant marketing campaigns. This reassures clients that your recommendations are grounded in actual data, not guesswork.
By positioning your agency as a data-savvy partner, you’ll build client trust, demonstrate expertise, and pave the way for stronger client relationships.

Written by
Faryal Khan is a multidisciplinary creative with 10+ years of experience in marketing and communications. Drawing on her background in statistics and psychology, she fuses storytelling with data to craft narratives that both inform and inspire.
Read more posts by Faryal KhanSee how 7,000+ marketing agencies help clients win
Free 14-day trial. No credit card required.


