- Chapter 1Why Is Client Reporting Important?
- Chapter 2Creating a Framework for Client Success
- Chapter 3What Is a KPI?
- Chapter 4The Key Differences Between KPIs vs Metrics
- Chapter 5Top Digital Marketing Metrics to Showcase Success
- Chapter 6What To Include in Client Reports
- Chapter 7Using Data Storytelling in Client Reports
- What Is Data Storytelling, Anyway?
- Why Is Data Storytelling Important?
- How To Be an Exceptional Data Storyteller
- How Creative Click Media Tells Engaging Data Stories for Their 70+ Clients
- Data Storytelling With AgencyAnalytics Reporting Tools
- Chapter 8How To Use Automated Client Reporting To Reclaim Billable Hours
- Chapter 9Advanced Client Reporting Strategies & Best Practices
- Chapter 10Buying vs. Building a Reporting Platform
Data storytelling is the art of turning numbers into narratives, unlocking a world of insights and possibilities.
You don't have to be a data scientist to tell a good data story; with the right automated reporting tool, leveraging data and crafting a narrative that helps your agency effectively communicate powerful insights is easy.
Let's consider a scenario where a marketing agency is providing monthly reports to their client, a retail business. These reports detail the performance of social media, PPC, and SEO campaigns. But the report includes a jumble of metrics such as impressions, clicks, likes, shares, comments, and more.
Despite having some knowledge of digital marketing, the client finds it challenging to interpret the data, as it is presented in a purely analytical format with no clear narrative or context. This leads to confusion and dissatisfaction, with the client unable to understand the impact of the agency's efforts and their return on investment.
Can you say churn risk?
And Now, the Data Storytelling Approach
Let’s imagine that the same marketing agency decides to shift to a data storytelling approach to improve the client reporting process and help their client make informed decisions.
They begin by focusing on the business objectives of the client and identifying the key performance indicators (KPIs) that are relevant to those goals. The agency then starts collecting data that is both relevant and actionable, taking into account factors such as audience demographics, seasonality, and marketing budget.
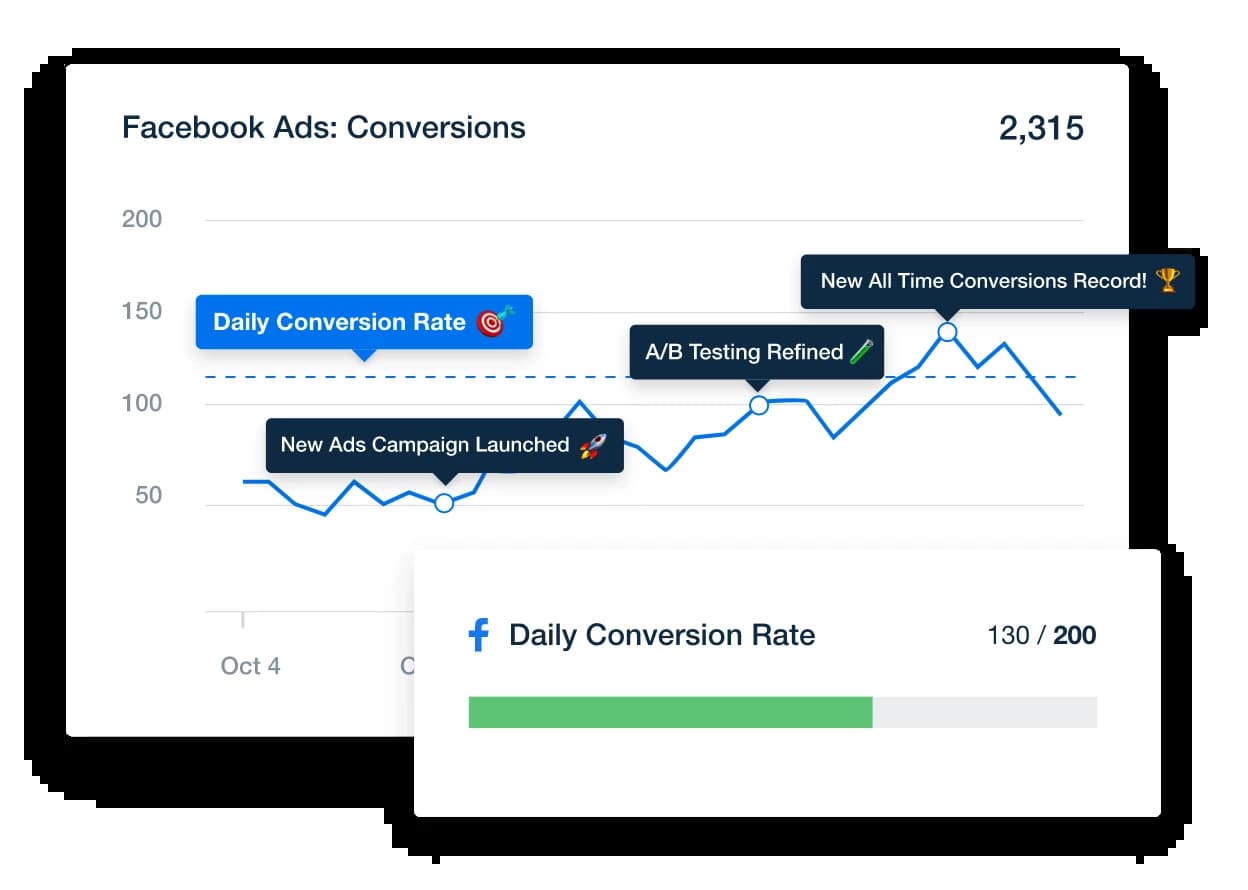
Using this data, the agency creates a narrative that helps the client understand the bigger picture of their digital marketing campaigns. They use visual aids–such as charts and graphs–to highlight key trends and illustrate how their efforts have impacted the client’s business. For example, they may use a line graph to show the increase in website traffic over time or a goal tracking widget to show the total revenue generated from organic traffic so far this month.
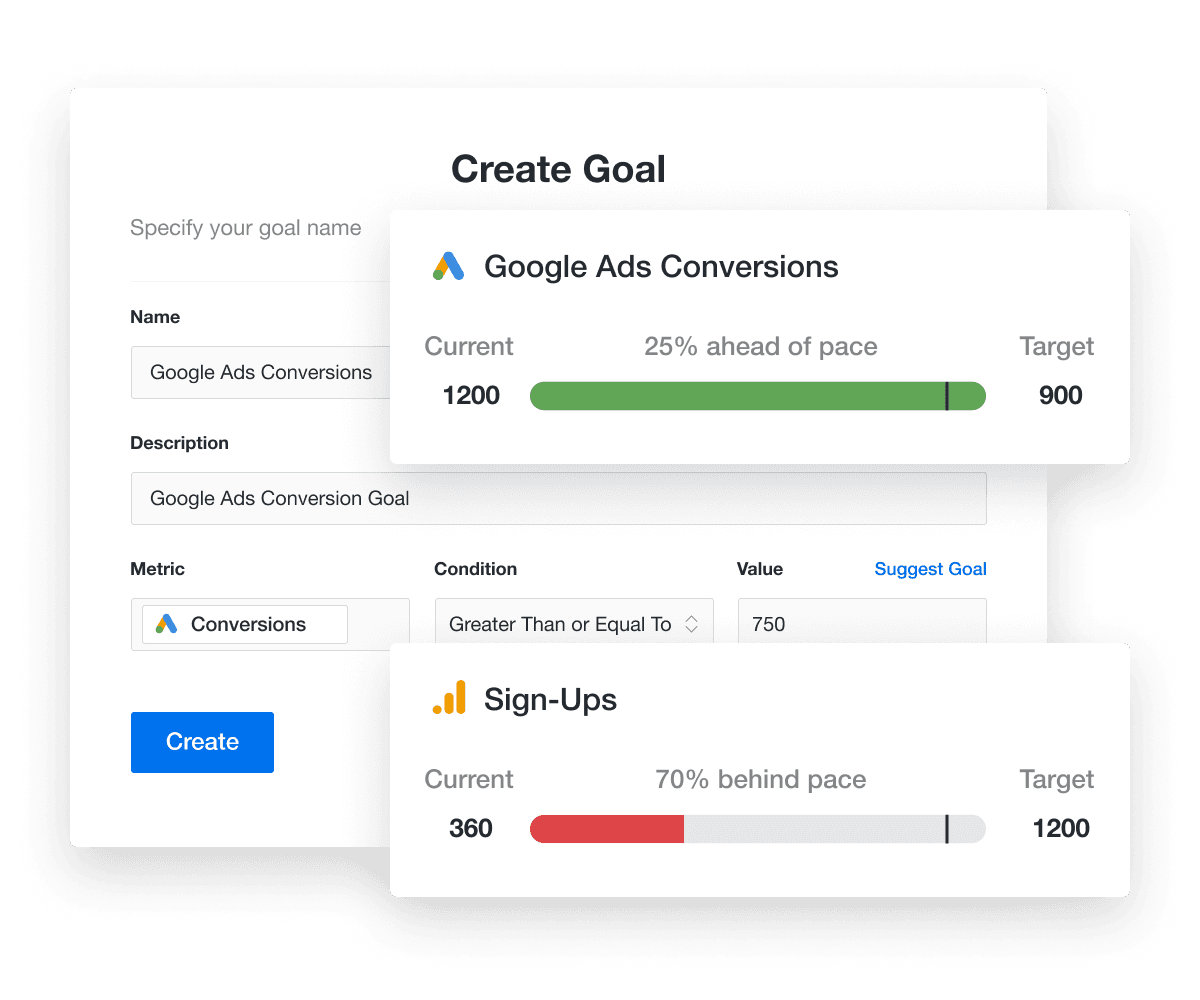
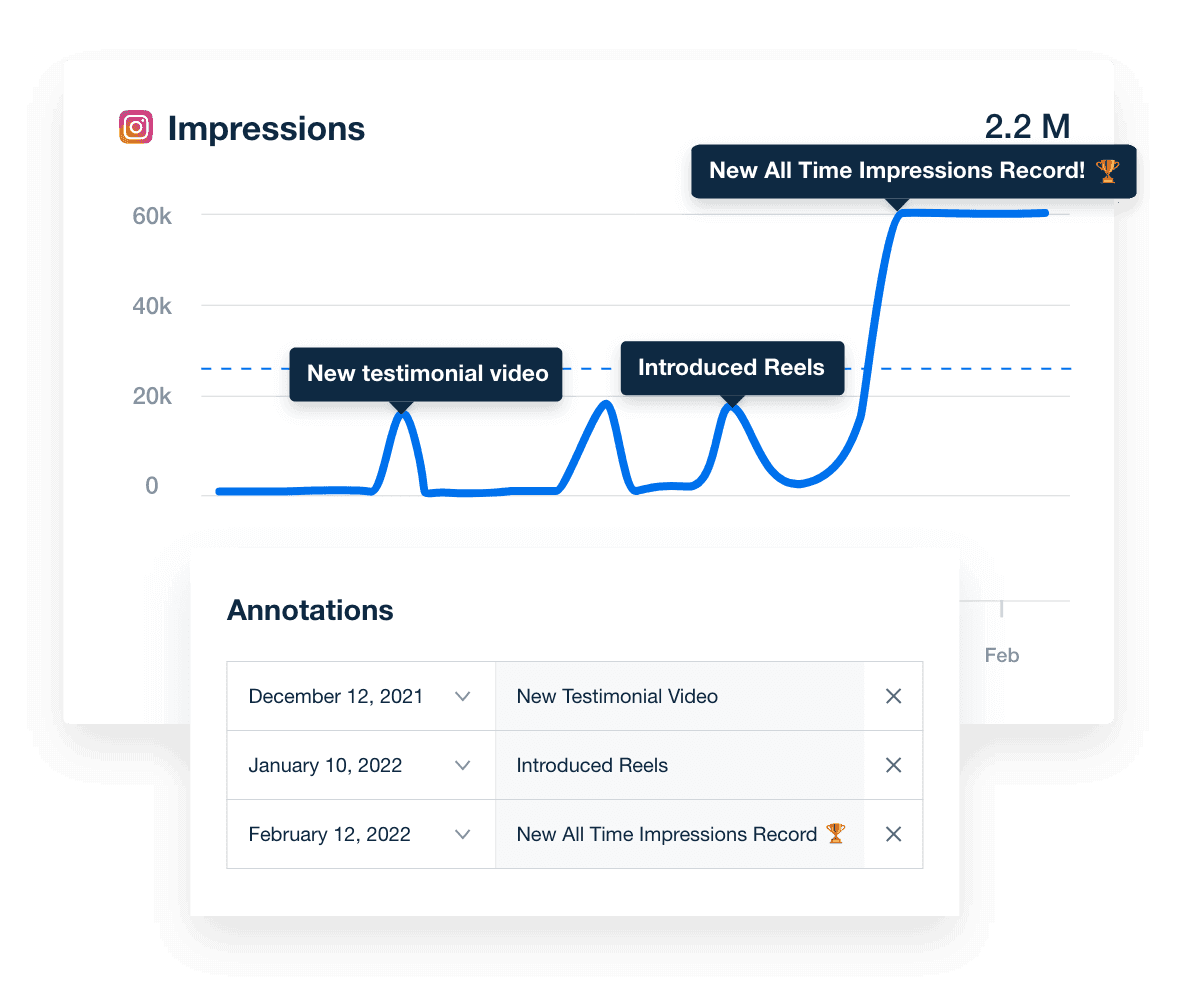
The agency also incorporates storytelling techniques to make the data more relatable and engaging. They may use annotations to highlight the significant changes in their social media campaigns.
Using a data storytelling approach, the marketing agency provides a clear narrative that helps the client understand the impact of the marketing agency’s efforts.
This approach makes the reports easier to understand and helps the client appreciate the value of the agency's efforts. The client is now able to make informed decisions based on the data provided, leading to a stronger working relationship between the client and the agency. As a result, the client is more likely to renew their contract and recommend the agency to others, turning the reports into a powerful client retention tool.
What Is Data Storytelling, Anyway?
Simply put, data storytelling is the process of framing data in a way that is easy to understand and engaging. It is used to illustrate trends or patterns or to explain complex concepts. By using graphs, charts, and other visuals, data storytelling helps make data more interesting and accessible to clients who are less familiar with technical marketing figures.
Unfortunately, even with Business Intelligence (BI) and analytics tools, extracting meaningful insights to make better business decisions remains a challenge for many organizations.
Reports need to tell a story in a simple and visual way. We needed something that was going to connect with a lot of different channels and tools, and we needed the confidence it was going to pull the correct data.
Brian Ferritto, Partner, 42connect
Marketing agencies not only need to extract value from raw data but also effectively communicate those insights to clients and stakeholders. Since many clients may not have technical expertise (they aren't data scientists, after all), these insights need to be communicated in a professional yet understandable manner.
Telling a compelling data story might sound relatively easy, but many marketers and data analysts find it hard to use an engaging tone and create a narrative in their reporting. The reality is that most businesses overlook this aspect of client reporting.
Data analytics and reporting are critical components in building the client relationship. After all, insights alone yield little value to the client if you don't combine them with a story that conveys the significance of the data. Data storytelling is an essential skill every marketing agency needs to adopt to build transparency and improve client communication.
The Role of Data Storytelling in Client Reporting
As discussed in our Client Reporting eBook, data storytelling takes raw data, analyzes it, and communicates its significance to clients. This is accomplished with the help of three core components: data, visualization, and narrative.
Data
The first element of storytelling requires that you have accurate and up-to-date data. One of the main benefits of an all-in-one reporting platform is that data is automatically pulled from various marketing platforms, saving time and preventing human error in data collection. Once the data is collected and cleaned, it is analyzed using statistics, benchmarks, targets, and algorithms to extract key insights.
Unfolding the narrative hidden within heaps of data calls for a masterful combination of discrete and continuous data. Discrete data gives us countable, tangible milestones-like website visits or sales figures. On the other hand, continuous data presents ever-changing, detailed context–think percentages or time-variant statistics. When it comes to data storytelling, our plot thrives on the interplay between discrete and continuous data, painting a nuanced, complete picture that brings the numbers to life.
Visualization
Data visualization represents data using graphs, charts, and other visual elements to convey information. Data visualization tools are key to discovering and communicating underlying trends, patterns, and outliers in a given dataset. Ultimately, the goal of visualization is to uncover trends that may have been missed with a standard reporting spreadsheet and convey that information comprehensibly.
Narrative
Finally, providing a narrative alongside insights and visualization allows analysts and marketers to highlight the significance of specific marketing metrics, KPIs, or changes that may have occurred during the reporting period. This is your agency's chance to showcase what is happening, provide your unique insights into why, and explain how you plan to make the data actionable. It can be done through a report summary or simple comments and annotations attached to key data insights.
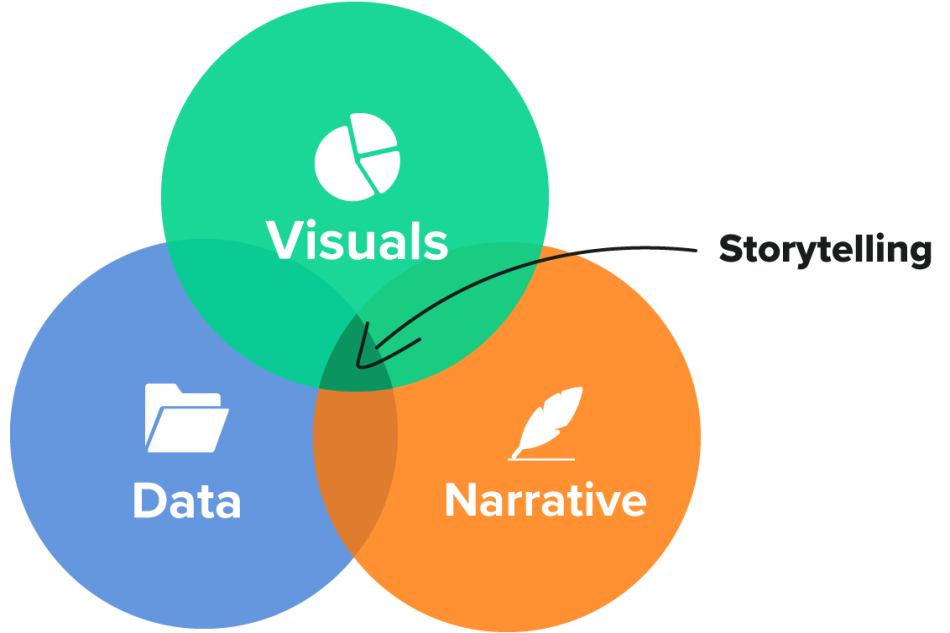
Combining these three elements in your client reporting allows you to build a level of trust and transparency by communicating results in a way that anyone can understand, regardless of technical expertise.
It's our job to tell a simple story through reporting to our clients. The report is the client's proof that what we are doing is benefiting their business in a positive way. Using AgencyAnalytics allows us to quickly create beautiful reports that tell a story in a way our client can understand.
Brian Ferritto, Partner, 42connect
Data Stories vs. Data Visualizations
Traditional static reports are on the decline. Increasingly, marketing agencies are looking to data storytelling to help them make better decisions and provide better reporting to their clients.
Data stories and data visualizations are two ways of representing data that are often used interchangeably. However, there are some key differences between the two:
A good data story is like a regular story but has extra information to help explain what is happening. They often tell stories in the traditional format of having a beginning, middle, and end.
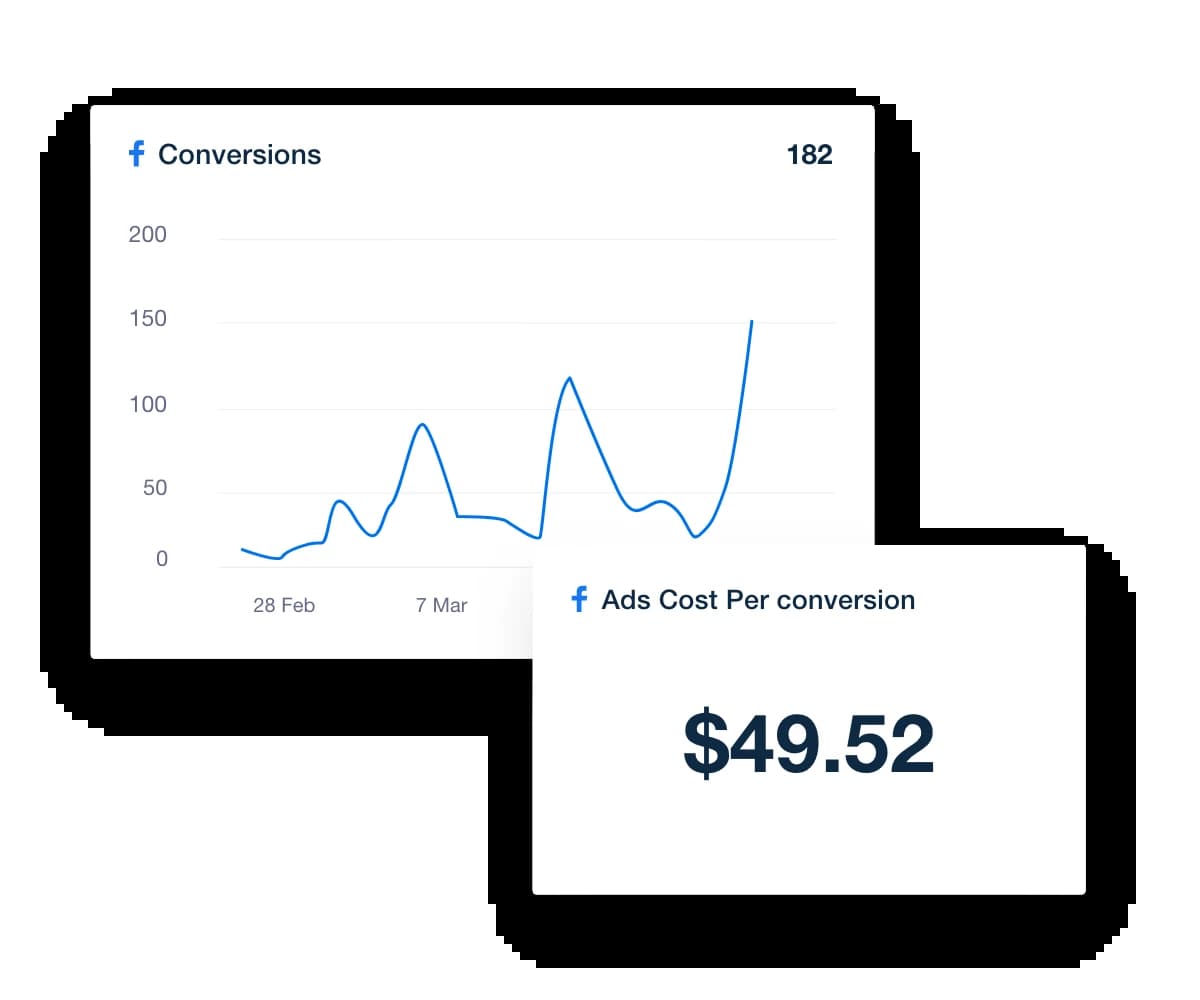
Data visualization is a graphic representation of data that can be used to highlight trends or patterns. Visual tools such as bars, charts, and graphs help explain the data story and are usually more focused on the raw data itself. Although data visualizations can be used to tell a story, they are often more about exploring and understanding the data than conveying a specific message.
Both data stories and data visualizations have their strengths and weaknesses. Data stories are good for conveying complex information in an easily understandable way. They can also be used to tell a persuasive story that motivates people to take action.
I know how much our clients want an easy-to-digest, visual format of just the most important information.
Lane Anderson, Founder & CEO, London Road Marketing
On the other hand, data visualizations help the reader absorb, digest, and understand complex data points faster and easier than if the same data was provided in a table or text format.
Data stories can be time-consuming to create, and they may require a lot of text and annotations to explain the data and the story behind the data. On the other hand, data visualizations are good for quickly conveying information and highlighting trends that might not be immediately obvious in the data. However, data visualizations may be difficult to create without the proper data tools, and they may not always be accurate.
AgencyAnalytics is one of the most essential tools we use as an agency. The reports we output and email to our clients have the data clearly visualized and look professional, giving our clients a report they can finally understand!
Brian Ferritto, Partner, 42connect
There is no one-size-fits-all answer to whether data stories, data visualizations, or a mix of both are better for conveying information. It depends on the specific situation, what type of information is being conveyed, and the intended audience.
Why Is Data Storytelling Important?
There are many methods to communicate data insights, although storytelling is an intrinsic human characteristic that allows you to blend the data-driven economy with visual and written communication.
Data storytelling is important because it allows for the effective communication of relevant data. When data analysis is communicated effectively, it improves decision-making, reinforcing your working relationship with your clients. This kind of data analysis also helps change people's behaviors and improve their understanding of complex issues.
We are able to pull together comprehensive yearly reports from multiple sources that allow us to tell the story of how ads have impacted the client’s business goals.
Tim Akers, Founder, Akers Digital
Before we discuss how to tell a good data story, let's review a few reasons why data storytelling is so important.
1. It’s a Powerful Competitor Analysis Model
First, if your client is in a highly competitive market, they're constantly at risk of losing potential customers to the competition. To draw a line between your client and the overall market, you want to identify competitive data insights from your campaigns and operations. Internal data allows you to tell a story about the brand’s personality and unique strategies that solve the target customer's pain points.
Telling stories with data is perfect for PR, and when done right, it increases brand recognition over competitors. In short, companies enhance the value of their products or services to their target audience with a data storytelling culture.
As an agency, competitor analysis helps reinforce that you've got your client's best interest in mind and are constantly monitoring what is happening within their niche.
2. It Boosts Client Communication & Engagement
While agencies use many strategies to collect and analyze data, maintaining an engaging conversation with clients for an extended period is a difficult task. Building effective client communication goes beyond copying and pasting as much information into a presentation as possible; you also want to use data storytelling to convey results intelligibly and demonstrate your services' value.
Although most of your clients will want to see the numbers connected to your efforts, the best agencies take that a step further and craft a compelling narrative that paints a clearer picture for their clients. Think of it as providing the “why,” “when,” “where,” and “how” to help explain the “what.” Having this information clearly spelled out encourages clients to ask questions and engage in discussion on a continual basis.
Beyond having reports automated, having our story clearly defined in the first week of each month leads to more efficient changes being made and quicker overall improvements to campaigns. Previously our clients told us of big agencies not delivering reporting until mid-month, by which point acting upon the data will only produce half a month of reporting that reflects that change on the next report.
Michael Wisby, CEO, Two Trees PPC
3. It Creates Visual Appeal
Humans are notorious for having an ever-shrinking attention span. Data storytelling with visuals communicates results at a glance. Visualizing data with elements like graphs, charts, and heatmaps creates visual appeal to the end user.
When interacting with your clients, you want to paint your agency as the most interesting and knowledgeable player in your field. Think about it from the client’s perspective: if you had to choose between a dull spreadsheet full of numbers, or a white-labeled and impeccably designed report featuring instantly understandable graphs and charts, which would you prefer?
Reporting shows our clients the results we achieve for them in an easy-to-understand visual. We provide monthly reminders of how we are helping their business grow with these reports.
Denise Bowen, Managing Director, WEB ROI
4. Data Storytelling Is Key to Data Science
The global big data market size is expected to grow from USD 138.9 billion in 2020 to USD 229.4 billion by 2025, representing a Compound Annual Growth Rate (CAGR) of 10.6%. However, as we’ve explored, it’s not enough to simply share the raw data with your clients. To truly make use of that data, many businesses will need experienced data storytellers to help them identify and communicate the metrics and KPIs essential for measuring growth.
Learning how to effectively leverage data storytelling in your client reports places your agency at the forefront of the data revolution because it demonstrates your strategic understanding of the client’s business–and helps them grasp the significance of the numbers.
AgencyAnalytics has changed the way that we do client reporting at Kite Media. It saves us time, is insanely convenient, and makes us look good. AgencyAnalytics enables our clients to view key reporting metrics at any time, while also giving our team one centralized dashboard where we can get both high-level and detailed insights about our clients' key performance indicators. It's been a massive win for our business.
Garrett Kite, President, Kite Media
How To Be an Exceptional Data Storyteller
Quite a lot goes into effective data storytelling besides having knowledge about marketing and analytics. The numbers and statistics that are common in the digital marketing analytics world can't, on their own, communicate the relevance of each metric or KPI. The first step in data storytelling is to have a reliable source of clean and organized data.
In fact, a study by the data science company Anaconda found that many data scientists spend 45% of their time on data preparation tasks, including cleaning and loading data. So what’s a marketing agency to do? Let’s take a step-by-step look at how to be an exceptional data storyteller.
You can tailor the reports, to show just what each client wants to see, so they can be in-depth, or just top line for management review. Adding text boxes to be more informative on what each section means is also useful for some clients. They are clear and easy to read and understand for clients.
Andrew Thomas, Technical Director, HookedOnMedia
Using an all-in-one reporting platform like AgencyAnalytics, your agency has instant access to reliable, accurate data from more than 80 marketing integrations, allowing you to automatically pull data into a unified data storytelling platform.
Once data is ready to be analyzed, the next step is extracting meaningful insights from it. Although these insights are crucial to client reporting, they must be combined with a data story to communicate meaning. As the Forbes contributor Brent Dykes notes:
When you package up your insights as a data story, you build a bridge for your data to the influential, emotional side of the brain.
To do so, the author highlights that data, narrative, and visuals must work together in the following ways:
Explain: Coupling a narrative with insights allows you to explain what's happening with the data and why specific metrics and KPIs are important to the overall trend.
Enlighten: By using data visualization, you enlighten the audience about key patterns, trends, and outliers that may have otherwise been missed.
Engage: Finally, by pairing visuals with a narrative, you create an engaging story that drives organizational change.
Ultimately, data storytelling is so important because it increases the memorability, persuasiveness, and engagement of data insights. You’ve done such a great job uncovering key insights, so make sure that they shine!
Prior to using AgencyAnalytics I would have to use data from Google Analytics, Google My Business & Google Search Console. This was very time consuming and sometimes the data was hard to understand for some clients. I would have to go through the data with them or take time to do an explainer video. We needed a place where clients could look at stats, and have it easily digestible.
Rachel Jackson, Lead SEO Wit Digital
Becoming an exceptional data storyteller requires dedication, practice, and the right tools at your disposal. While it may take some time to hone your skills, the benefits of crafting compelling stories with data are immense.
As a data scientist or storyteller, your goal is to go beyond mere data analysis. It's about transforming data into actionable insights and presenting those insights in a way that captivates your audience.
By effectively leveraging the data, you have the power to shape narratives, influence decisions, and drive meaningful change. So, invest your time in mastering the art of storytelling with data because the potential impact is truly remarkable.
6 Ways To Incorporate Data Storytelling Into Marketing Reports
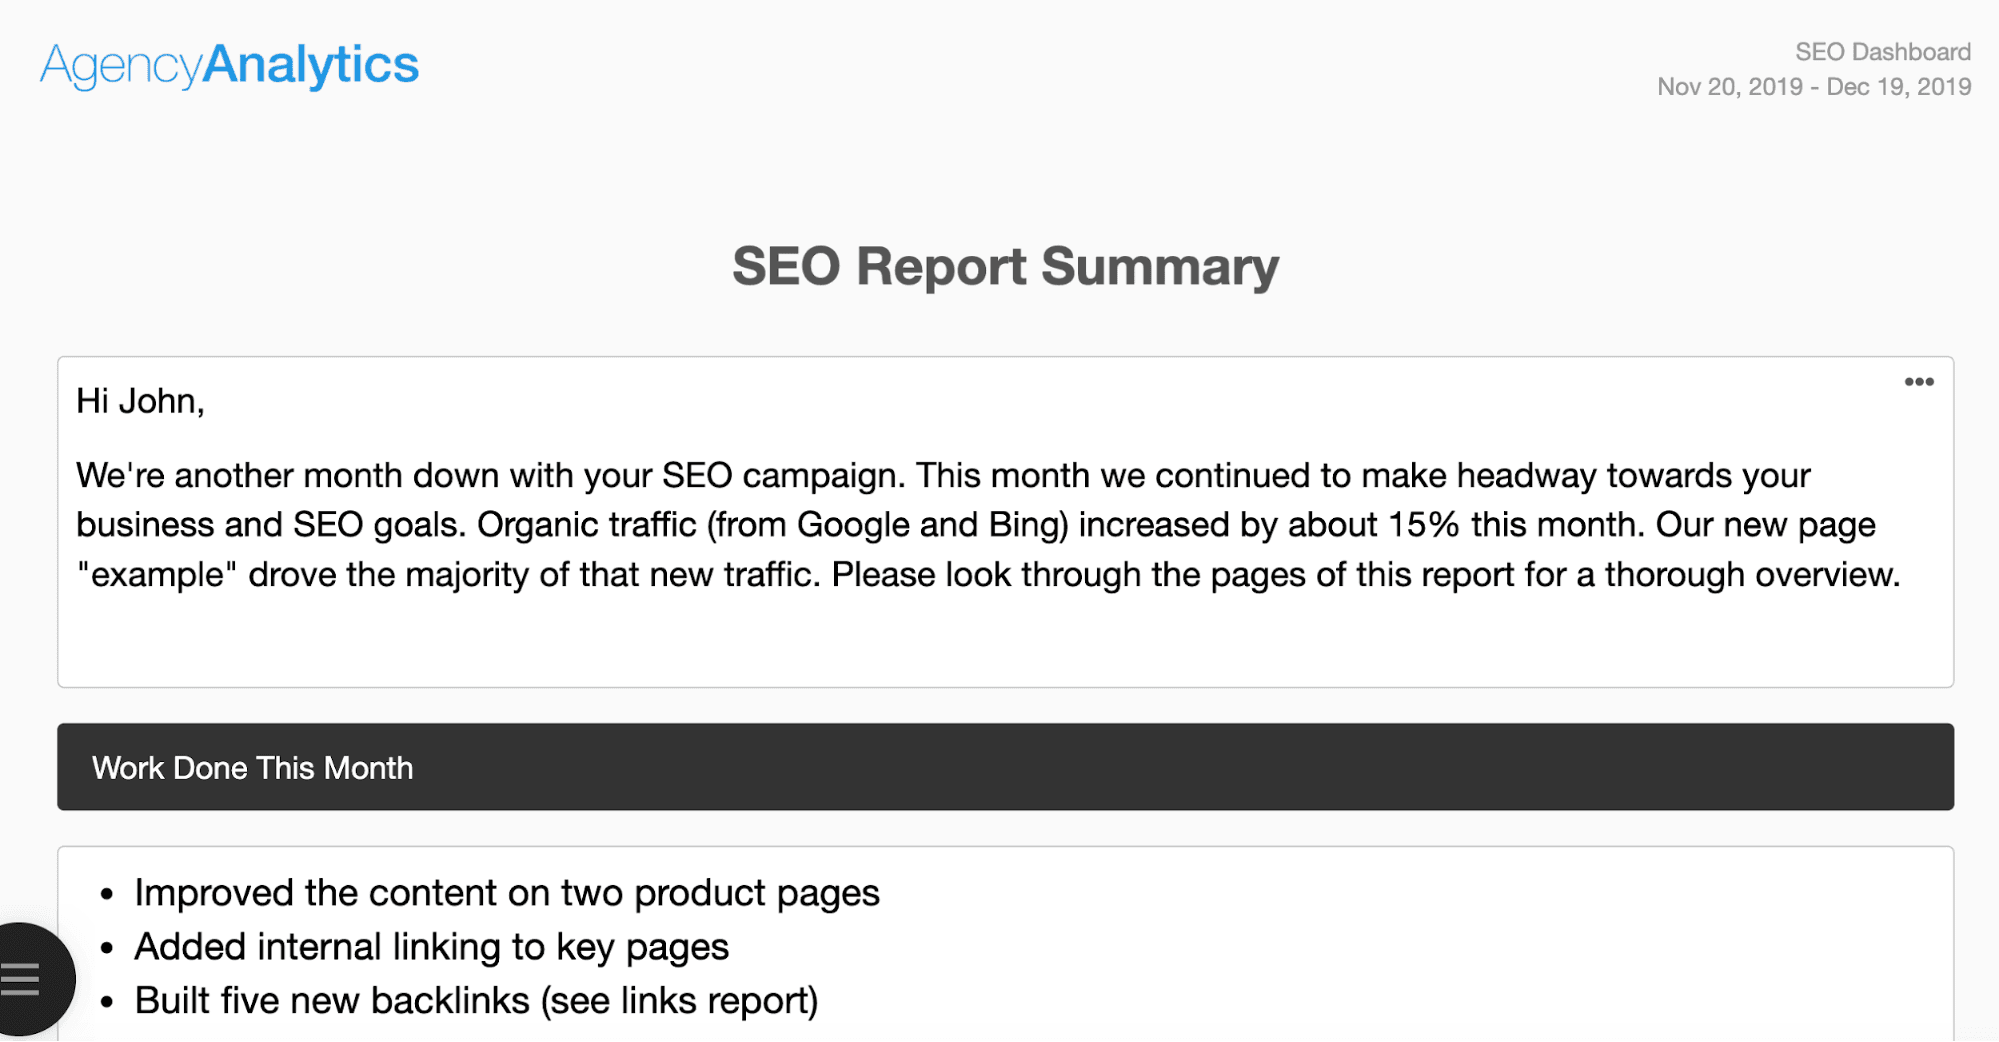
Now that we’ve explored why data storytelling is important, let’s take a look at some ways to incorporate data storytelling into your marketing reports:
Start by finding the most important data points from your report. This will help you focus on the most important information and ensure that it is included in your data story.
Create a storyline to accompany the data points. The data should support this message, and any extra information that could distract from it should be excluded.
Use graphs and visuals to help explain the data. This will help the client better understand the data you are presenting.
Use images or videos to help explain your data points. Going beyond charts and graphs, images–even simple GIFs–or videos that provide the thoughts behind that data help your agency paint the picture more fully.
Write a headline that captures the essence of your data story. A data story does not differ from any other story; it needs a catchy headline. The headline should capture your data story's essence and help draw in your audience.
Use key takeaways to summarize your data story. This will help your clients remember the most important points from your data story.
Curious to see what this looks like in real life? Let’s take a look at a story from one of our clients.
How Creative Click Media Tells Engaging Data Stories for Their 70+ Clients
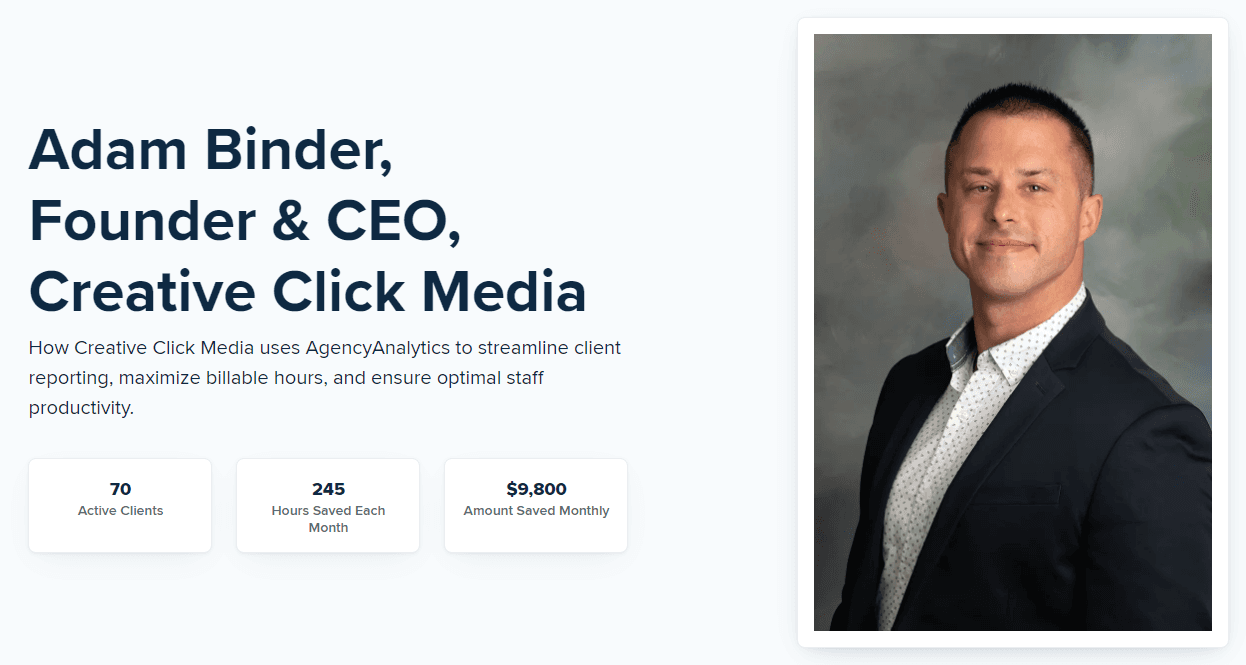
Founded by Adam Binder in 2011, Creative Click Media offers a variety of services such as web design, SEO, PPC, social media, and email marketing. They serve industries ranging from healthcare and finance to retail and construction.
Problem: Reporting Challenges
Despite their growth and expertise, Creative Click Media struggled with client reporting. The process was time-consuming, pulling data from multiple sources like Google Analytics, social media platforms, and PPC campaigns. They had to manually compile these metrics, resulting in errors and taking up approximately 280 billable hours a month.
Solution: Overhauling the Client Reporting Process
Eager to improve, the agency explored various reporting tools. Their search ended when they discovered AgencyAnalytics. This tool offered customization, automatic data retrieval, and over 80 integrations. It was the solution they needed to streamline their reporting, make it more efficient, and give them time to craft compelling data stories that reinforced the value of their services.
Outcome: Improved Client Relationships and Agency Growth
Switching to AgencyAnalytics transformed Creative Click Media’s approach to reporting. They saved up to 245 billable hours per month and enhanced client transparency. They also improved their internal processes, such as scheduling client meetings directly via buttons coded into report emails. These changes fostered stronger client relationships and allowed the agency to scale, all while preserving their unique culture and values.
Lessons: Takeaways for Other Agencies
Time is valuable: Reducing the time spent on report creation frees up hours that can be redirected toward strategic activities.
Customization is key: Tailoring reports to meet specific client needs enhances the value you provide and helps foster long-term relationships.
Automate but humanize: While automation saves time, adding personal touches—like the option to schedule meetings directly from a report—will significantly improve client interactions.
Streamlining and customization make a significant difference, not just in saving time but also in enhancing client relationships and business growth.
Data Storytelling With AgencyAnalytics Reporting Tools
Many data visualization elements, such as charts and graphs, are built into the AgencyAnalytics report and dashboard templates. The report summary section is the perfect place to include other visual elements–including images and videos–that will help drive home your data-driven story.
Another way to tell a story with your data is to add annotations and goals to your reports. This feature opens up a whole new level of your reporting as it gives you the ability to highlight important information directly within each chart. Use this feature to tell stories with your data and ensure that clients know your achievements.
The data visualization provided by AgencyAnalytics report templates goes above and beyond the reports you can create in Google Sheets, and it's all at the click of a single button.
Graham Lumley, Director of Growth Marketing, Blackhawk
To do this in AgencyAnalytics, you simply open the widget settings, and you'll see options to add annotations and goals in all date-based line and column charts:
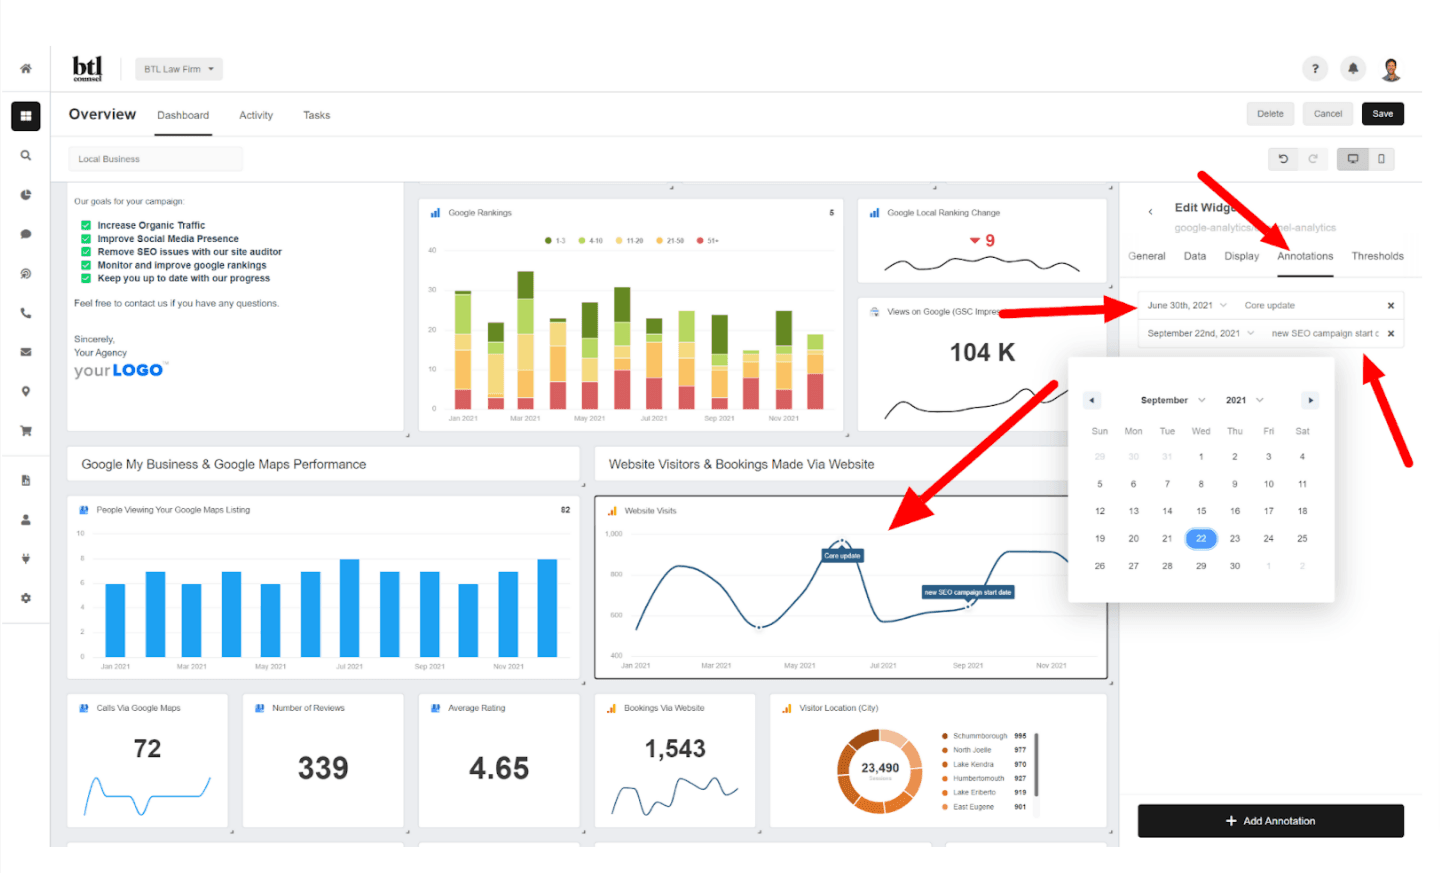
Once you’ve added your annotations and goals, they will automatically be displayed on the chart. As you can see below, this feature–available on Agency and higher plans–adds a level of transparency and accountability between you and your client:
By combining data, visualization, and narrative, you tell an engaging story anyone can understand and that clients remember. After all, you're not building and sending reports for the reports themselves. These reports should be an opportunity to build a deeper relationship with your clients.
In the context of marketing, data storytelling is one of the best ways to deliver an intuitive understanding of your campaign results—not only does it communicate the value of your services in a thought-provoking way, but it also creates a level of transparency and accountability between your clients.
We've tried all of them! AgencyAnalytics was the winner for us due to the simplicity in the visual interface, the ability to create custom dashboards, and actually take the reports and bring in a variety of different data points to tell the story we were trying to tell.
Alex Faiers, Founding Director, Addictivity
See how 7,000+ marketing agencies help clients win
Free 14-day trial. No credit card required.

