Table of Contents
QUICK SUMMARY:
A marketing executive dashboard provides a streamlined overview of key marketing metrics, aiding high-level decision-making. This article shares examples and best practices for creating well-made dashboards that present data clearly and concisely.
Creating executive marketing dashboards comes with a certain level of pressure. After all, they aim to be the top-level, quick, and effective summary of your client’s marketing efforts. And it’s going in front of the discerning eyes of top-notch stakeholders.
When you’re tasked to take an avalanche of important digital marketing analytics and turn it into an igloo of actionable insights, picking and choosing the right blocks can be the greatest challenge. This article is chock-full of dashboard examples and tips on how to make them effective. We’re here to help you knock the socks off the execs. With dashboards.
Let’s begin.
What Is an Executive Marketing Dashboard, Anyway?
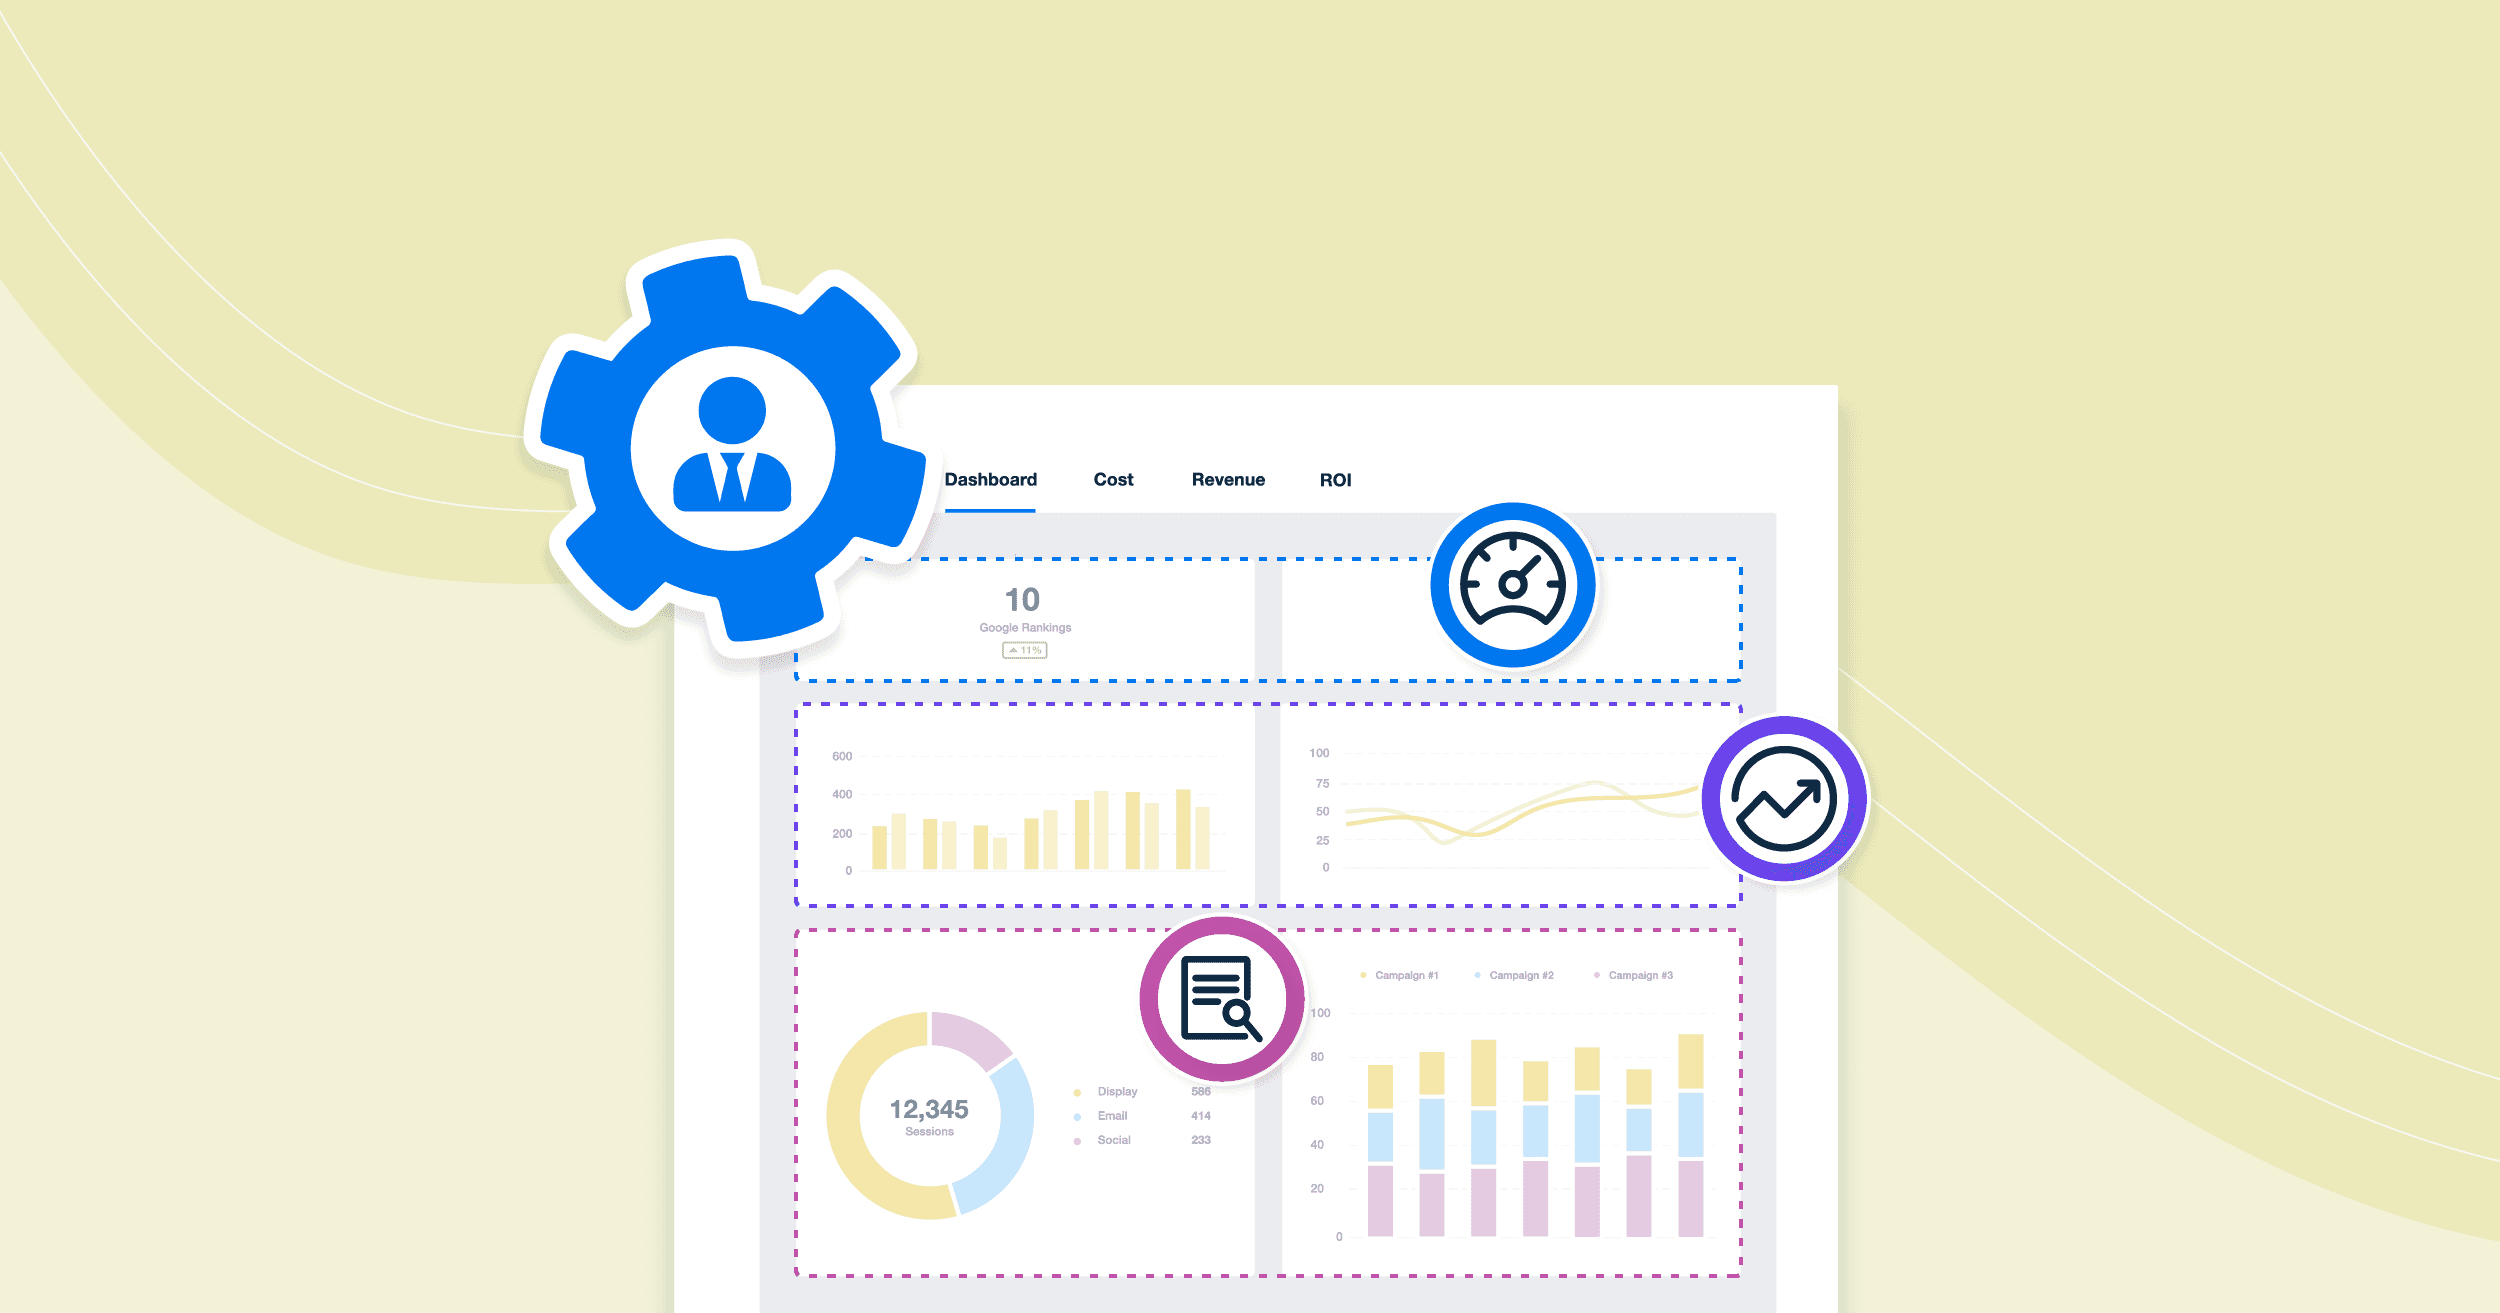
An executive marketing dashboard is like a control panel that your clients and their stakeholders use to make high-level business decisions without getting too bogged down by data.
Keep in mind that this type of marketing performance dashboard should also contain only the most vital information that helps them assess their business’ health, manage their goals, identify trends, make predictions, and plan ahead.
That’s why it should maximize on data visualization tools that organize the most vital marketing metrics in a way that’s easy to digest.
Key Features and Benefits of an Executive Marketing Dashboard (aka Why You Need One)
To enhance your stakeholder’s data analysis, let’s go over some of the features and benefits of an executive dashboard:
Saves time for the leadership teams to discern what’s important. At the same time, it's also handy for marketing teams that want to grasp key takeaways quickly
Allows for efficient analysis with data visualization
Prioritizes more top-level decision-making like sales and revenue forecasting, budgeting, etc.
Takes information from multiple sources and puts it together to tell a story
Where an executive marketing analytics dashboard excels, a typical reporting dashboard may not. This next section will look at why that is.
3 Signs a Typical Reporting Dashboard Won’t Meet Your Needs
There’s a fine line between too much information and not enough. Here are some of the most common executive marketing dashboard pitfalls–and why a typical reporting dashboard may not be the right tool to communicate at the executive level.
1. The Dashboard Gets Bogged Down by Granular Details
The primary goal of an executive marketing dashboard is to create one source of data that is focused and effective. Keep it simple when choosing which data points to show and how deep you really need to go. Consider your goal when choosing what to show and what to omit.
Think of your executive-level dashboard as a ‘need to know basis’ for providing information. The key here is to deliver the data in such a way that they can get to the information they need and absorb it quickly, rather than trying to decipher what each data point means in the greater context. Basically, you need to tell a clear story without drilling too deeply into how you got there.
In essence, an executive marketing dashboard will typically focus more on OKRs and KPIs than on raw metrics. Read more about OKRs vs. KPIs here.
2. The Data Visualization Isn’t Strong Enough
Selecting the right data visualization is also essential to convey specific facts. The whole point of the executive marketing dashboard is to ditch as many tables as possible and use graphs to:
Display an appropriate range of data and group the values within that range (i.e., 1 year)
Show relationships between two or more variables to make connections
Allow for easy comparison showing two variables side by side
Align data to goals to show whether their marketing strategy meets objectives
Break down data into separate components, which we’ll cover in the point below
At the executive level, you need to show information about how your client’s marketing activities are contributing to their bottom line. If your executive marketing dashboard doesn’t prominently display sales and revenue data, then stakeholders won’t be able to make predictions about the financial side of the marketing activities.
3. The Dashboard Design Doesn’t Allow for Context or Logical Conclusions
The design of the executive dashboard is especially important to relay information–and fast. Make sure to include related data side-by-side to draw quick conclusions and let stakeholders know what’s happening in as few words as possible.
Rely on data-visualization graphs to let the numbers speak for themselves. This doesn’t mean cramming your dashboard with widgets–too many will only create clutter. Use annotation and goals to put things into context so executives can draw an easier cause-and-effect correlation.
A good rule of thumb is to include the most noteworthy information at the top, such as performance indicators. Below, show trends, and lastly, at the bottom, go into more general background information with some details.

Want to scale without sacrificing quality? Professional dashboard reporting software is the key. Regular reporting dashboards generally use real-time metrics gathered over a bi-monthly or 30-day period. Executive dashboards reported on a bi-annual basis, for instance, should have timelines that display monthly and yearly trends.
Agency Tip: Make sure the 5-second rule applies. Your prospects should be able to answer questions like ‘Have leads grown year over year?’ almost instantly. To help you, ensure the data represented in the graphs are stretched over an appropriate timeline.
Benefits of Regular Marketing Dashboards vs. Executive Marketing Dashboards
All of this isn’t to say that an automated marketing KPI dashboard isn't useful. In fact, there are many benefits of using marketing analytics dashboards to report day-to-day performance and activities. But when it comes to longer-term decision-making, especially at the C-suite level, executive dashboards are the clear winner.
Regular Dashboards | Executive Dashboards |
|---|---|
Granular performance data breaking down of KPIs and metrics | Sales and revenue forecasting |
Identifying current campaign strengths and weaknesses | Identifying trends |
Customer journey tracking | Making predictions for the future |
KPI details to improve creatives | Identifying emerging opportunities |
Real-time customer information | Budget planning |
Short-term decision-making | |
Regular client reporting | Creating long-term marketing strategies |
Automating the daily data-retrieval process | Cross-channel marketing reporting |
Now that we’ve covered the importance of executive dashboards, and how they are different from your usual marketing dashboards, let’s look at what you need to include in an executive marketing dashboard.
Here are different examples of executive marketing dashboards organized by department.
Executive Marketing Dashboard Examples
There are a variety of executive marketing dashboards–each of which serves its own purpose. You might need one, two, or more, depending on the services your agency provides. Here are eight executive marketing dashboard templates, for example:
Ecommerce Dashboards
Digital Marketing Dashboards
SEO Dashboards
PPC Dashboards
Social Media Dashboards
Analytics Dashboards
Email & Marketing Automation Dashboards
Overview Dashboard
1. Ecommerce Dashboards
While an eCommerce marketing dashboard unifies important SEO metrics like conversions with PPC performance such as Google Ads data, an executive version needs to provide a top-level view of eCommerce KPIs and show an online store’s overall profitability and growth over time.
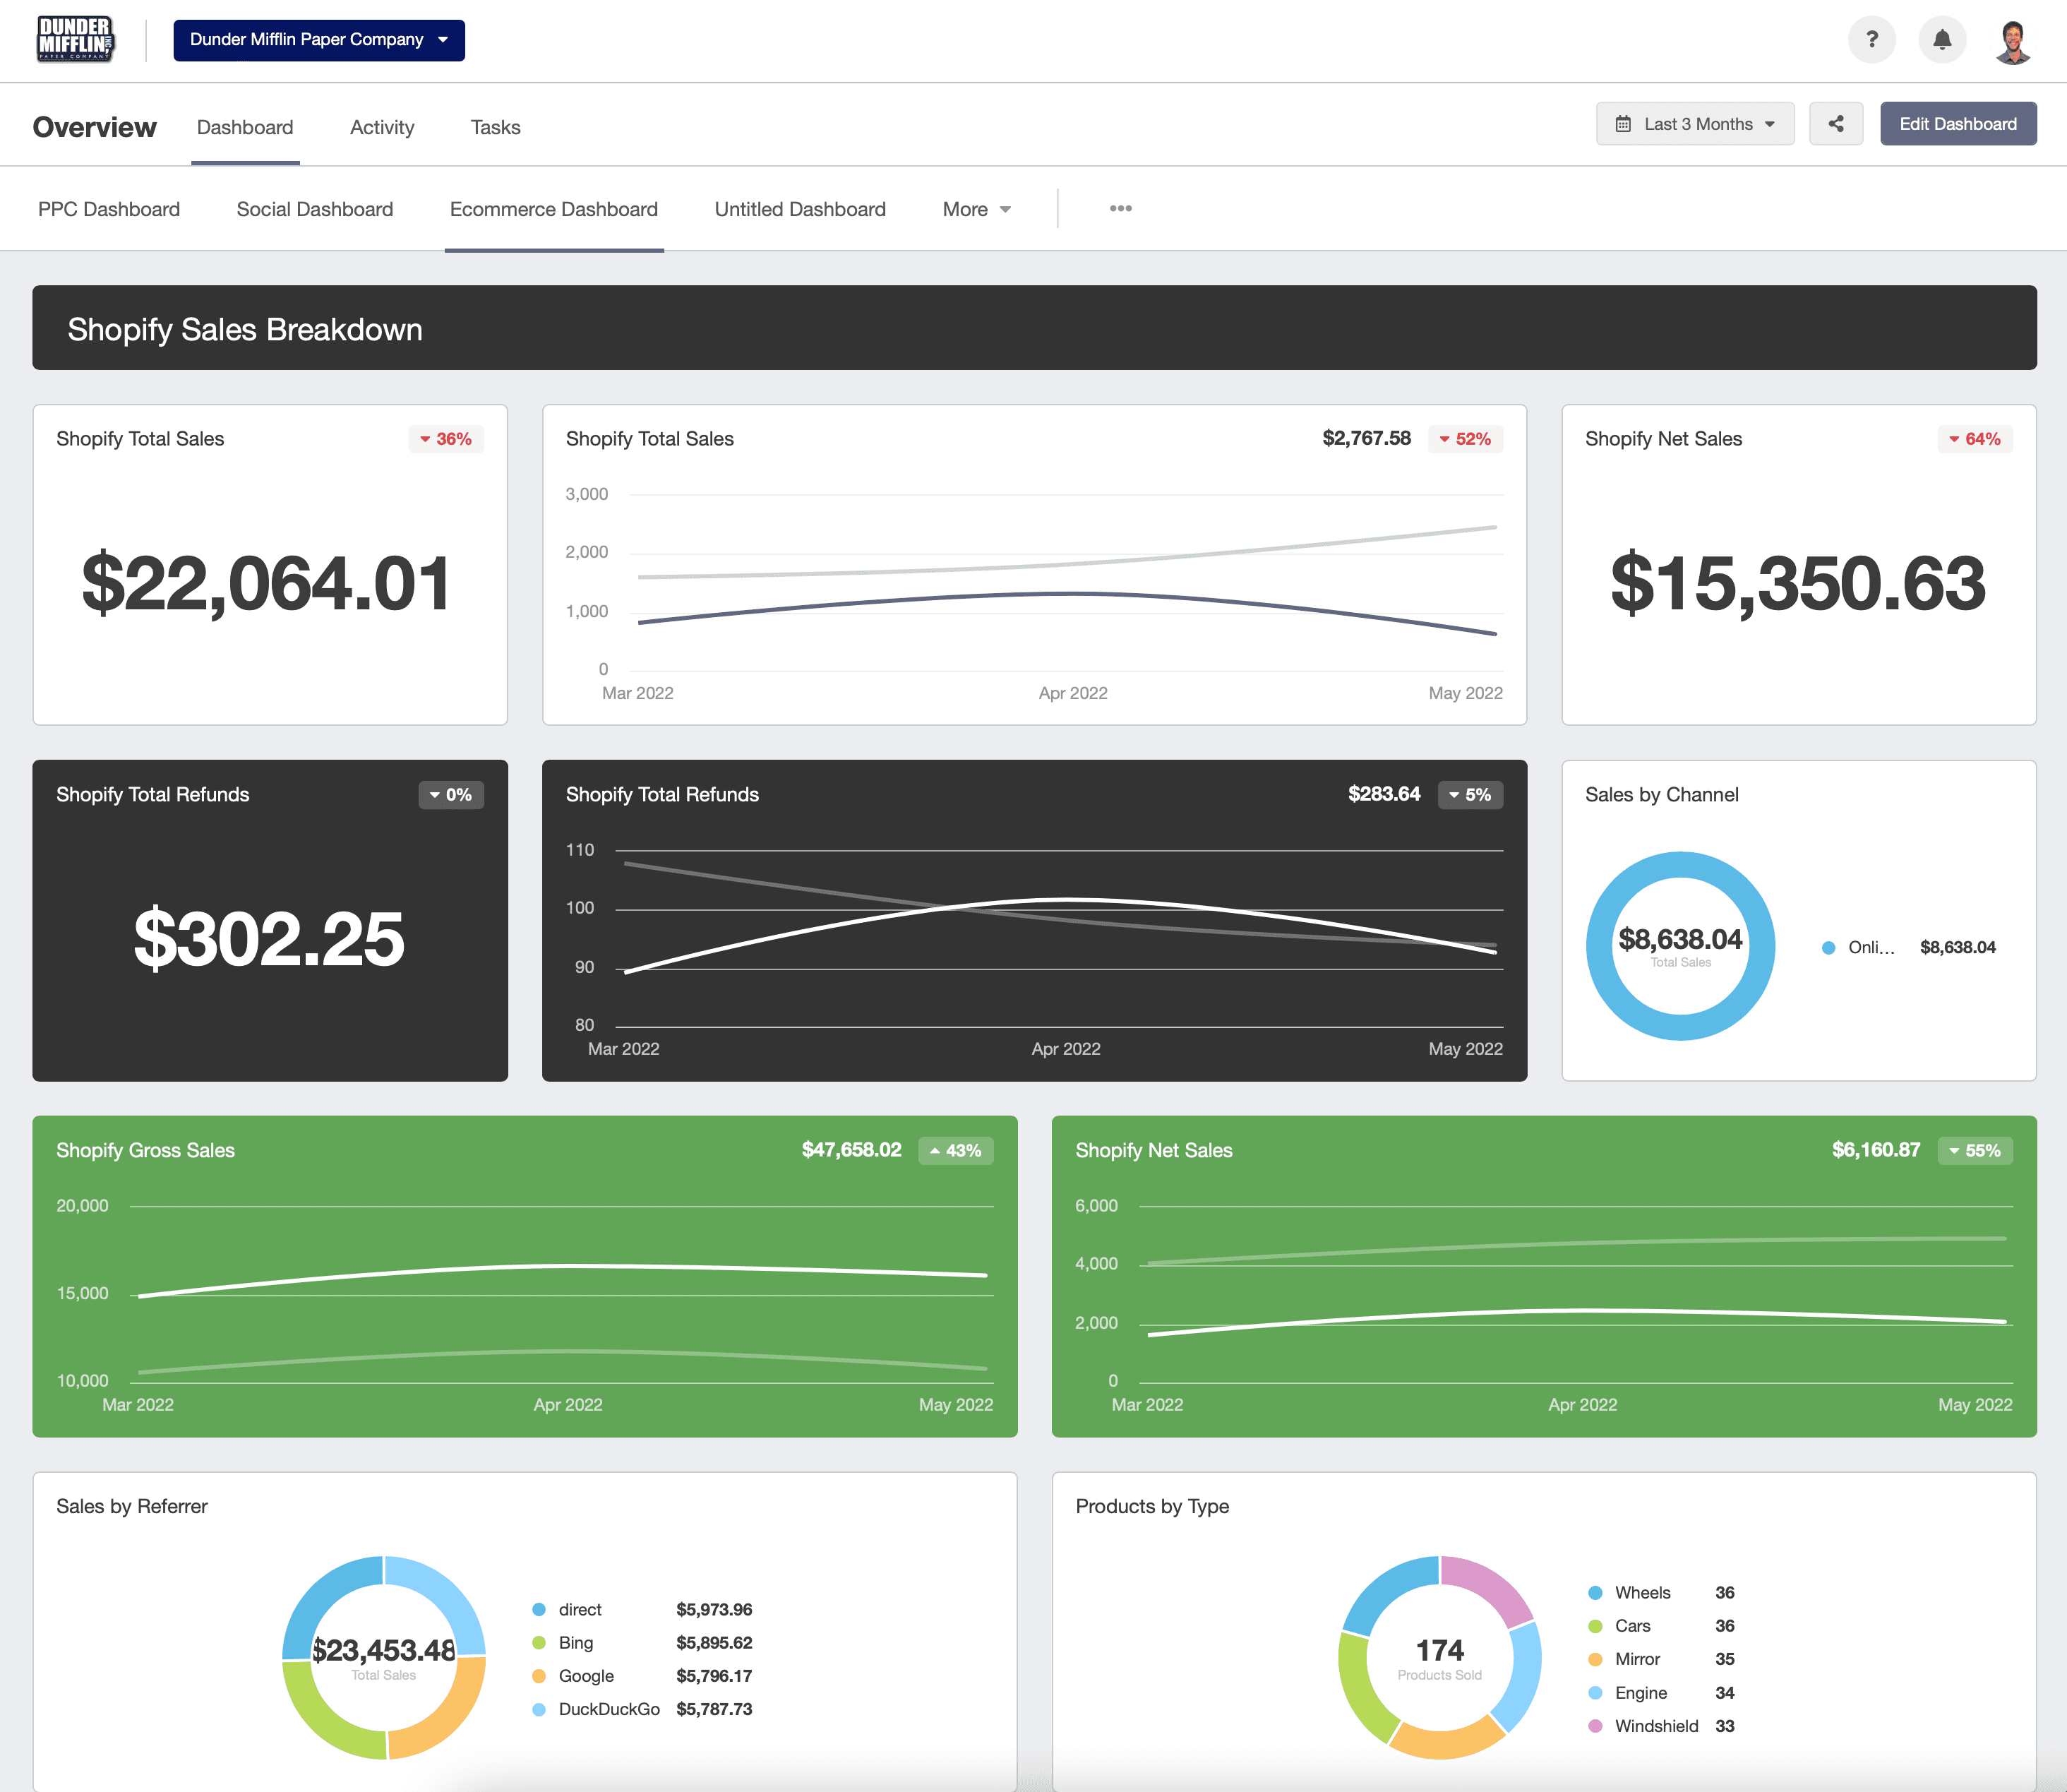
Start with the eCommerce Dashboard to select only your most important eCommerce metrics and change up the widgets to add critical campaign metrics when setting up your executive reports. Try it free for 14 days.
Agency Tip: Curate the data your clients and stakeholders need to know to better plan their inventory, budget, and planning. This includes sales, sources of sales, and most popular products.
2. Digital Marketing Dashboards
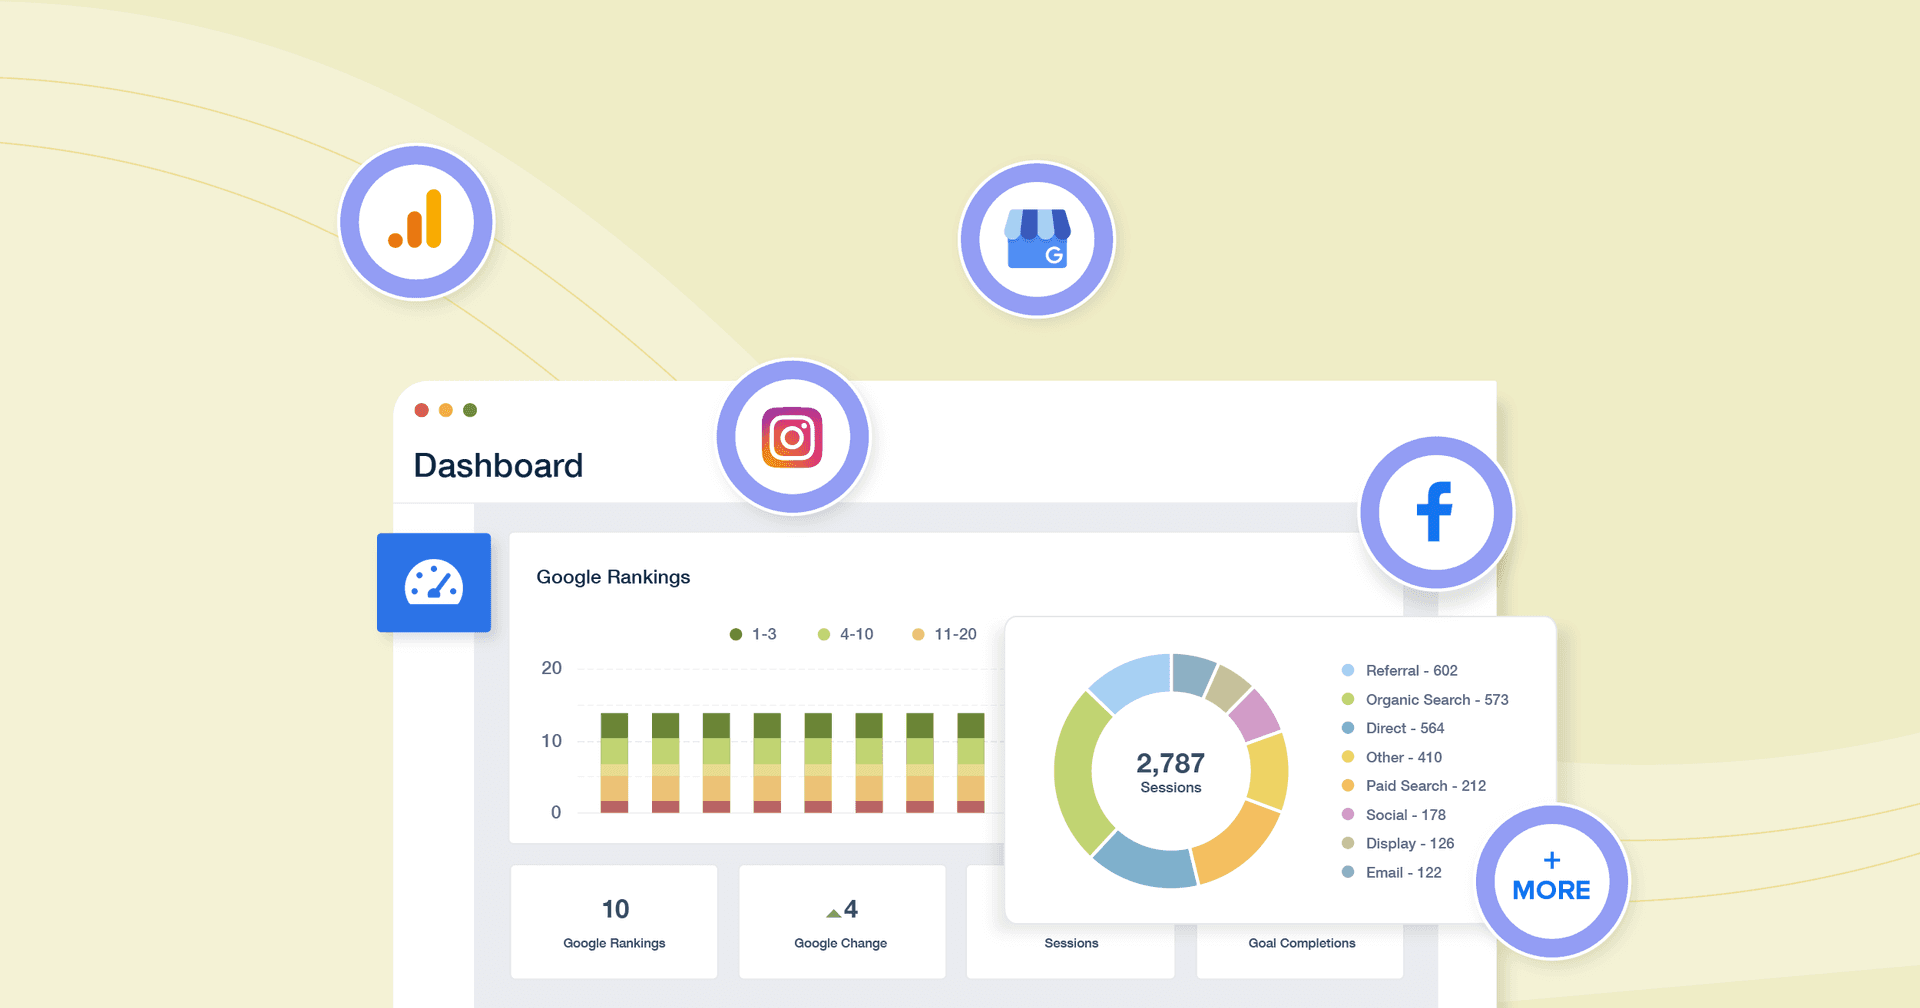
This dashboard template is a great starting point to design an overview of your client’s cross-channel marketing campaigns such as Google Analytics metrics and paid ad results (e.g., consolidating metrics instead of creating a separate Google Ads dashboard). Highlight your ROI, costs, and revenue (like the digital marketing dashboard example below).
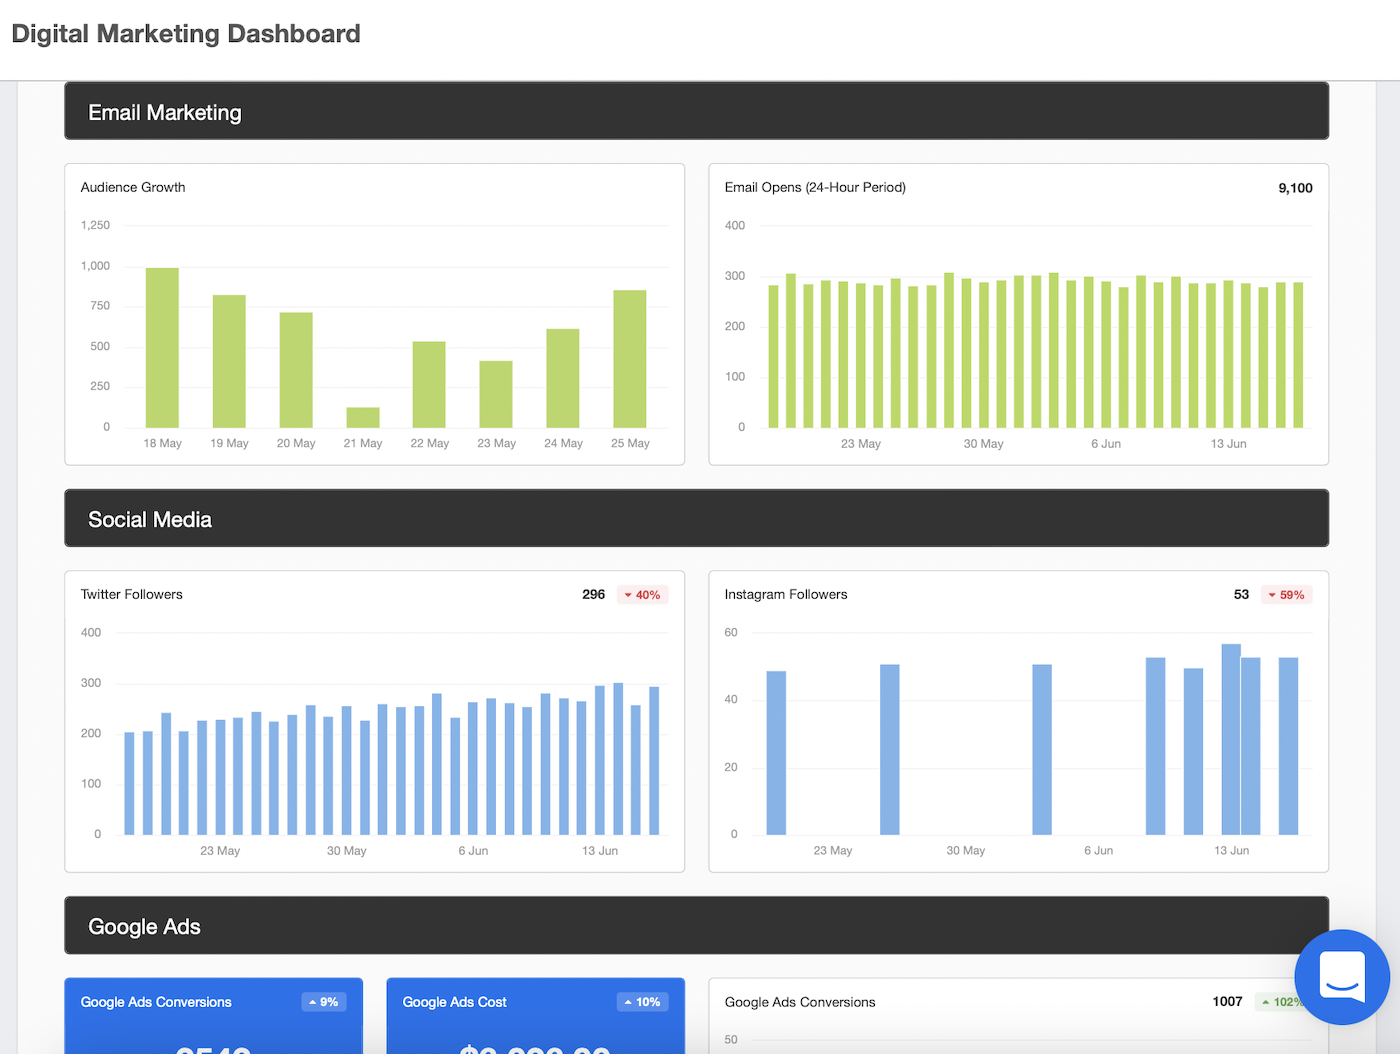
Start with the digital marketing dashboard template to pare down the most essential elements!
Agency Tip: Your executive digital marketing dashboard should prominently display Revenue, Return on Ad Spend (ROAS), and Marketing Qualified Leads, as well as traffic growth trends. This will show how your agency uses the website to drive traffic to their business.
3. SEO Dashboards
The best SEO software gives agencies real-time data that allows them to stay on top of SERPs and create more targeted traffic-generating content. An executive dashboard shows the SEO KPIs in a timeframe that shows overall organic growth. Plus, an SEO reporting dashboard is easily customizable if you want to include insights from complementary campaigns (e.g., PPC ads).
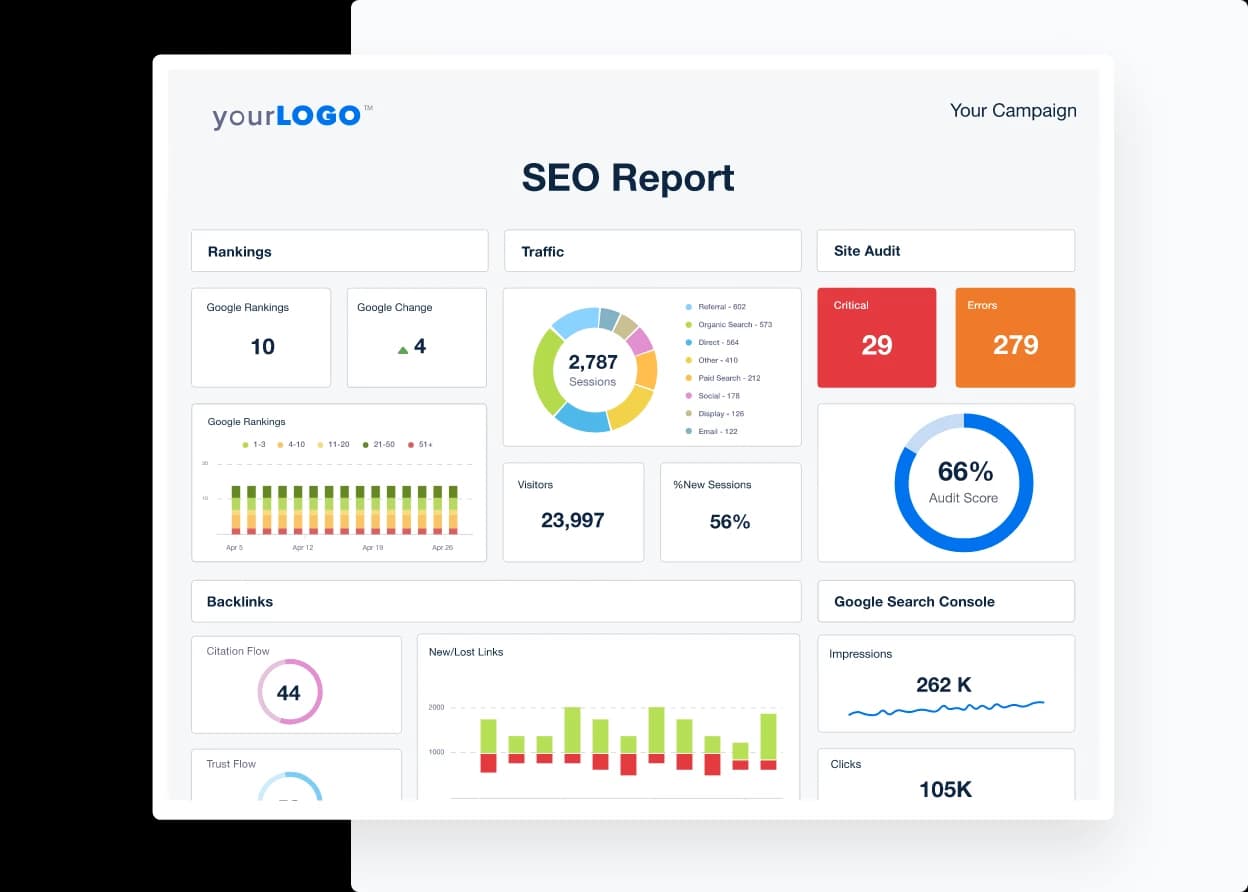
Use SEO Reporting software to automate your data retrieval process. Use drag-and-drop widgets to create a powerful executive SEO dashboard to visualize your clients’ organic marketing campaigns instantly.
Agency Tip: Benchmark your clients’ SEO data industry standards, and compare them to the competitors to ensure you're keeping up with market changes.
4. PPC Dashboards
Executive PPC dashboards put a special spotlight on financial numbers, including Conversions, Cost, and Cost per conversion, to ensure that you’re well within your budget.

This PPC dashboard template helps you consolidate key PPC metrics such as cost and conversions so you can show their trends over time.
Agency Tip: Ensure there are clear takeaways like recommendations for the next quarter and budget changes based on past performance.
5. Social Media Dashboards
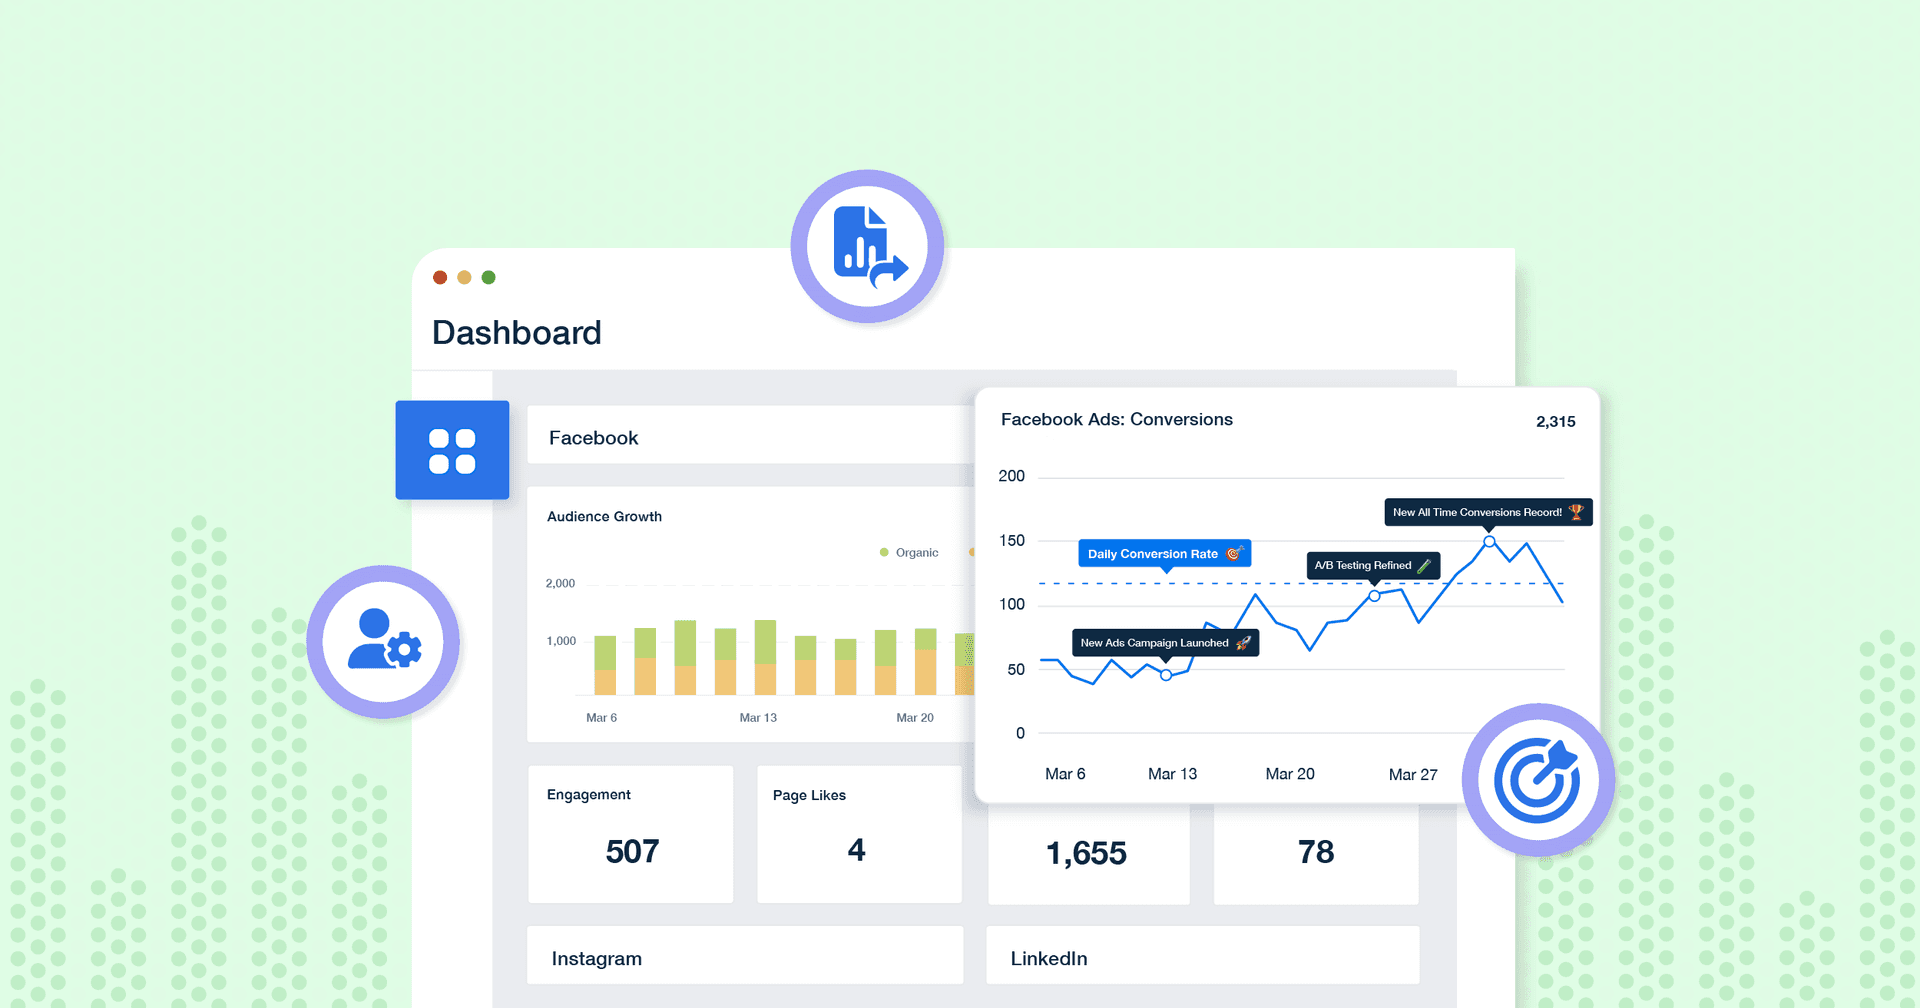
An executive social media dashboard summarizes how your client’s business has performed across all their social media channels, putting a laser focus on the most important social media KPIs. Combine only the key metrics from their platforms and compare how each channel is performing against the other, like YouTube vs. Facebook Ads.
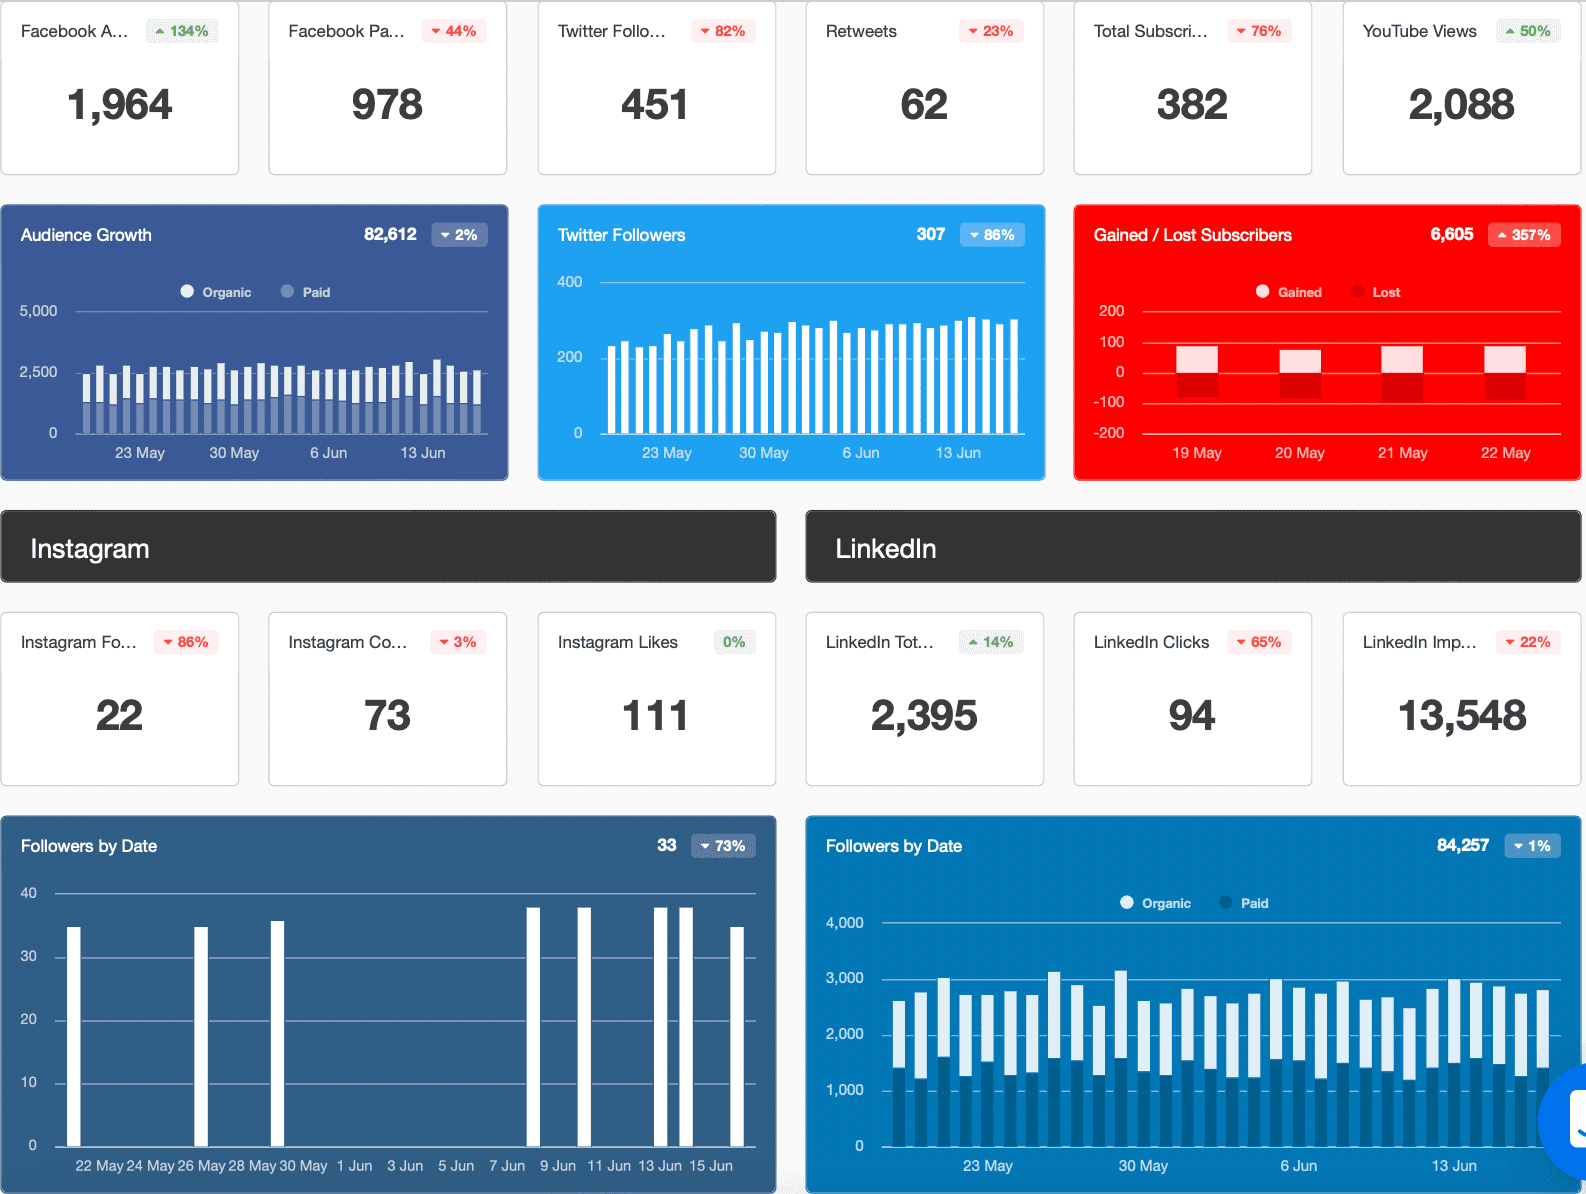
Use this social media dashboard template to create a general overview of your social media spending, conversions, and audience growth.
Agency Tip: Create graphs that compare engagement between each social media platform to show not only how they are increasing, but also which marketing channels are performing better.
6. Web Analytics Dashboards
To show how your client’s website has grown over time, start with the web analytics dashboard that summarizes metrics such as traffic growth, conversions, and ROI.
Adjust the timeline and widgets according to your client’s business goals. Then, use this web analytics dashboard to compare marketing performance year-over-year (e.g., showing a 10% yearly increase in Google Analytics traffic).
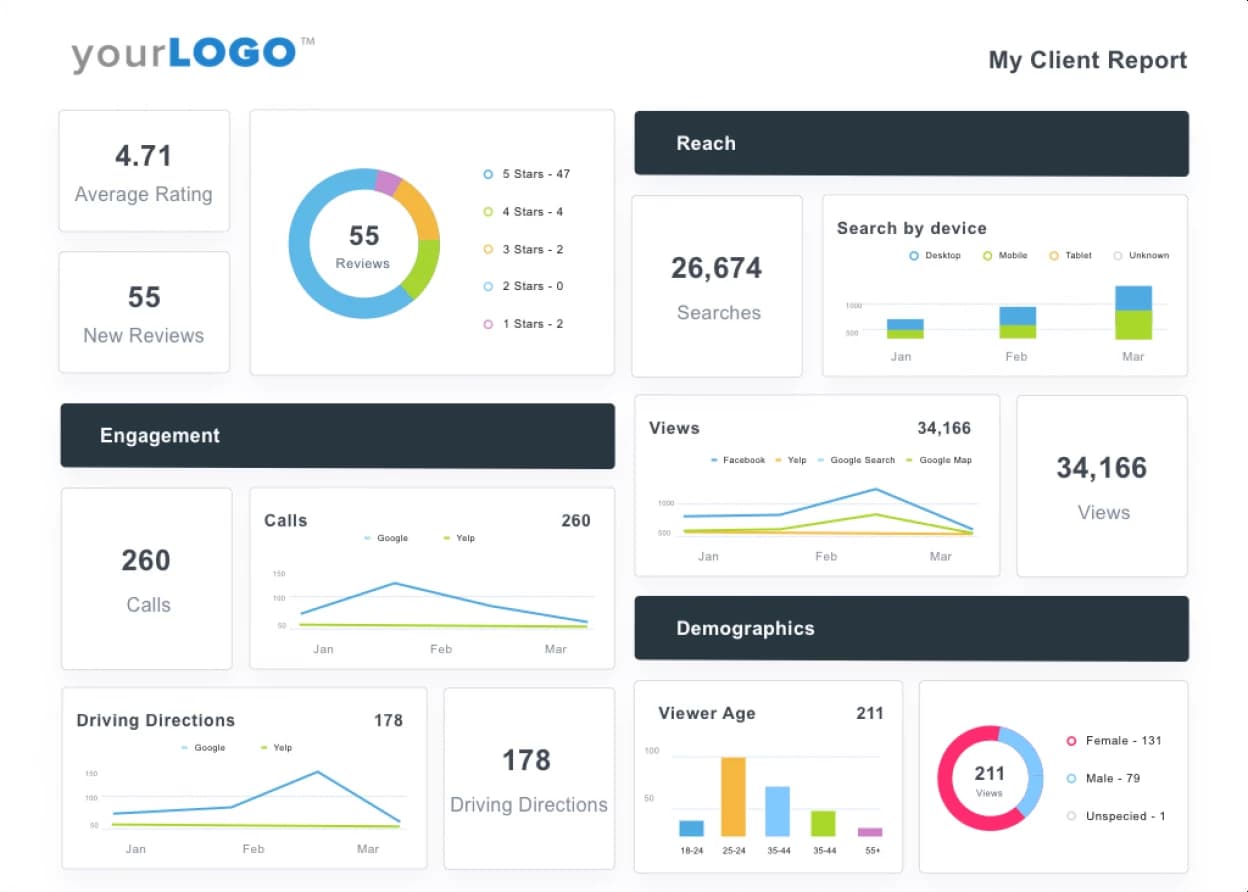
Agency Tip: Add ratings and review analytics into a bi-annual report in minutes to show how a business’s online reputation is improving over time.
Feature: Ratings and Review Analytics
7. Email & Marketing Automation Dashboards
Track email KPIs such as new leads, subscriber growth, and engagement to help stakeholders gauge the effectiveness of your email marketing campaigns. Create your own executive email marketing dashboard by connecting with your client’s favorite integrations.
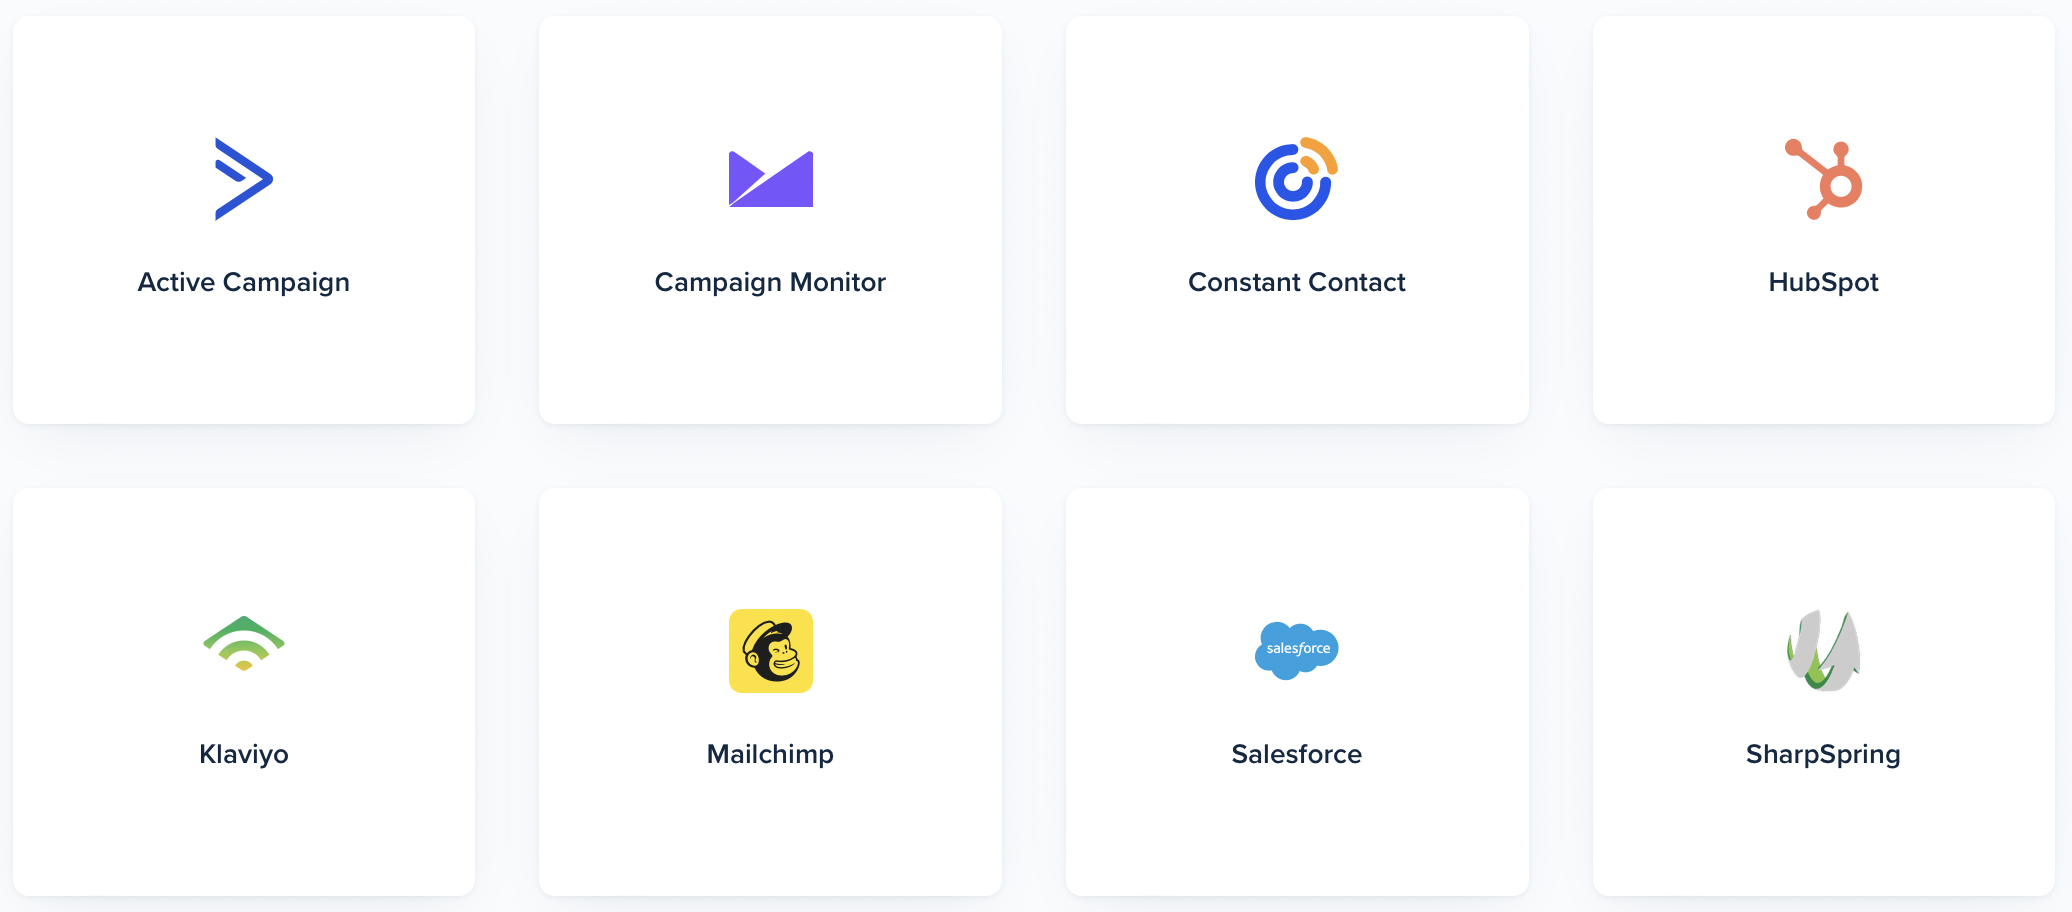
Remember, you can always choose from 80 integrations to put all your clients’ key metrics into fully customizable, white-labeled executive dashboards that serve your clients–and their key stakeholders’ needs. Choose from Google Ads, Google Search Console, and much more!
Agency Tip: Ensure you’re zooming out enough to show clear email list growth, increased engagement, and revenue from previous quarters and years. Show month-to-month comparisons on the key metrics, and identify particularly successful campaigns to emulate the following year.
8. Overview Dashboards
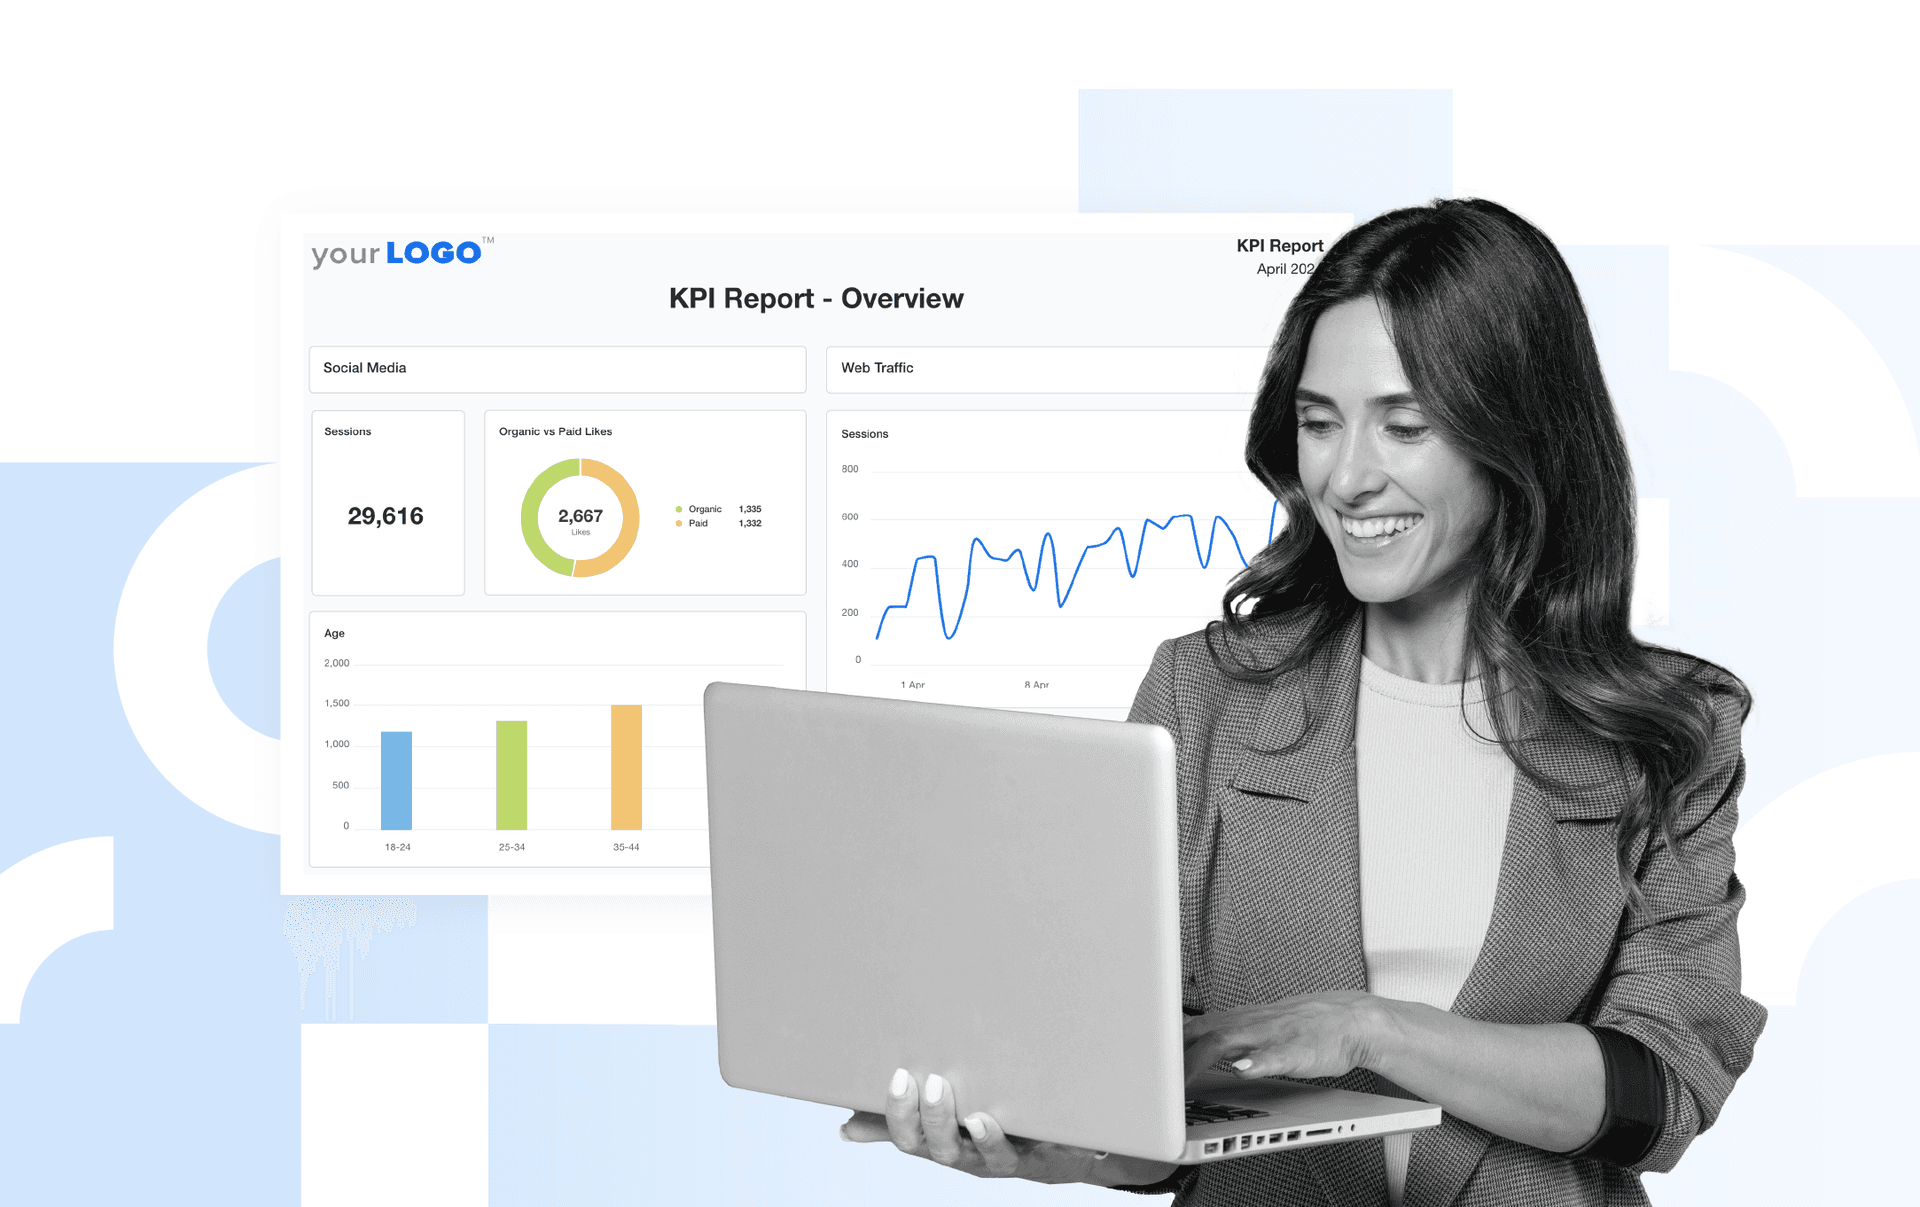
Combine all of the above into an Overview Dashboard to simultaneously show all your clients’ marketing activities at-a-glance.
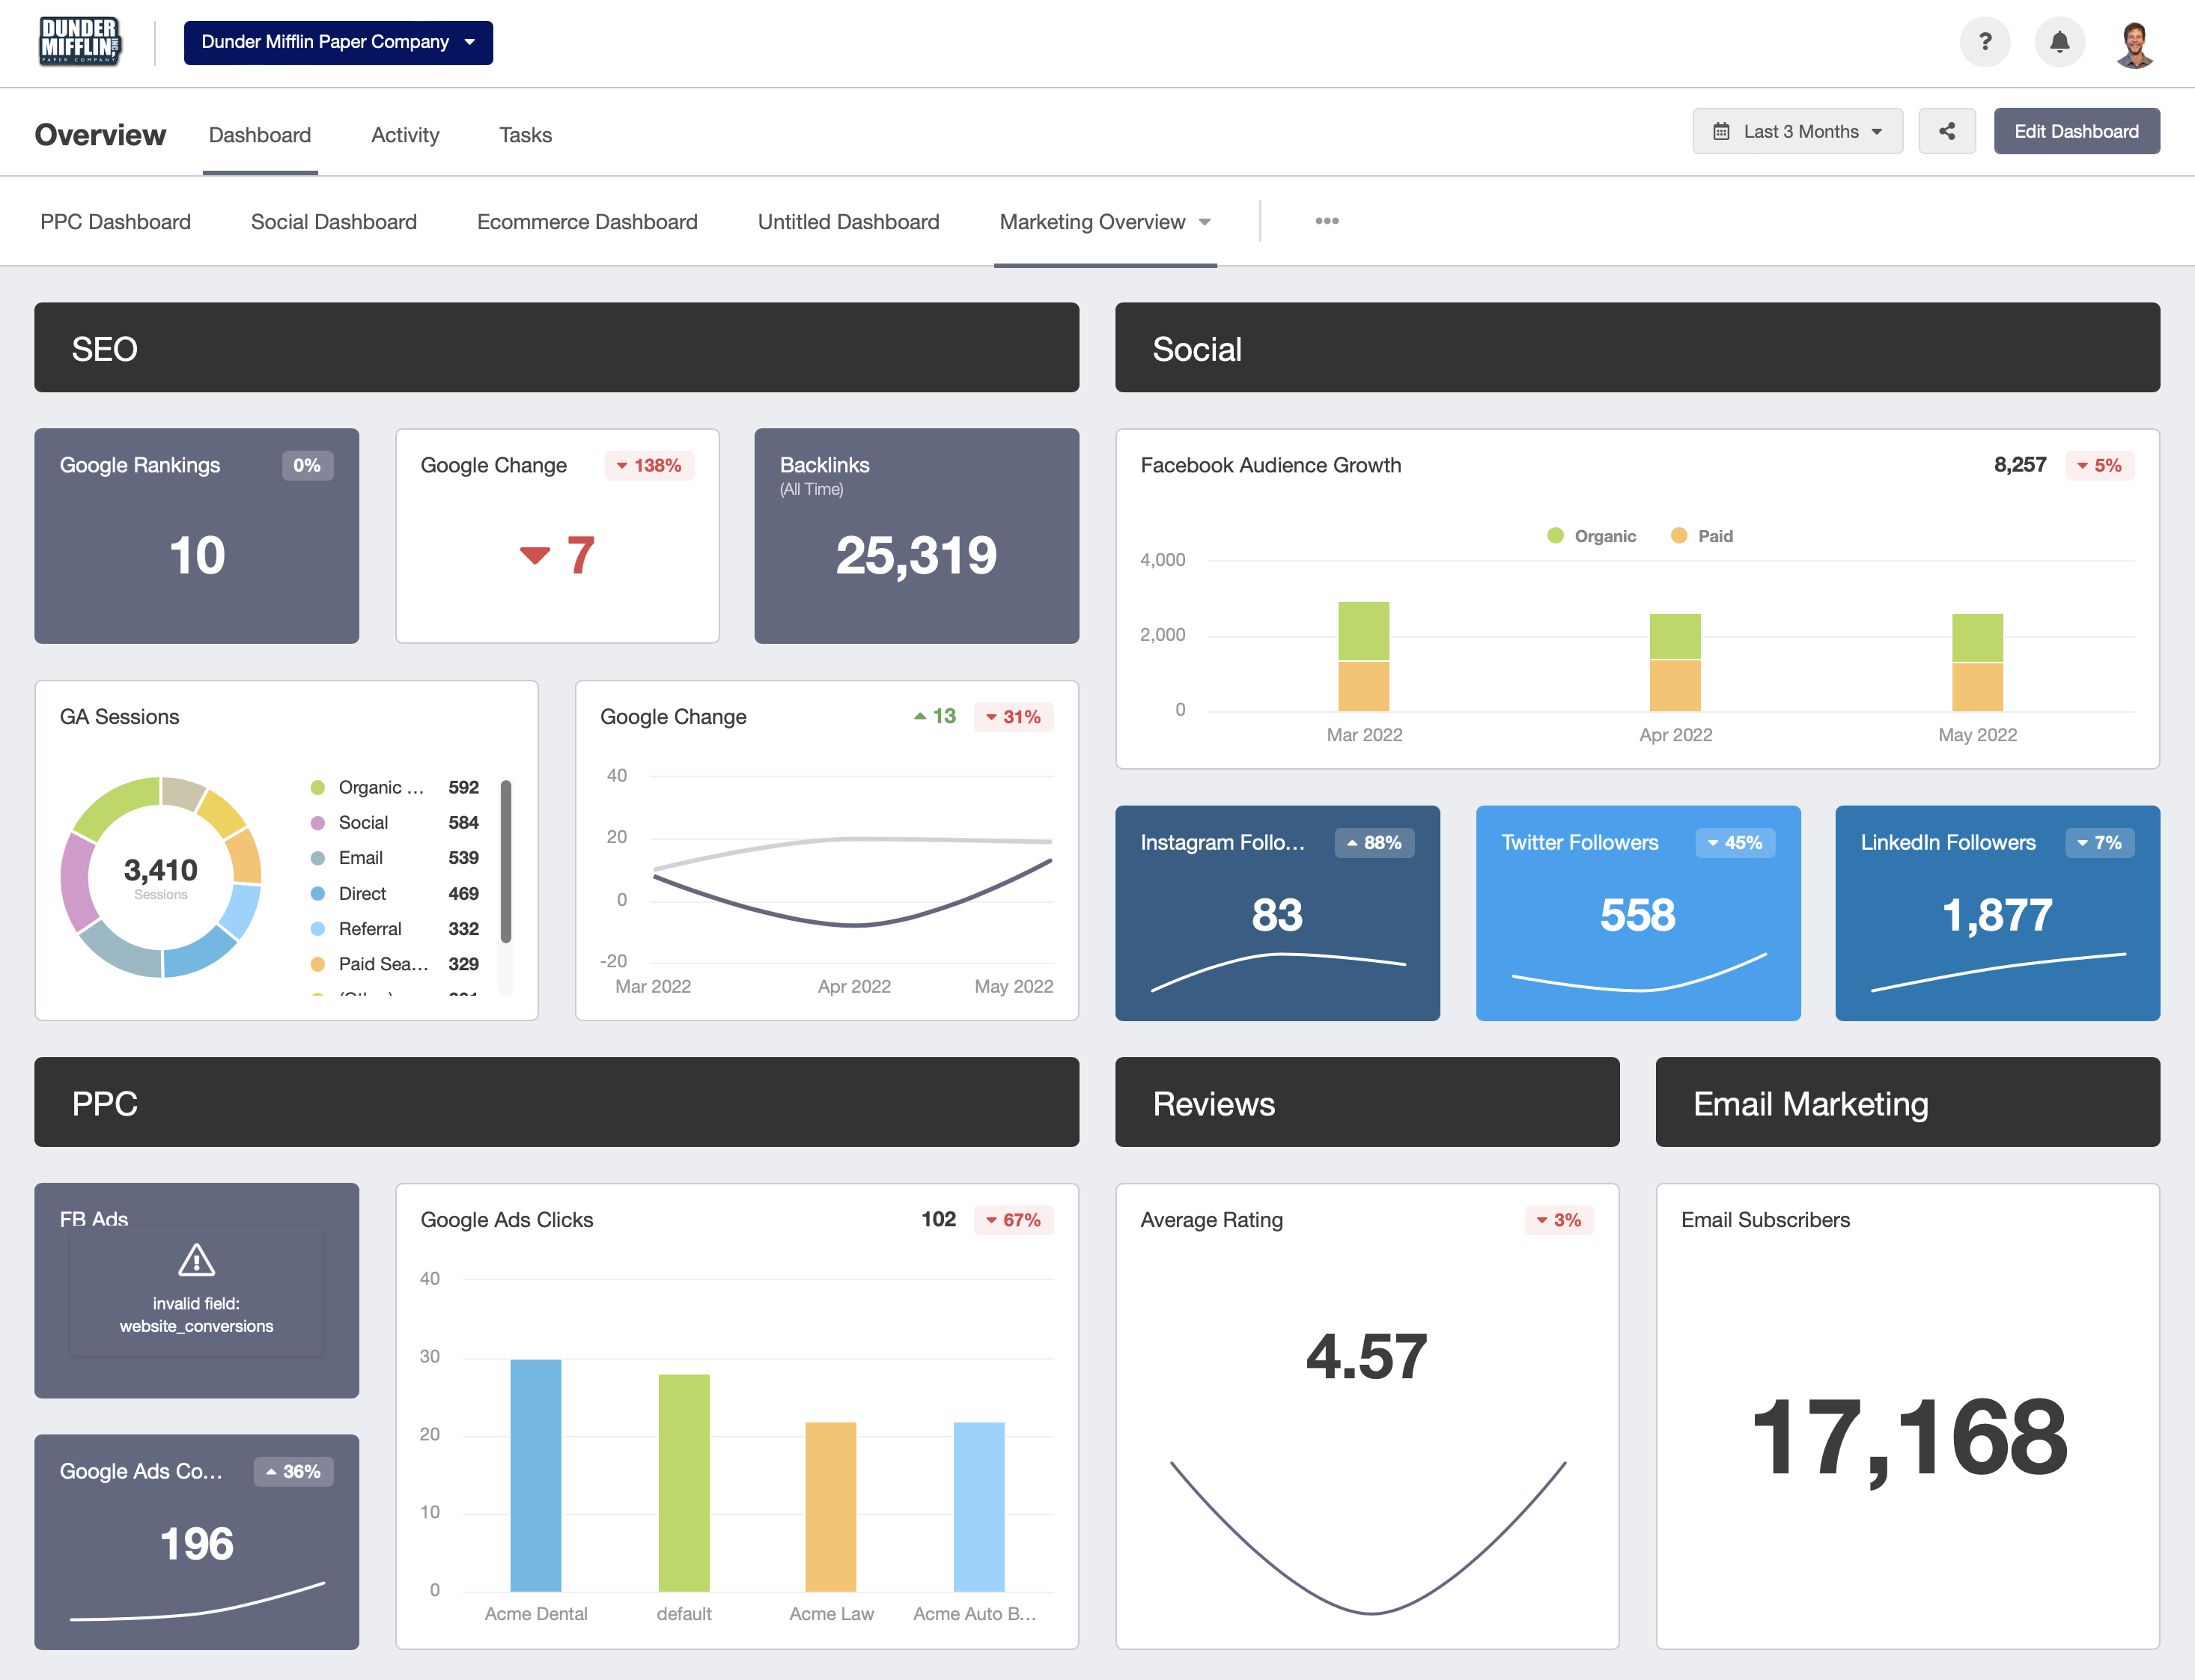
Agency Tip: Pare down the metrics you show for each channel by keeping it between 1-5 OKRs to impress your clients and stakeholders. This is just a health check that will introduce your client to their designated executive dashboard with more details.
Executive Marketing Dashboard & Reporting Best Practices
1. Use professional executive dashboard software to avoid wasting time gathering historical marketing data and manually putting them into spreadsheets and graphs.
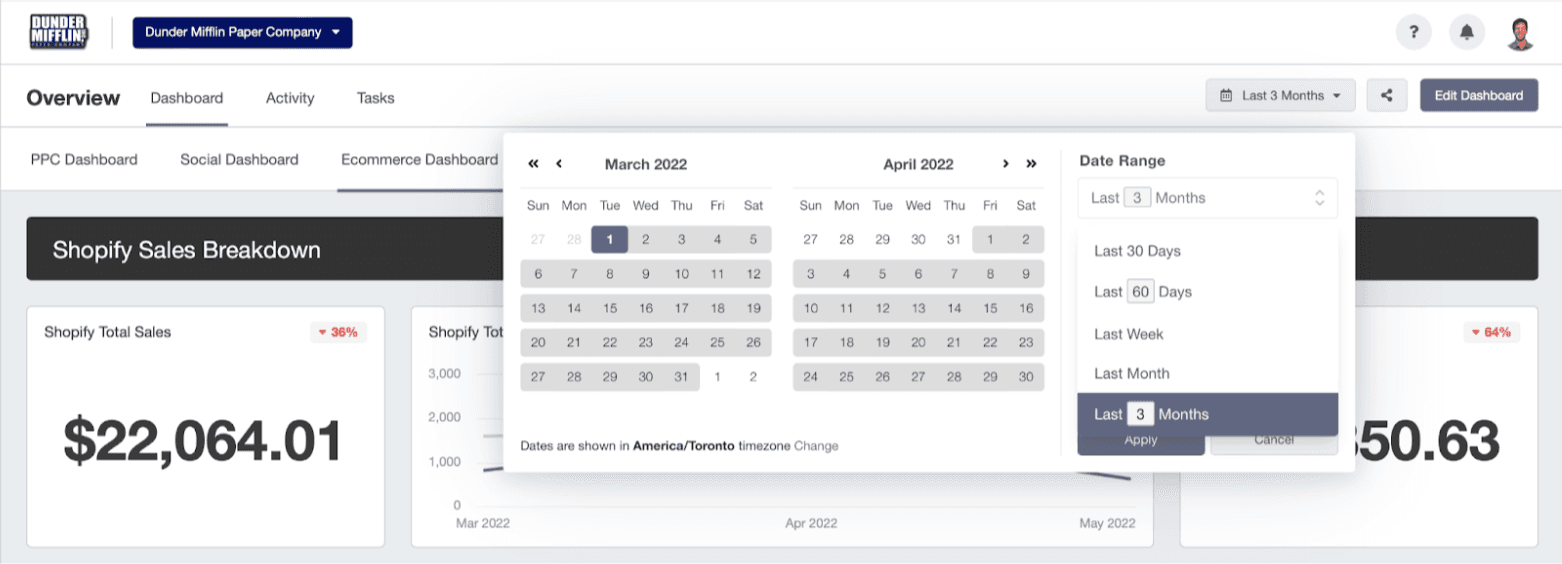
A simple widget on the right side of the dashboards is used to select your ideal period and even compare them to another period of your choice.
2. Improve your marketing dashboard templates. You only need to create a dashboard template once for each client before they automatically update their real-time data. But encourage your marketing team to hold internal workshops to stay up to date with the latest industry trends on the marketing KPIs and metrics to track and report on. Actively seek feedback from your C-level recipients if key OKRs and KPIs are missing from the dashboard. When everyone is on the same page, data sharing comes easy and allows you to make quicker, smarter decisions that improve your campaign performance.
3. Control who accesses which dashboard. Your internal team members and account managers should be able to access detailed information–24/7. Meanwhile, your executive clients should be able to see only what they need to know–when they want–and have their reports sent out regularly. With executive dashboards, you’ll want to put more thought into tailoring it with custom notes and annotations, so you won’t be automating the reporting process as much. But the extra effort will be worth it.
Final Tips for Building Your Executive Marketing Dashboard
Executive marketing dashboards are like the elevator pitch of your agency’s marketing activity success. It’s up to you to boil down big data into digestible chunks of actionable insights your clients will keep coming back to you for.
When building an executive dashboard, you’ll need data visualization tools and a strong goal in mind. So before arranging those widgets, think about:
Who it’s for–which stakeholders will be looking at this information
What information do they need to know
What type of executive dashboard(s) do you need
How to present the data in a way that can answer their burning questions in under five seconds
Continual growth and progress is the goal your clients are hiring you to maintain. Professional, senior-level executive reporting is what’ll keep you on their payroll.
Choose from many prebuilt dashboard templates and instantly gather your clients’ powerful data right at your fingertips in a client reporting dashboard. Try it free for 14 days!
Want to send clients regular marketing reports instead of using a live dashboard? Using a pre-built marketing report template helps present the data in a clear and consistent manner while showcasing the metrics clients care about.
Impress clients and save hours with custom, automated reporting.
Join 7,000+ agencies that create reports in under 30 minutes per client using AgencyAnalytics. Get started for free. No credit card required.
Already have an account?
Log inFAQs About Executive Marketing Dashboards
Clear answers to help your agency move from scattered reports to a single, high-level executive dashboard that drives confident, data-driven decisions.
An effective executive marketing dashboard focuses on the most relevant information for strategic decision-making—not vanity metrics. Essential KPIs typically include revenue, pipeline velocity, customer acquisition cost, marketing-attributed revenue, and website performance indicators like conversions or high-level traffic sources.
Business leaders may also track team performance, campaign ROI, customer relationship management (CRM) insights, and key performance metrics from major channels.
Unlike operational dashboards, which surface day-to-day data sets, an executive dashboard highlights only the information needed to evaluate overall business performance, identify opportunities, and support data-driven decisions.
The goal is a high-level view of the marketing engine in a single dashboard that enables immediate clarity.
While every organization differs, most top-level executives rely on four core KPIs that directly represent business growth and marketing effectiveness:
Revenue & Pipeline Contribution – Demonstrates how marketing impacts the sales pipeline and financial health.
Customer Acquisition Cost (CAC) – Essential for understanding long-term scalability.
Return on Investment (ROI) – A universal measure of business performance and efficiency.
Conversion Rate – A high-level metric indicating whether campaigns turn attention into results.
These appear in most executive dashboard examples because they offer a concise, strategic snapshot and avoid overwhelming executives with granular data sets or channel-specific vanity metrics.
A strong executive summary focuses on clarity, brevity, and strategic context. It typically includes:
A high-level view of marketing performance metrics tied to business goals
Key insights from CRM systems and customer relationship management data
A brief financial overview (e.g., revenue, ROI, budget allocation)
Trends from website performance, campaign highlights, and sales impact
Risks, opportunities, and recommendations for next steps
Unlike a traditional report, an executive summary dashboard prioritizes the story behind the numbers, giving top-level executives relevant information in minutes—not requiring them to sift through massive amounts of data.
An executive dashboard should offer a clean, visual representation of the most important metrics, using graphs, scorecards, and summaries that executives can understand at a glance. The layout should be organized into clear sections (e.g., revenue, pipeline, traffic, conversions) with trend lines instead of dense tables.
Effective executive dashboard examples avoid clutter, highlight insights over raw data, and ensure the visual hierarchy supports fast interpretation. Whether it’s a marketing executive dashboard or a broader business dashboard, the design should instantly answer: “Are we meeting goals?”
With AgencyAnalytics, it’s easy to customize your dashboards for different stakeholders while maintaining a strategic, unified view.
The 5-second rule means that a viewer—especially a busy executive—should be able to understand the overall state of performance within five seconds of opening the dashboard. This rule exists because business leaders cannot interpret granular marketing metrics when making rapid strategic decision-making choices.
A well-designed executive marketing dashboard surfaces the top takeaways immediately: growth, decline, risks, and opportunities. Clear trend lines, minimal widgets, and strong data visualization ensure the dashboard communicates outcomes effectively, without requiring explanation or manual work to interpret the data.
Yes. Many platforms—including AgencyAnalytics—provide prebuilt dashboard templates that consolidate marketing, sales, and CRM insights into a single dashboard.
These templates are designed to accelerate setup by pulling in data from multiple data sources automatically. You can also tailor templates for different stakeholders, ensuring each version highlights only the most relevant information.
For inspiration, many agencies browse executive dashboard examples or executive summary dashboard examples to help shape their own executive dashboards without starting from scratch.
A well-designed executive dashboard unlocks faster, more informed decision-making by consolidating the most relevant information into a single, strategic view.
Key features typically include:
Multi-source data integrations that pull insights from customer relationship management systems, website analytics, paid media, and financial data
Up-to-date data visualization for instant clarity on performance metrics
Timeline and period-over-period comparisons to track progress and identify trends
High-level KPIs that reflect business performance without overwhelming leaders with vanity metrics
Customizable layouts that adapt to different stakeholders, goals, and reporting cadences
Benefits include:
Reduced manual work and fewer fragmented spreadsheets
Clearer communication with business leaders and the executive team
Better forecasting with access to up-to-date performance indicators
Earlier opportunity detection using unified data sets
A single dashboard that supports strategic decision-making and long-term business growth
Although they complement each other, they serve different roles.
An executive dashboard displays live or regularly updated data visualizations, giving a real-time, single-dashboard overview of marketing and business performance. It’s ideal for ongoing monitoring and quick analysis.
An executive summary report, on the other hand, is typically narrative-driven and covers a set time period. It “tells the story” behind the numbers, highlights insights, and includes commentary, recommendations, or context.
Think of the dashboard as the management dashboard for ongoing visibility, while the summary report distills performance into a structured narrative.
Using AgencyAnalytics, you can create an executive dashboard in less than 30 minutes. Because the platform pulls data from multiple data sources automatically, the setup time largely involves:
Choosing a template
Selecting which performance metrics matter most
Customizing layout and timeline ranges
Adding context through notes or goals
For agencies building dashboards manually (e.g., spreadsheet-based management dashboards), the process can take hours or even days. Automated systems eliminate massive amounts of manual work and keep dashboards up to date without intervention.
Creating an executive dashboard in AgencyAnalytics involves a simple, repeatable workflow:
Connect data sources: Integrate analytics, CRM, advertising, email, and financial data (via the Google Sheets integration) with a few clicks.
Choose a template: Start with a dashboard template or easily create one tailored to a specific channel.
Select important metrics: Focus only on KPIs that influence strategic decisions.
Customize your dashboard: Add white-label branding, set design themes, reorder widgets, adjust time periods, and highlight goals or trends.
Add context: Use AI-generated summaries, custom notes, annotations, and comparisons to help executives make informed decisions.
Share with stakeholders: Provide dashboard logins or export executive summary dashboards when needed.
This workflow ensures your executive team gets a streamlined, high-level view without unnecessary clutter or manual effort.

Written by
Melody Sinclair-Brooks brings nearly a decade of experience in marketing in the tech industry. Specializing in B2B messaging for startups and SaaS, she crafts campaigns that cut through the noise, leveraging customer insights and multichannel strategies for tangible growth.
Read more posts by Melody Sinclair-BrooksSee how 7,000+ marketing agencies help clients win
Free 14-day trial. No credit card required.


