Table of Contents
QUICK SUMMARY:
Google Analytics 4 (GA4) metrics are numerical values, such as averages, ratios, and percentages, used to measure website or app performance. GA4 offers many native metrics across multiple categories, as well as the ability to create custom metrics. Combined, these GA4 metrics provide key insights into user behavior.
Google Analytics 4 (GA4) is the next evolution of Analytics, and it’s a powerful tool for not only measuring user activity but also optimizing user engagement. But one of the most common issues we hear from agencies when trying to dig into GA4 metrics is that GA4 is complicated, and even overwhelming at times.
GA4 isn't just a sequel, a mere update on an older platform. It's more like a ground-up reinvention that steps into the spotlight and says, "Hey, I’m here, and I’m different!" This platform embraces the value of marketing strategies and the nuances of user behavior, while also offering some sweet new metrics to sweeten the deal. Once you figure out how to use it, that is.
“GA4, while more powerful in many ways than the legacy Universal Analytics platform, requires re-learning how to set up and navigate the GA interface,” warns Molly Lopez, Founder & CEO at Sparo.
Rick Hogan, CEO & Co-founder of Bleevit, a local digital marketing agency focusing on small businesses had already set up their GA4 account by July 2022–a year before Universal Analytics gets phased out. “By running both Universal Analytics and GA4 simultaneously, the year-over-year comparison can be made easily.”
In fact, many agencies have already made the switch ahead of time. “If you switch after the deadline, you won't be able to show clients MoM or YoY comparison data,” adds Matthew Pavli, Managing Director at UK-based content marketing agency Content Drive. “The most important reason to set up GA4 before July 2023 is so that you have historical data to compare your new data to.”
If GA4’s hundreds of dimensions make you feel as if you’re lost in a multiverse of marketing metrics–don’t worry. You’re not alone. This article will help you make sense of the numbers and show you some of the most important GA4 metrics your agency should be tracking for client success.
And here's the deal: GA4 isn't about dropping a trail of breadcrumbs for users to follow. Instead, it charts the entire user journey, with all its twists and turns, like a master storyteller spinning an epic saga. It's like having a pair of digital binoculars that allows a captivating peek into the digital landscape, capturing every move, every click, every pause.
So don’t get lost in a sea of numbers. Here are the top Google Analytics 4 metrics you need to watch along with some much-needed context on what’s changed and why they matter.
Exploring the GA4 Metrics Universe
Before we board our spacecraft and rocket into the vast Google Analytics 4 metrics universe, let's step back and set the stage. In GA4, metrics are not mere numbers. They're the heartbeats, the pulses, the rhythms of your website's life, telling a tale of each visit, each click, and each interaction. They're about going beyond counting visits and stepping into understanding experiences.
Unique Users: The Cornerstone of GA4 Reporting
In the world of GA4, 'unique users' wear the crown. This metric offers insights into how many distinct individuals are interacting with your site or app. Think of each unique user as a character in a book, each one contributing their own chapter to the overall narrative of your website's story. GA4 provides a magnifying glass, enabling a close-up view of these unique users, their interests, and their behaviors. In the grand theatre of user analytics, 'unique users' are indeed the protagonists.
Tracing the User Journey
Mapping out the user journey is like reading the storyboard of a great film. Every click, every pause, every interaction is a scene in itself, creating a holistic picture of the user experience. GA4 is your director's chair, offering the tools to track this journey, not as a linear path but as a rich, multi-dimensional expedition. It's about connecting the dots from the first interaction to the final action.
Transitioning from Sessions to Events
In the Universal Analytics era, 'sessions' were the go-to metrics. Fast forward to GA4, and 'events' take center stage. Unlike sessions, which focused on the duration of a visit, events capture the interactions within those visits. It's like swapping out a stop-watch for a photo album, where each event is a snapshot of user interaction.
The New Approach to User Engagement
GA4 takes a fresh approach to user engagement, moving beyond counting page views to understanding the quality of those views. This is where engagement rate and engaged users come into play, shining a light on the depth of interactions users have with your content. It's like the applause at the end of a show, telling you just how engaged your audience was. With GA4, user engagement gets a much-deserved standing ovation.
To sum it up, the GA4 metrics universe is all about understanding the user - not as a number, but as a unique individual with their own journey, their own interactions, and their own story to tell.
How Many Metrics are There in Google Analytics 4?
As of writing, Google Analytics 4 has at least 165 dimensions across sixteen categories and 99 metrics across ten categories, making it one of the primary web analytics tools to use for your analytics dashboard.
Track all your clients’ key GA4 metrics in a live Google Analytics 4 reporting dashboard. Try AgencyAnalytics free for 14 days.
Metrics vs. Dimensions
When using GA4, it’s critical to understand the differences between metrics and dimensions, so let’s get some definitions out of the way first.
What Are Metrics in GA4?
A metric is quantitative (which means it’s measurable) and “it’s always a number as opposed to text”, according to Google.
For example, an important User metric is Active Users, which is the number of distinct users who visited your website or app for more than 10 seconds (but it also includes certain events like first visit or first open… more on that later).
What Are GA4 Dimensions?
Dimensions, or custom dimensions, on the other hand, are attributes that provide context to your data, usually in the form of text instead of numbers.
Examples of dimensions include transaction ID, user location, and audience name.
While GA4 has more built-in conversion data, you’ll need to reprogram them for custom conversions. They must first be created as ‘Events’ in Tag Manager or GA4 and then marked as conversions to work.
And if you’re using an analytics API configuration through a third-party app or platform, such as Shopify or WordPress? “These platforms have not caught up to all of the GA4 nuances and we have experienced issues with these configurations, resulting in the need to revert to hard-coding in the GA4 snippets,” says Lopez.
15 GA4 Metrics You Need to Track
Although we bid farewell to some familiar metrics that either didn’t survive or were otherwise altered during the transition from UA to GA4. Some of these changes may affect your data so please keep them in mind when using your Google Analytics reporting tool.
But the GA4 metrics that remain - or were added - are important for monitoring the success of a website as well as your client's digital marketing campaigns.
Here are the most important GA4 metrics to track.
1. Total Users
To be fair, Total Users technically survived the switch to GA4 and it still means the same thing (i.e. total number of users) in both Universal Analytics and Google Analytics 4. But the big difference in GA4 is that Total Users is no longer the primary user metric like it was for Universal Analytics (UA).
Instead, Total Users has been replaced by Active Users as the new primary user metric in GA4. So Total Users is still around, it’s just not as important as it used to be.
Please be aware that when UA talks about Users, it means Total Users, but when GA4 mentions Users, it’s talking about Active Users. Make sure to keep this difference in mind because it may affect your reports because the same name applies to different metrics.
2. Pageview
Pageview remains relatively unchanged between UA and GA4, but GA4 tweaked the definition of Pageview–and your agency needs to be aware of it.
In Universal Analytics, Pageview refers to the total number of pages viewed, while GA4 combines the number of web pages viewed with the number of screen views as well.
So if you notice a substantial increase in Pageviews after switching to GA4, remember to account for the fact that GA4 combines both app and web views, while UA tracks them separately.
Also, keep in mind that Views in GA4 means the same thing as Pageviews in UA.
Goodbye, Unique Pageview
On the other hand, Unique Pageview wasn’t so lucky. You might remember Unique Pageview as the metric in UA that tracked the total number of pages viewed without duplicates, but this metric is not available in GA4.
3. Session
While the Session metric is still around in GA4, it’s not exactly the same as what you got in UA.
In GA4, a Session is also known as a Session Start, and every new session generates a session ID, which makes it easier to track each and every event that occurs during that session.
But unlike in UA, sessions in GA4 are not automatically restarted at midnight.
4. Conversions
In UA, Conversions are defined by goals, whereas in GA4, Conversions depend upon the actions you specify as conversion events.
The big difference here is that “UA counts only one conversion per session for each goal” while GA4 counts every instance, even if the conversion event repeatedly occurs in a single session.
“Models such as "last click" or "first click" are outdated in today's real internet environment where a customer has hundreds of micro-interactions with a brand before making a conversion action,” says Lopez.
In fact, cross-channel attribution modeling in GA4 is much more advanced and better reflects the customer’s journey. While marketing agencies still struggle with getting attribution as close to the truth as possible, Lopez adds that “GA4 gets closer to that real journey.”
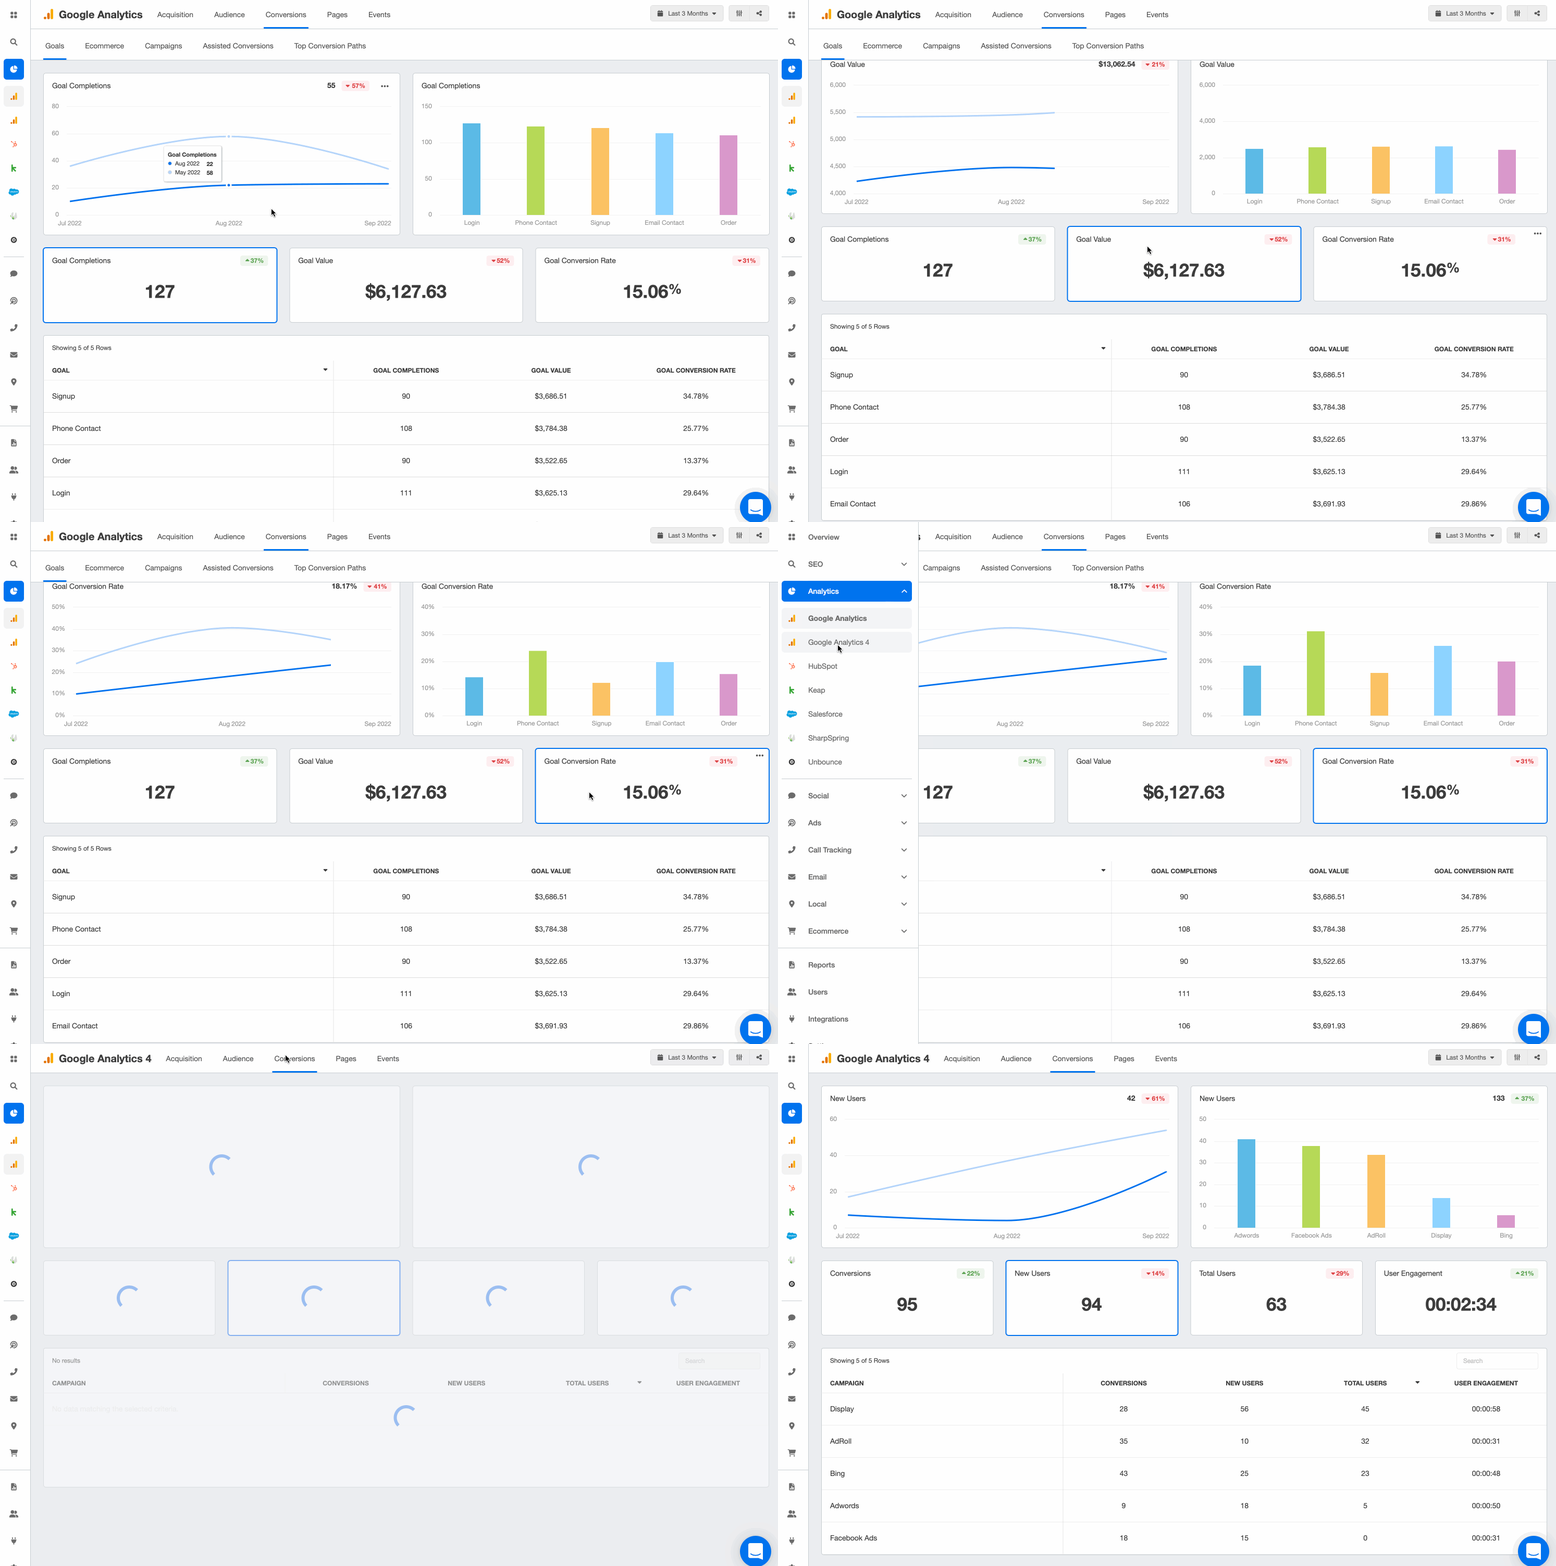
Prepare for a smooth transition to GA4. Seamlessly switch between Google Analytics and GA4 conversion metrics to identify any gaps in your metrics. Try AgencyAnalytics free for 14 days!
5. Bounce Rate
Bounce Rate, a much-debated metric in the Universal Analytics world, is making a bit of a comeback. GA4 has resurrected bounce rate. But much like something brought back from the dead, it’s no longer the same. The name stayed the same, but it’s different now.
In UA, Bounce Rate was the percentage of people who leave your webpage without interacting with it at all (i.e. no clicks whatsoever). But it didn’t matter whether they spent 5 seconds or 10 minutes on your page. As long as there were no interaction events, it counted as a bounce in UA.
Meanwhile, GA4 has changed the definition of Bounce Rate to the “percentage of sessions that were NOT engaged sessions”, where an engaged session is any session that:
Lasts 10 seconds (or longer)
Has at least 1 conversion event
Has at least 2 pageviews
If a visitor doesn’t meet the requirements of an engaged session, GA4 will count it as a bounce.
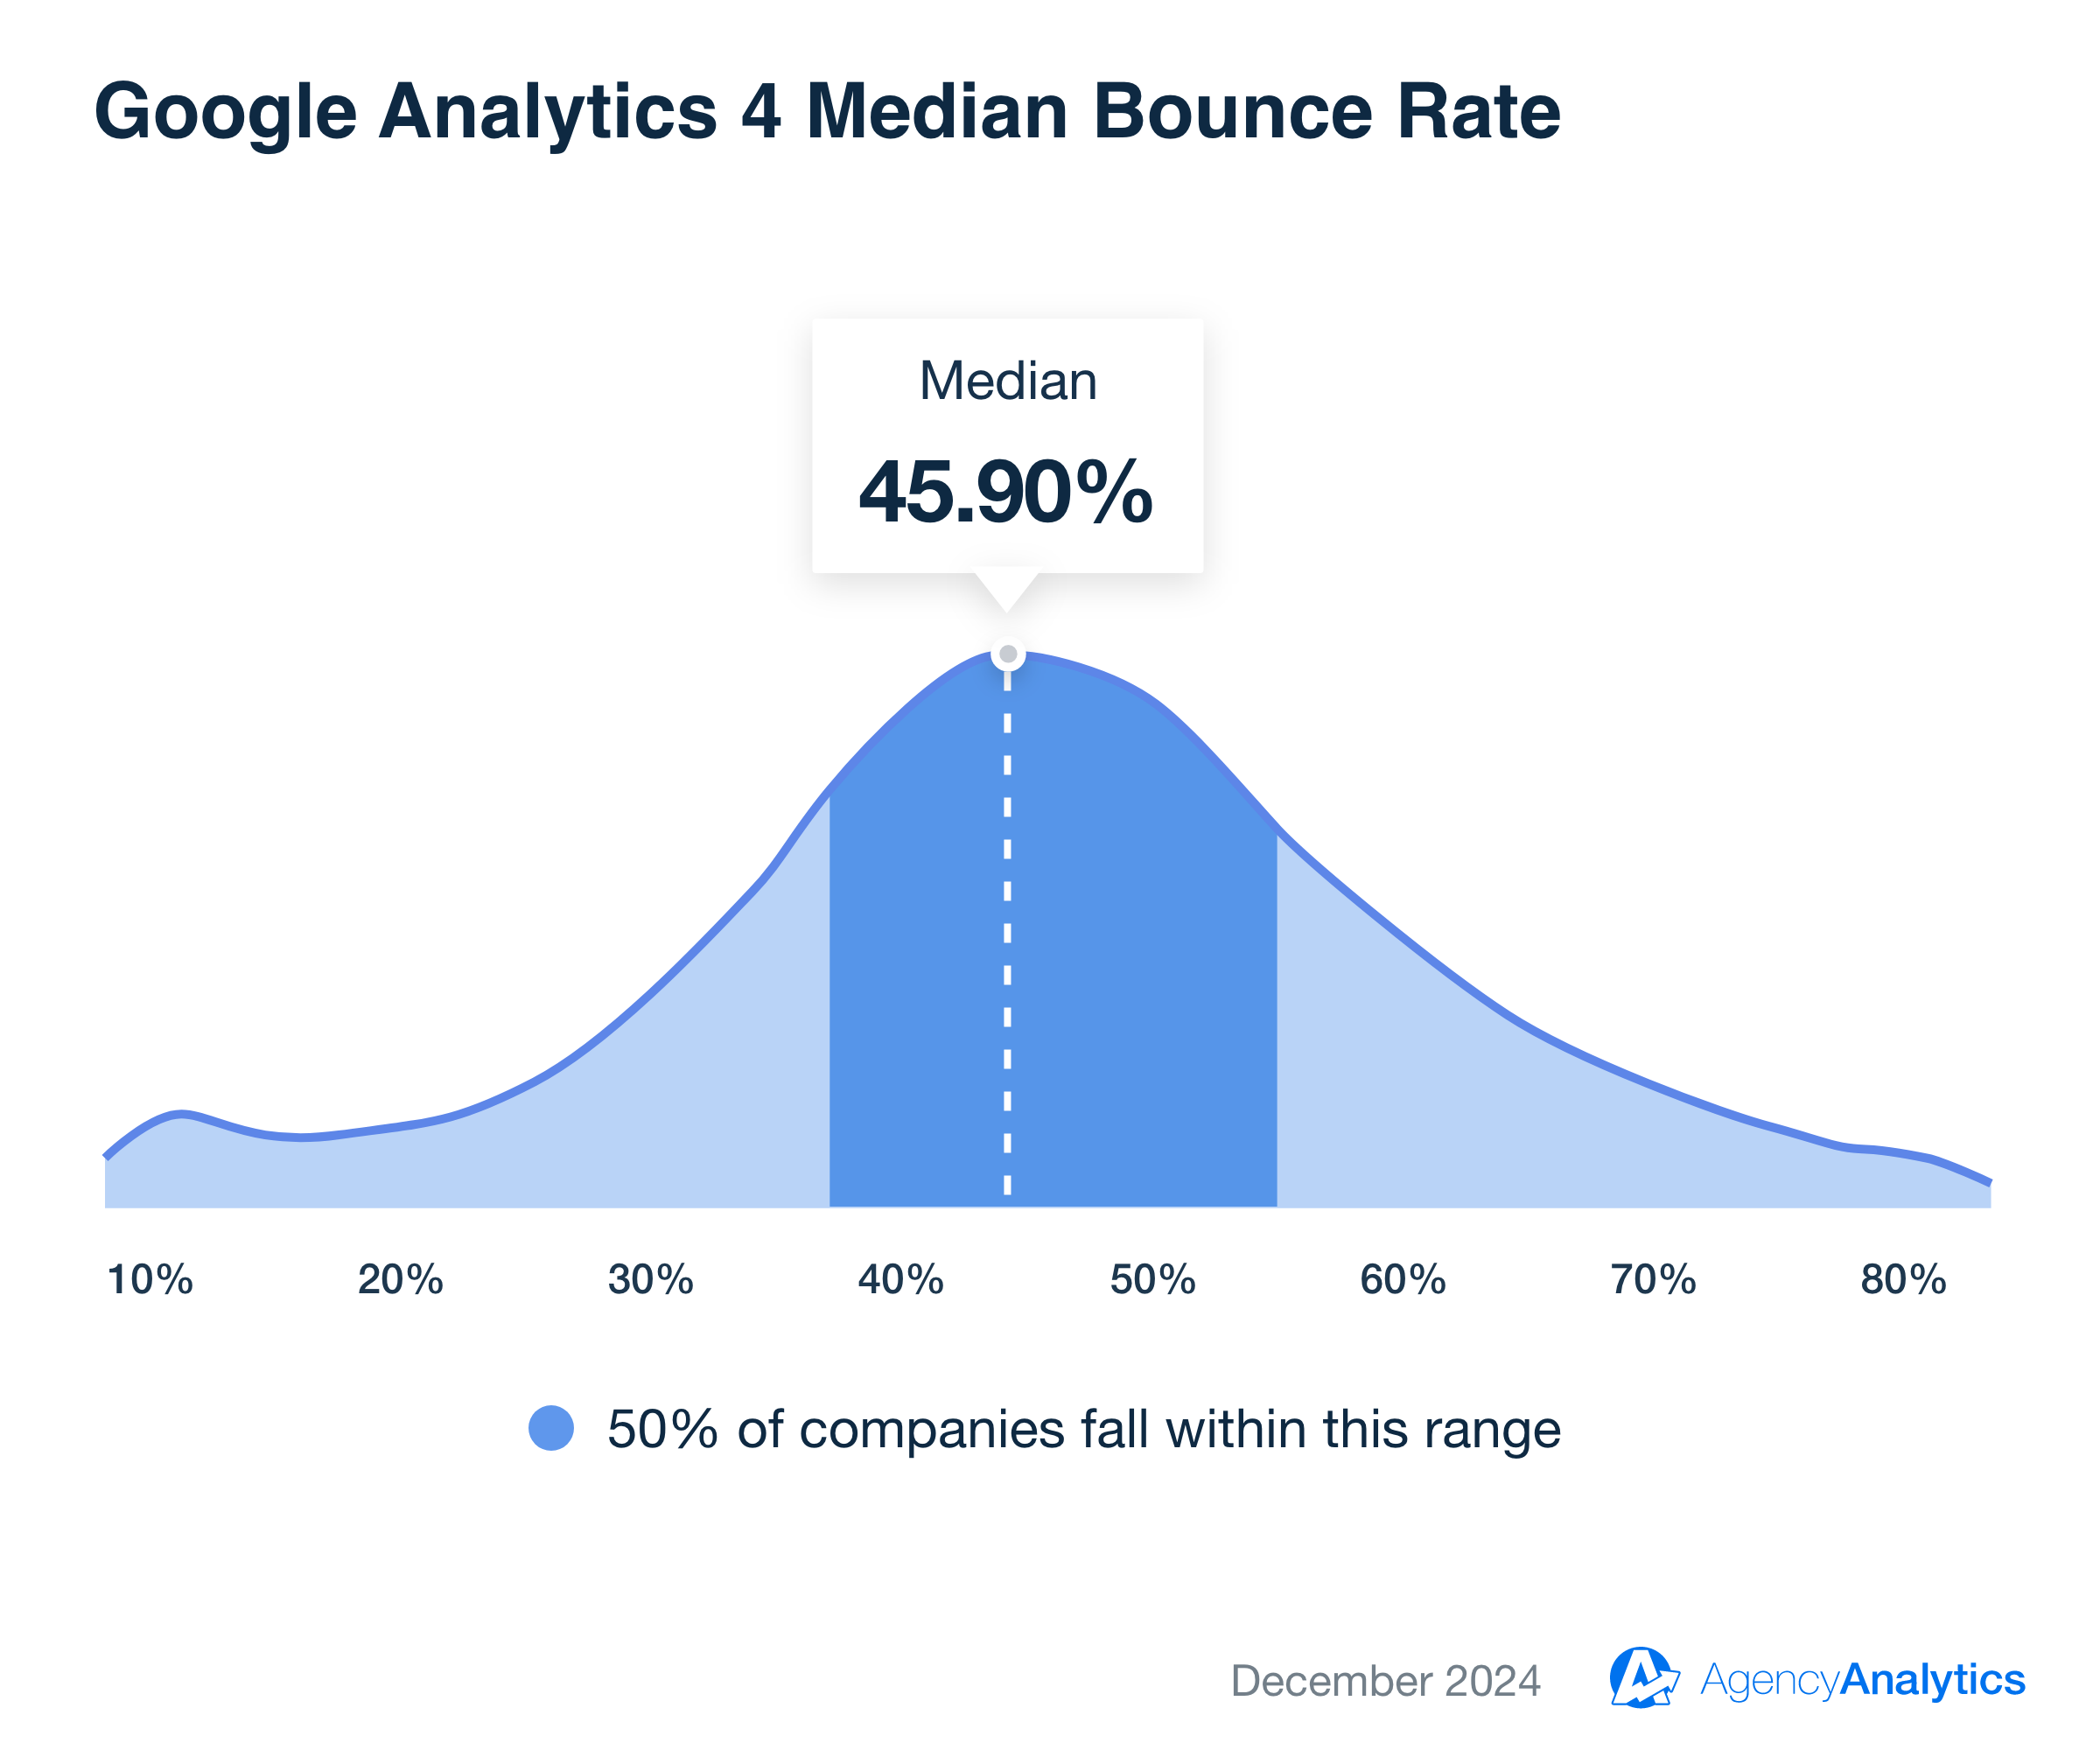
Based on data from over 150,000 digital marketing campaigns managed by the over 7,000 marketing agencies who trust AgencyAnalytics as their reporting partner, the current median GA4 bounce rate is 45.9%. This is excellent data to have at your fingertips, but it gets even better when you can dig into how that bounce rate varies by industry!
In GA4, Bounce Rate is the Inverse of Engagement
Additionally, GA4 makes the relationship between Bounce Rate and engagement a lot more clear as Bounce Rate is the inverse of Engagement Rate.
[This means that if your Bounce Rate in GA4 is 30%, then 70% of your user sessions were engaged].
GA4 defines Bounce Rate differently in an attempt to better measure engagement because UA’s focus on getting clicks and interaction doesn’t always tell the whole data story.
For example, if someone spends 10 minutes reading one of your blog articles and then leaves without clicking on anything, UA would automatically count that as a bounce. But in GA4, that same behavior will be counted as an engaged session (since 10 minutes is way longer than 10 seconds), making it a more accurate interpretation of the value and engagement provided by that blog article.
6. Event Count
When it comes to Event metrics, Total Events from UA did not survive the switch to GA4. Instead, Google Analytics 4 has Event Count, where all actions are considered events, and it’s the total number of times an event occurs.
Analytics can even process your client’s event data and create an Events report.
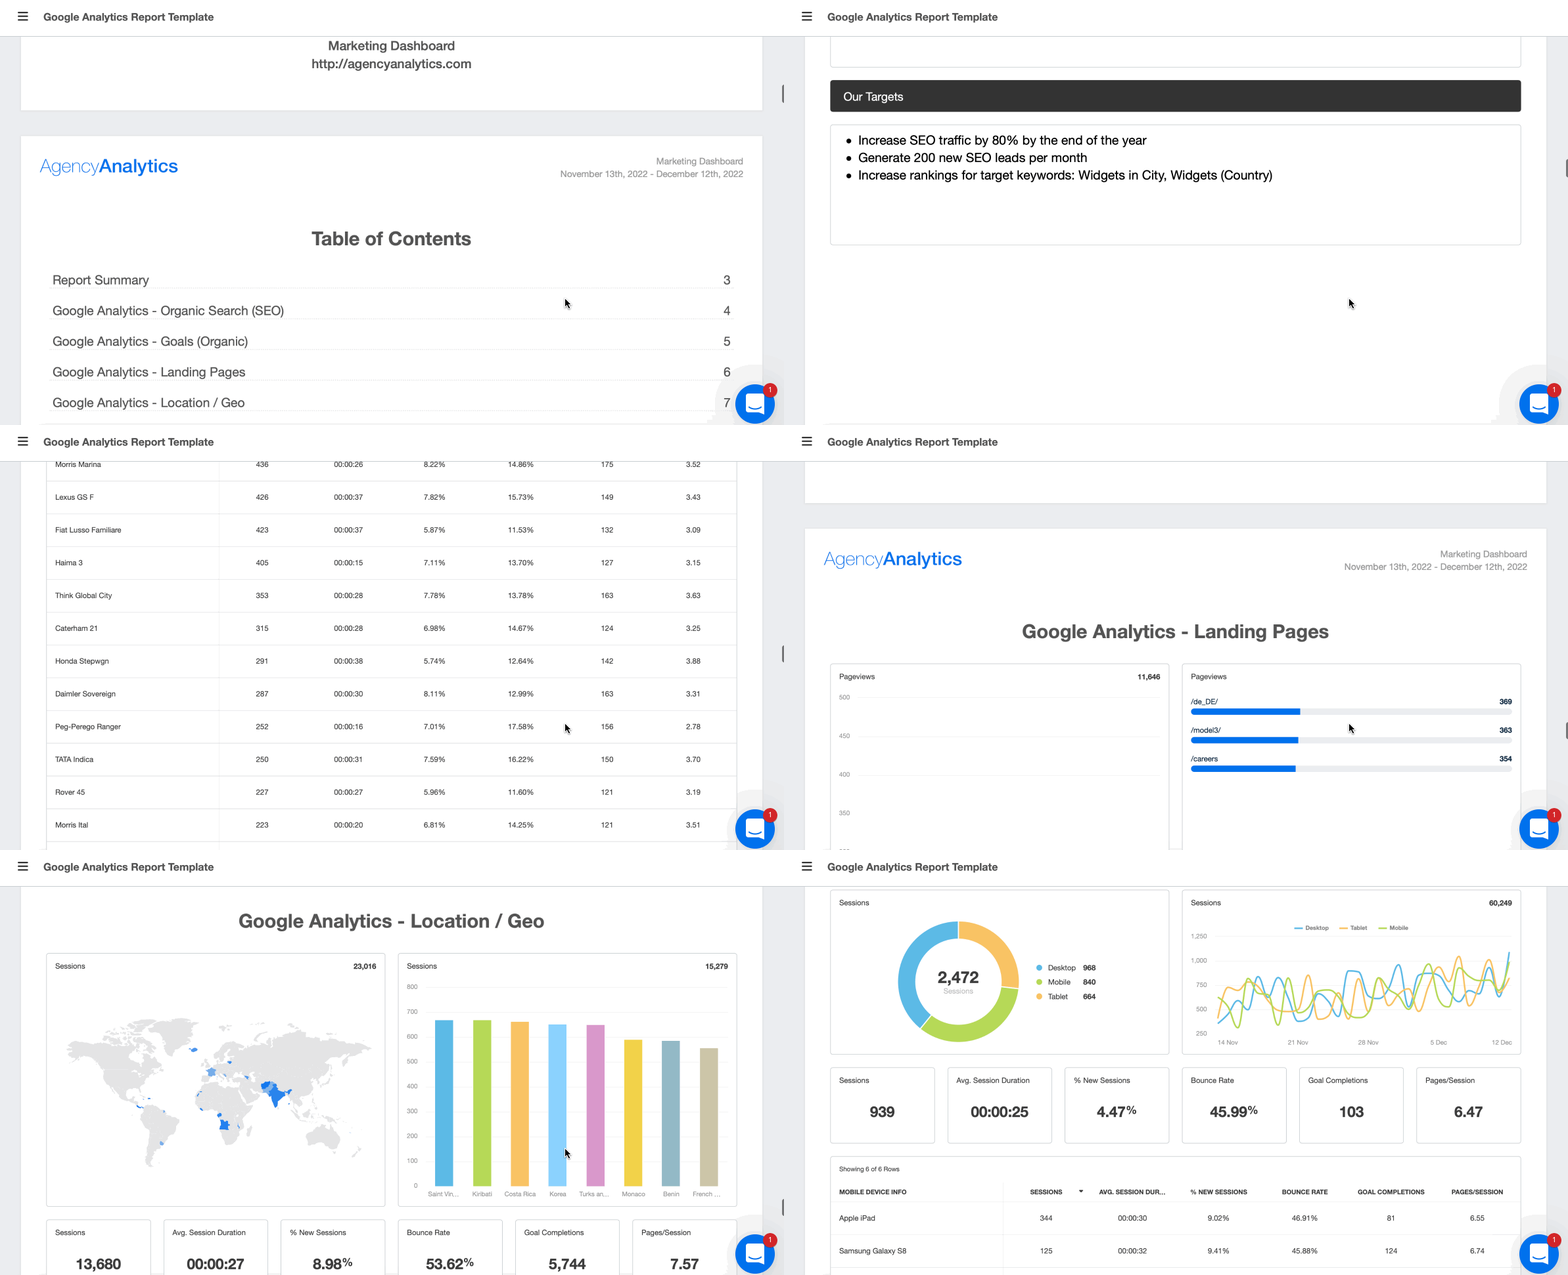
Use this exact Google Analytics report template and get your reports done in minutes! Try it free for 14 days.
7. Sessions Per User
Sessions Per User is a new GA metric that didn't exist in the Google Universal Analytics version. Instead, Universal Analytics focused on metrics like Sessions and Users separately.
This metric isn't about quantitative measurement such as counting how many times a user dropped by; it's about understanding the frequency of their visits. High sessions per user metrics signal returning visitors and an engaged audience. This metric is like the pulse of user interaction, giving a rhythm to your user analytics. It's about uncovering patterns of user behavior, unearthing trends, and–most importantly–keeping the conversation going.
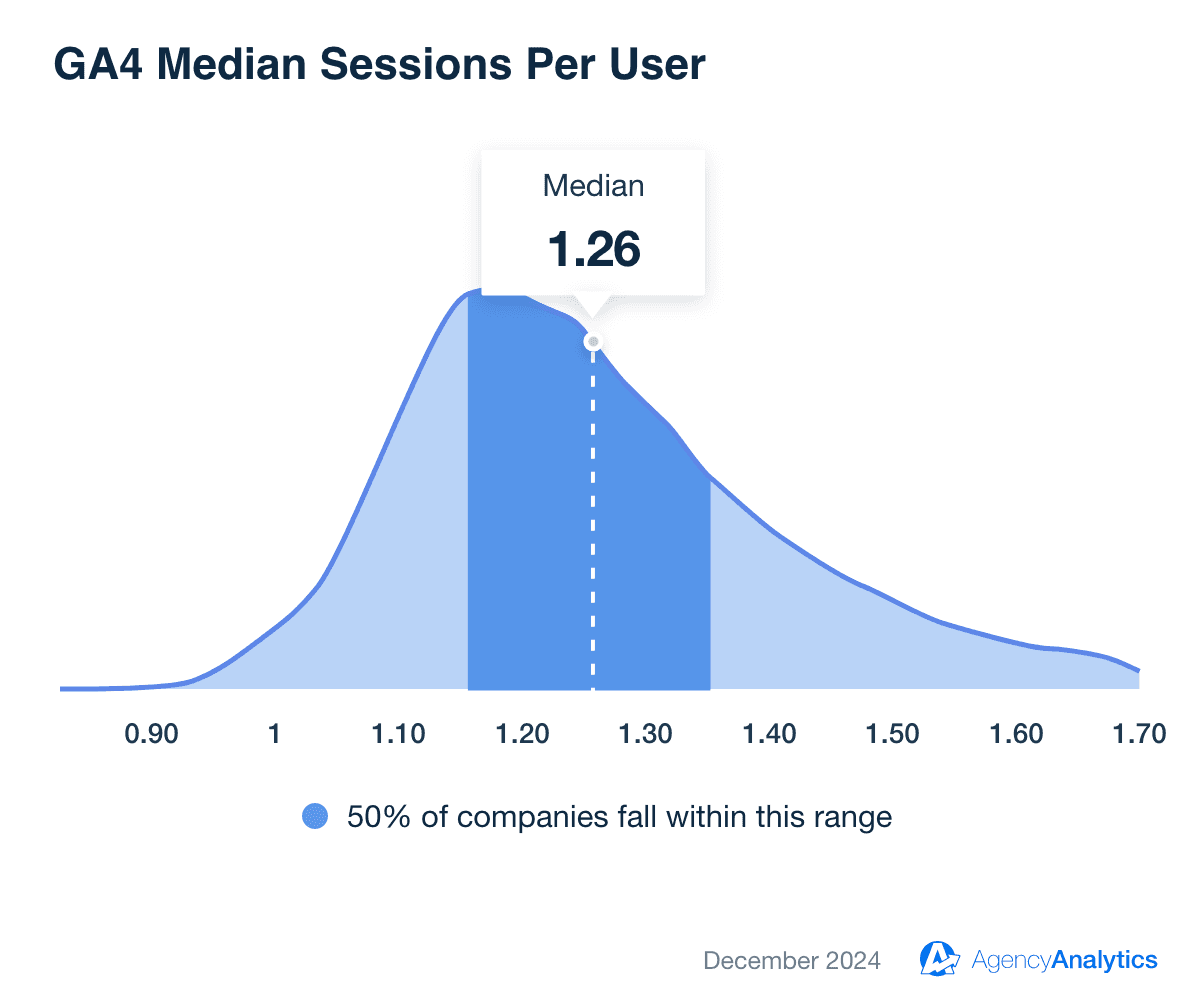
The average SMB website generates 1.26 sessions per user, which reflects opportunities for growth... and a great way to show off how your agency exceeds these industry standards!
[For more information on the differences between Universal Analytics and Google Analytics 4 metrics, check out the article Comparing metrics: Google Analytics 4 vs Universal Analytics.]
8. Active Users
Active Users is one of the most important new metrics in GA4 because it’s the primary metric in the User category (as we learned earlier). If you remember, this metric tracks the number of users who visited your site or app and had an engaged session (which means they either stayed longer than 10 seconds, had at least one conversion, or had at least two pageviews).
Another way to be counted as an active user is if certain events occur during your session such as first_visit, first_open, or user_engagement.
9. New Users
One might wonder, "Why should I care about new users?" Others may wonder why you are wondering that. The new users metric is like a beacon on the horizon, showing just how far a digital ship has sailed.
It counts the number of first-time users during a given period, essentially putting a number to your client’s reach. The greater the number of new users, the wider the digital presence.
10. Engagement Rate
As we mentioned earlier, the Engagement Rate is the inverse of the Bounce Rate, and it’s found under the Session category. This means if your client’s Engagement Rate is 70%, they’ve got a Bounce Rate of 30%.
According to Google, “the Engagement Rate is a percentage with the number of engaged sessions divided by the total number of sessions over a specified time period”.
11. Average Engagement Time
This metric shows the average time your client’s webpage holds the attention of visitors. Typically, the longer people spend on a webpage, the better.
Understanding the various components of engagement—such as average time on page and average session duration—provides a comprehensive view of user behavior, helping to refine strategies and improve performance.
Time on Page: Measuring the average amount of time users spend on a specific page, this metric highlights which content is holding attention and which pages may need improvement. For example, pages with high Time on Page often indicate engaging content, while low values could suggest that users aren’t finding the information they need.
Session Duration: This metric provides a broader view by calculating the average length of time users spend during a single session on the site. It encompasses all user actions, including navigation across multiple pages, giving insight into overall site engagement rather than focusing on specific content.
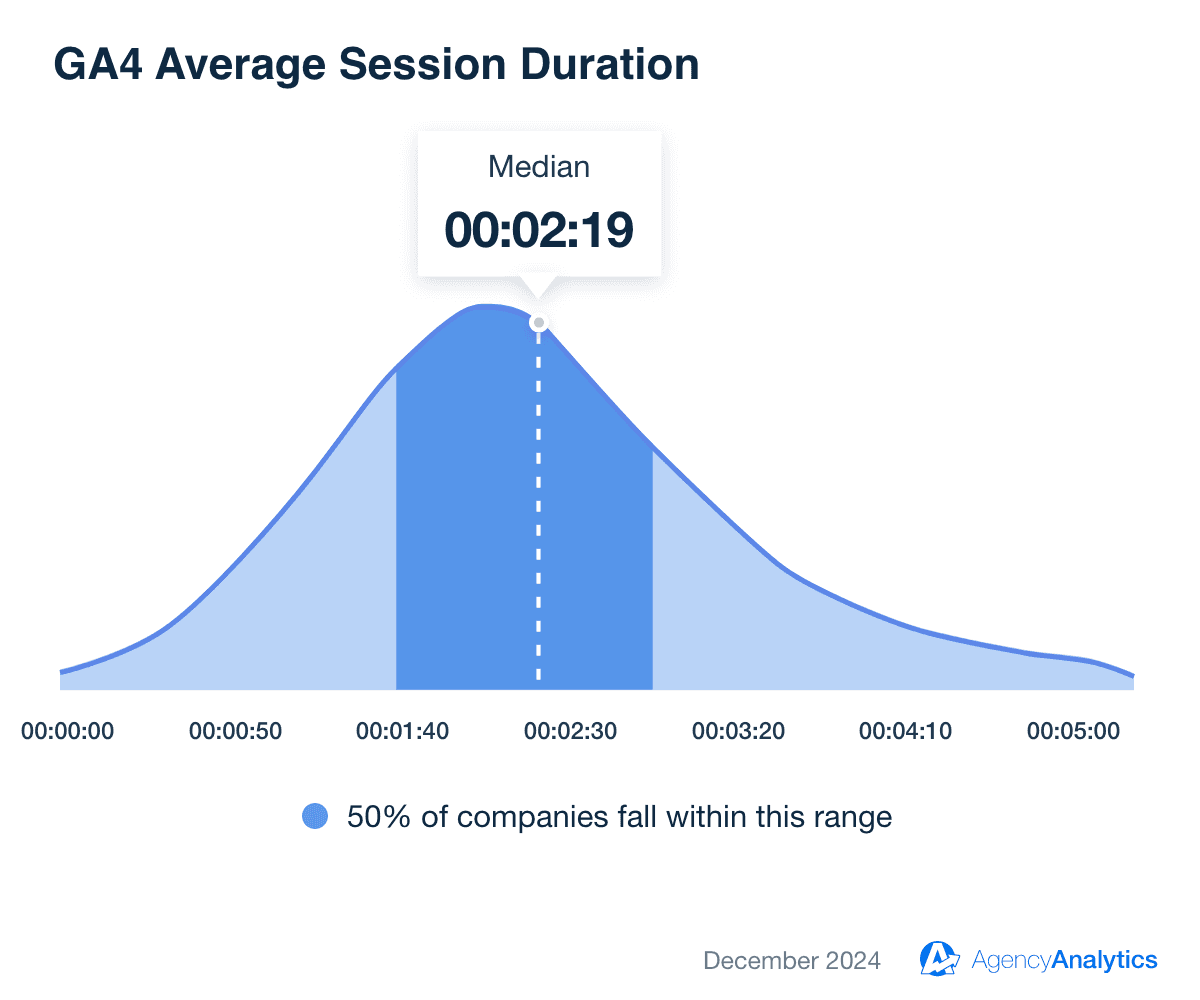
For example, the GA4 Average Session Duration benchmark for December 2024 was 2 minutes and 19 seconds, based on over 150,000 digital marketing campaigns run by marketing agencies.
12. First-Time Buyers
Every time a user transforms into a buyer for the first time, it's like a digital high-five. The first-time buyers metric is more than a sales statistic. It's the spark that kindles the flame of customer loyalty. This metric is a clear indicator of the efficacy of your conversion strategies. It's not just about ringing the digital cash register but about cultivating relationships that might just stand the test of time.
13. Lifetime Value (LTV)
Lifetime Value measures the value of your client’s customers (i.e. how much they spend) across the entire customer lifecycle, from acquisition to churn.
14. ARPU
ARPU, or Average Revenue Per User is generated by dividing the total revenue by the total number of users. This metric provides valuable insight into how much income each user contributes, which is critical for assessing the financial health of your website or app.
It also helps evaluate the effectiveness of marketing campaigns by linking user activity to revenue. Monitoring ARPU over time or benchmarking it against industry standards allows for a better understanding of performance.
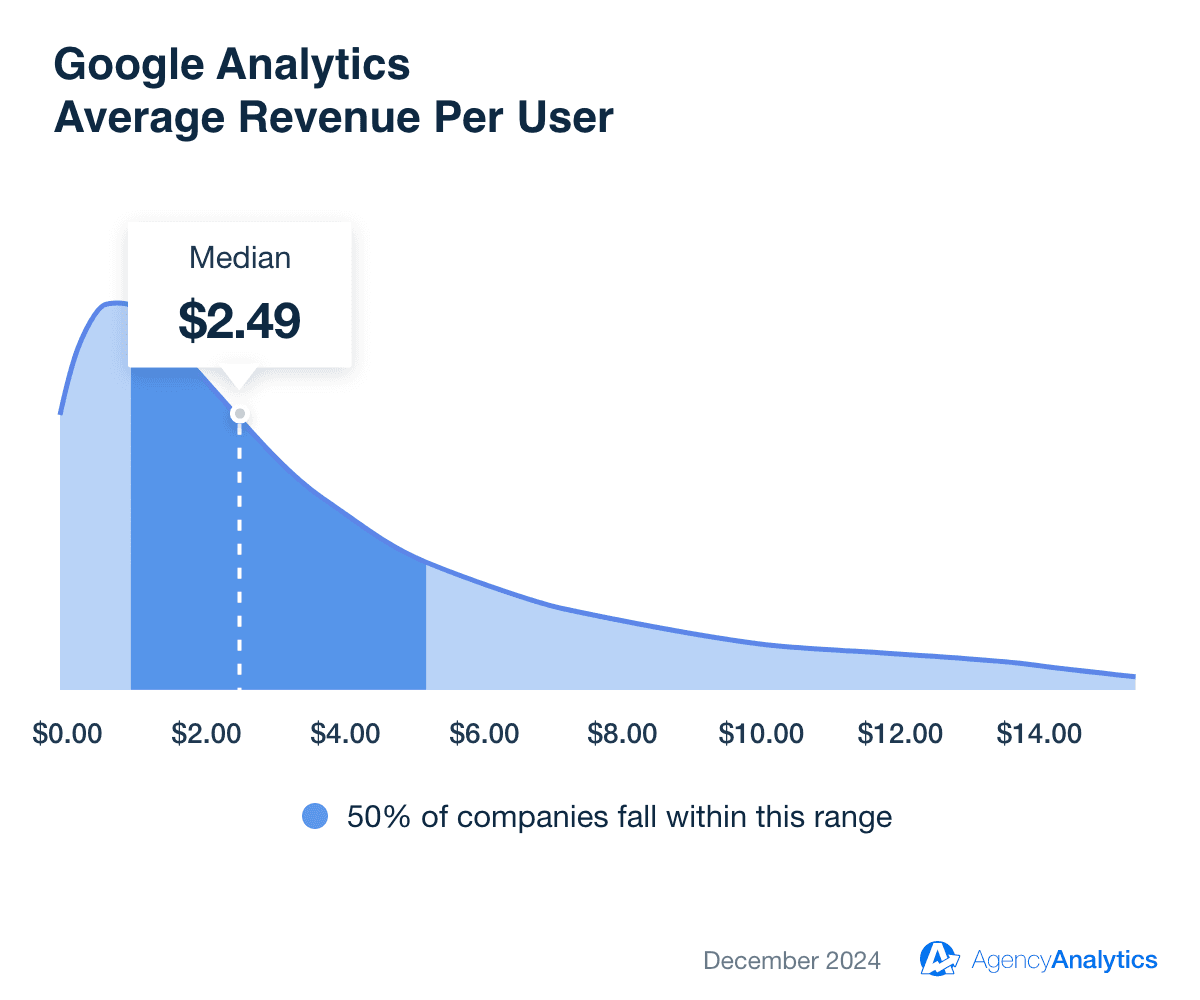
For example, the ARPU for a typical website managed by a professional marketing agency currently sits at $2.49, based on recent marketing performance benchmarks.
15. Total Revenue
Regardless of what platform you’re using, you should be tracking total revenue, which is the total amount of all the products, services, and/or subscriptions your clients sell.
Types of Metrics in Google Analytics 4
It can be helpful to separate your metrics into different categories because grouping them together makes it easier to see what you’re trying to measure and how.
Acquisition Metrics
Hiding among the most important GA4 metrics are a handful of acquisition metrics. You should keep an eye on these metrics because they measure how you acquire new customers, usually through building awareness and interest in your clients’ brands.
You’ll recognize some of these metrics as we’ve already gone over them, but there are also some we haven’t gotten to yet (and will get to later).
Let’s have a look at a few of the most important acquisition metrics for GA4:
Sessions
New Users
Total Users
Event Count
Engagement Metrics
Engagement metrics measure how the audience interacts with your client’s website, ads, and other content. Examples in Google Analytics 4 include:
Pageview (aka Views)
Bounce Rate
Active Users, broken down by Daily (DAU), Weekly (WAU), or Monthly (MAU)
Engagement Rate
Average Engagement Time
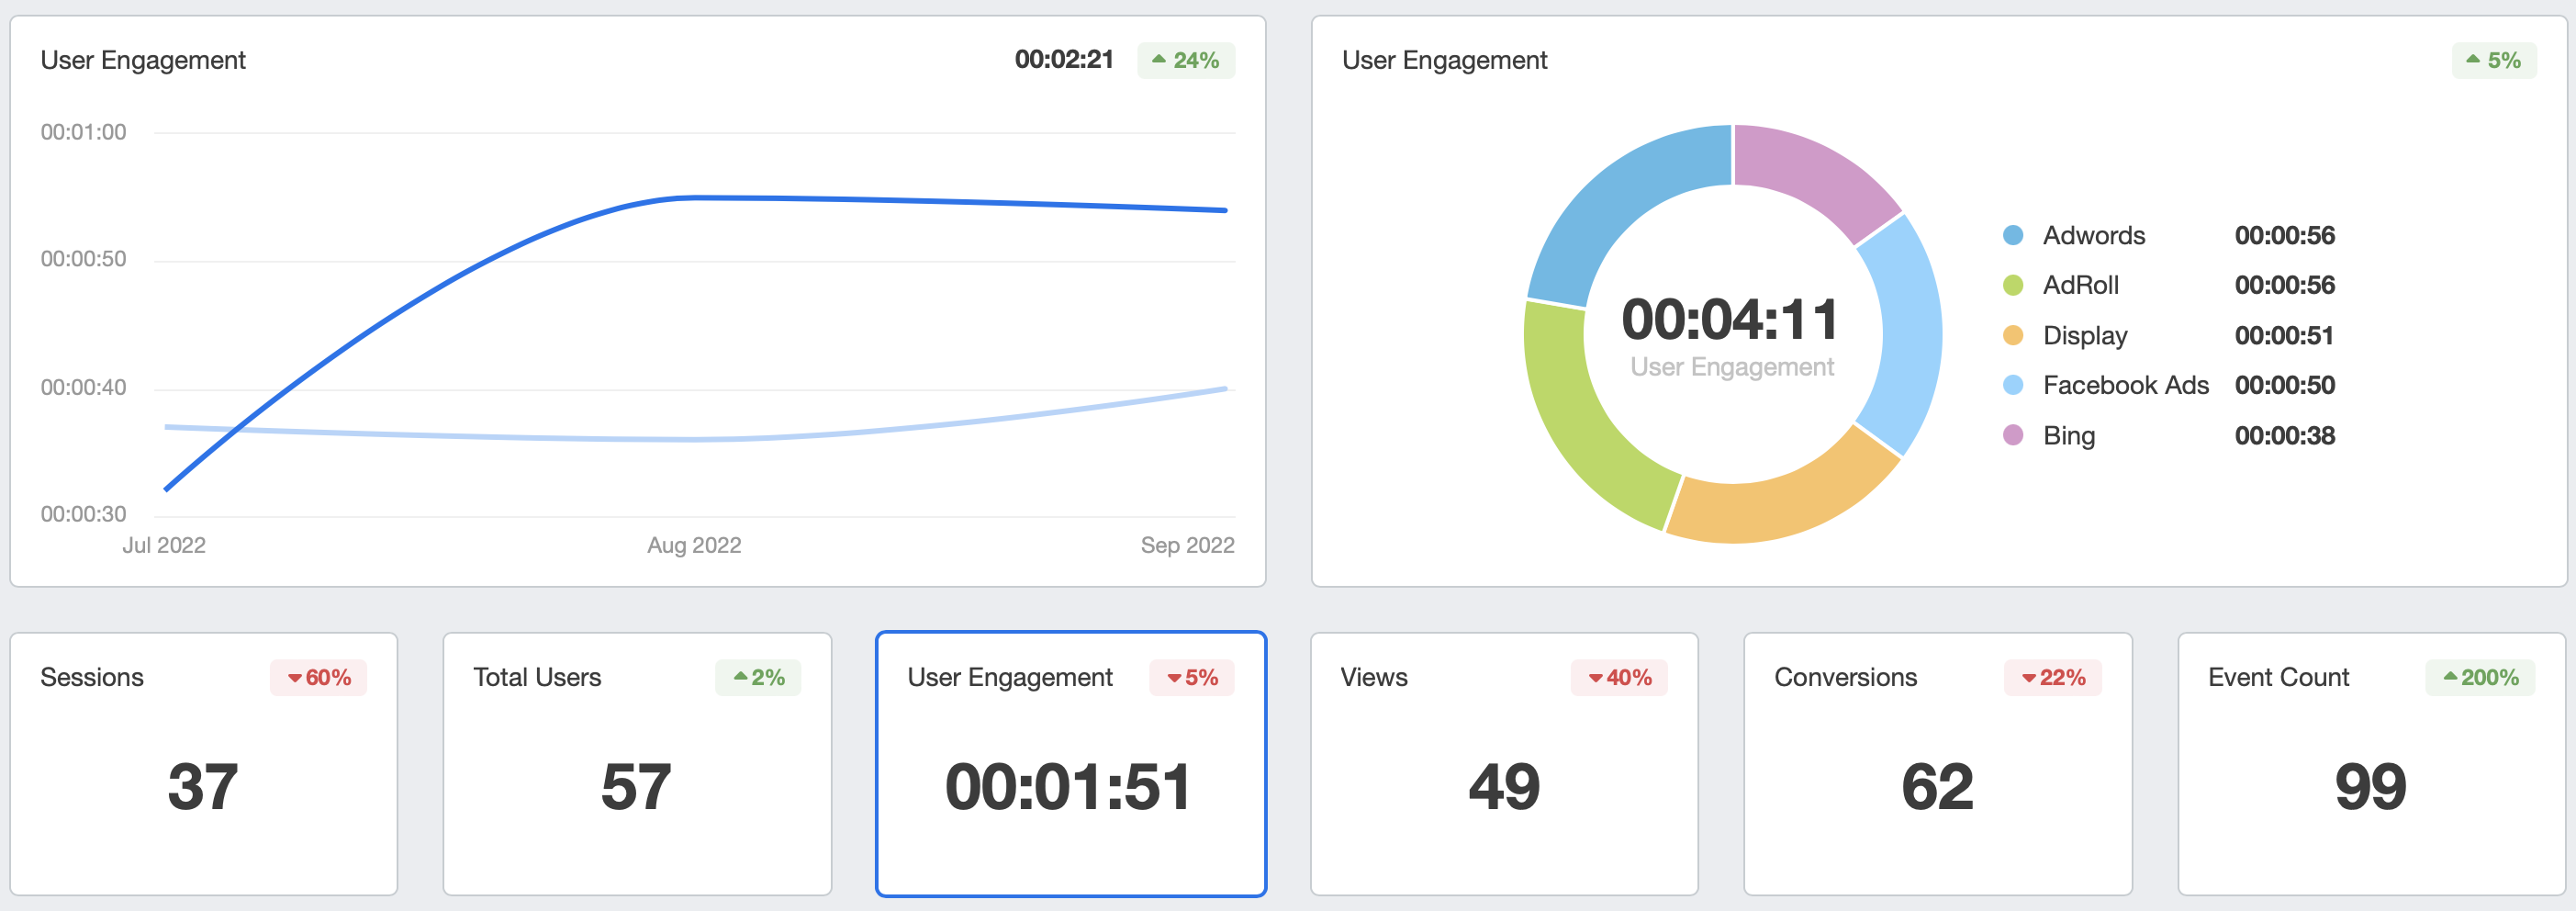
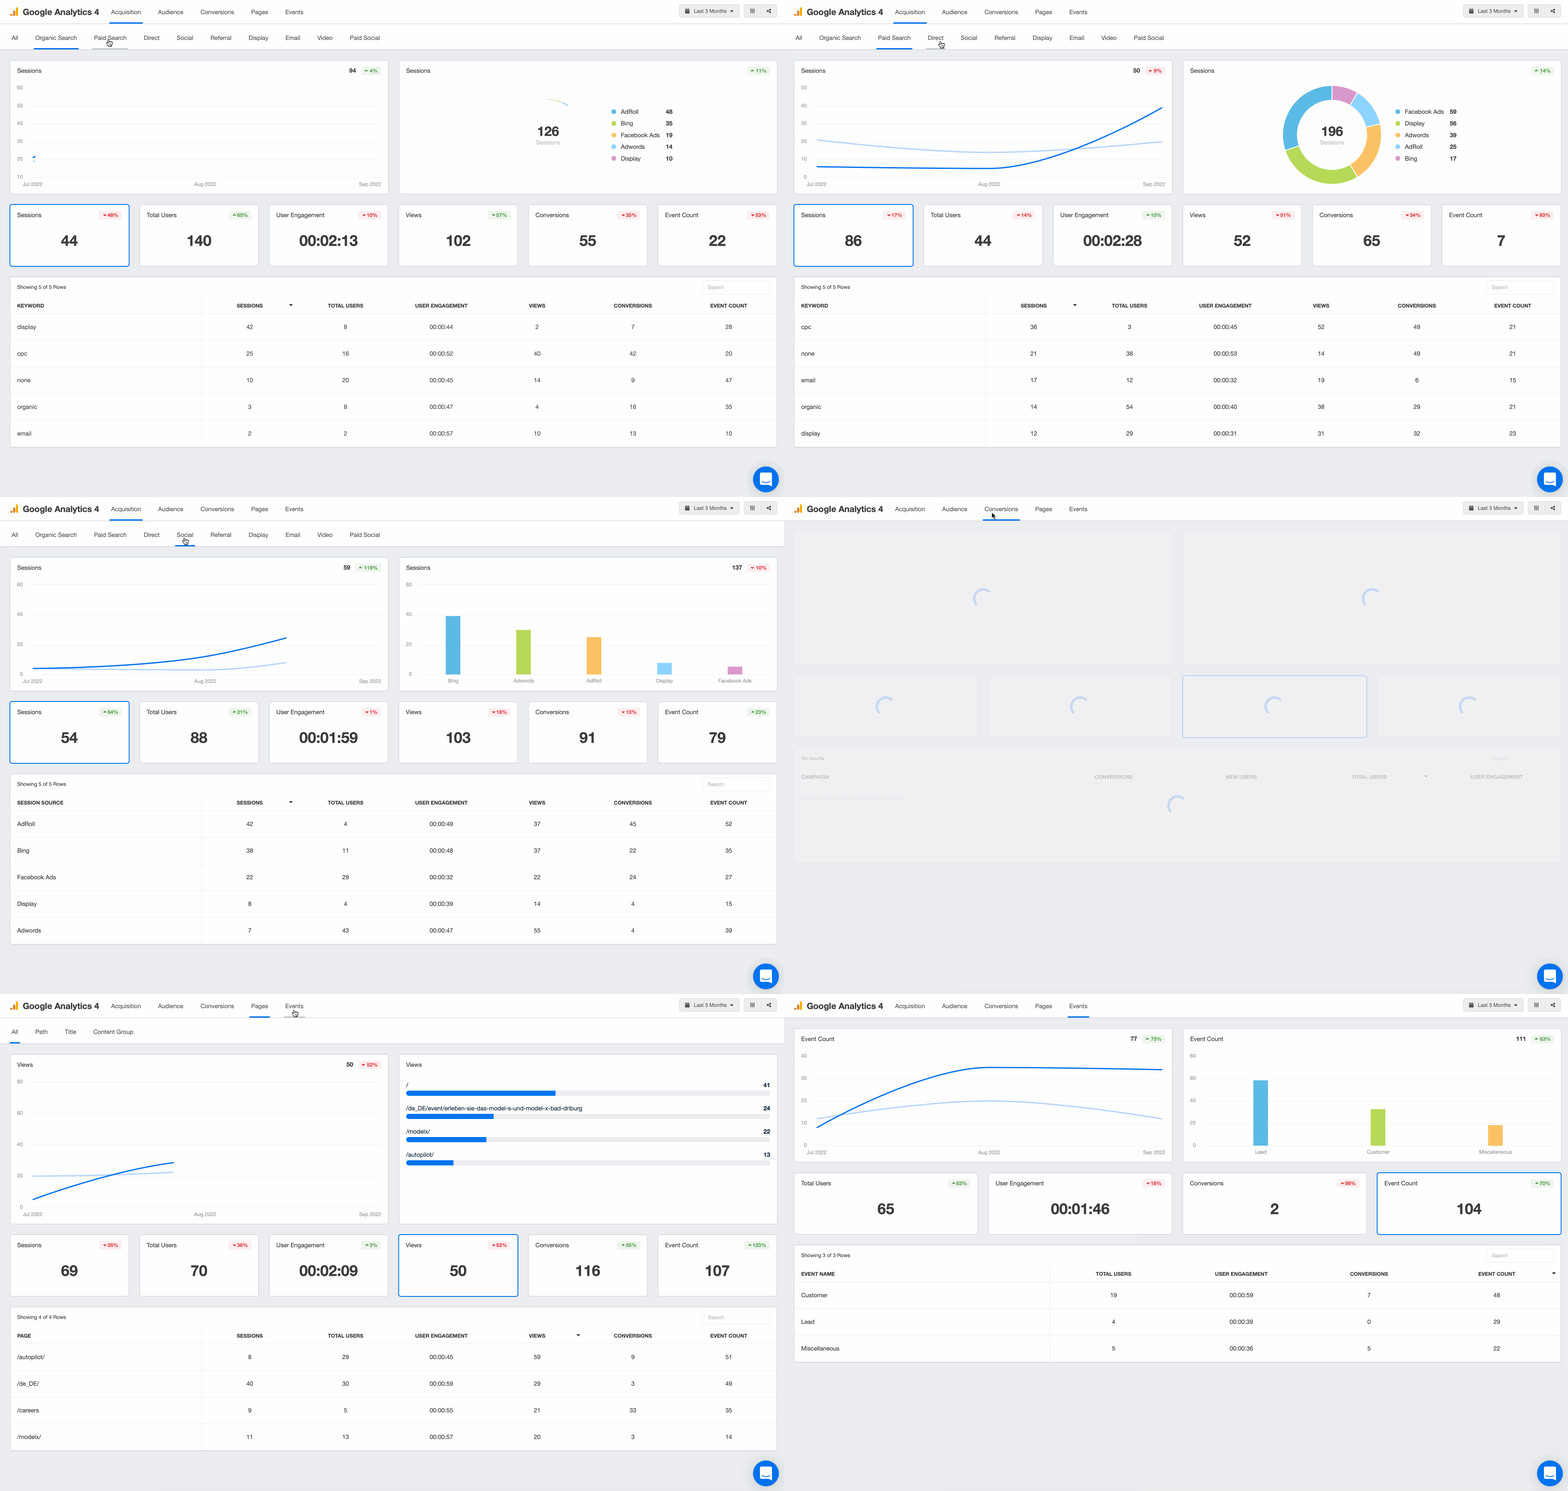
Get up-to-date engagement metrics for each of your clients’ Organic, Paid, Direct, Social, Referral, Display, Email, Video, and more. Try AgencyAnalytics free for 14 days.
Monetization Metrics
Monetization metrics measure revenue and how your clients generate it, whether it’s from items, ads, or subscriptions. Important monetization metrics in GA4 include:
How Many Metrics Should I Track?
There isn’t a set number of metrics that every agency should be tracking because your clients all have different needs and goals and it’s up to you as their agency to adapt to them. With that being said, here are a few of the most important metrics you should be tracking in GA4.
(You might notice that some metrics also appear as Google Ads metrics. While it may be confusing, the biggest difference between Google Ads and GA4 is that Google Ads only tracks clicks on the ads, whereas GA4 tracks everything after you’ve clicked on a link, ad, or webpage.)
The metrics in Google Analytics 4 are spread over ten categories:
Advertising
Ecommerce
Event
Page / screen
Predictive
Publisher
Revenue
Session
User
User lifetime
Navigating the GA4 Transition
Swapping the familiar terrain of Universal Analytics for the uncharted territories of GA4 may often felt like learning a new language. It was like moving from a comfortable old house into a swanky new loft. It's different, and it took a bit of time to figure out where everything is.
But there's no need to worry. This section offers some practical tips to smooth out those initial bumps on the road to GA4.
Understanding the User-Centric Approach
GA4 thinks differently. It's not about counting visits; it's about understanding experiences. It puts users at the heart of every metric, every report, and every insight. Embracing this user-centric approach isn't a strategy; it's a mindset. It's about swapping the magnifying glass of Universal Analytics for the telescope of GA4, taking a closer look at individual user behavior, their interactions, and their journeys.
Diving into Events
In the world of GA4, 'events' are the new cool kids on the block. They're not about tracking visits but about capturing interactions. Exploring the event-based model of GA4 isn't about learning a new metric; it's about reimagining the way we understand user behavior. It's about swapping the stopwatch of Universal Analytics for the photo album of GA4, where every interaction tells a story.
Experimenting with GA4’s Analysis Hub
GA4’s Analysis Hub isn't just another tool in the toolkit; it's a sandbox for data enthusiasts. It offers an array of templates and techniques to slice, dice, and dissect data. It's not about running standard reports; it's about creating bespoke analyses tailored to unique needs.
Patience Is Key
Getting the hang of GA4 is not a race; it's a journey. It takes time to unravel the many facets of this new platform. But remember, every great journey begins with a single step. So, here's to stepping into the brave new world of GA4, one metric at a time.
In a nutshell, transitioning to GA4 isn't just about switching platforms; it's about adopting a new perspective on user analytics. So, buckle up and gear up for this exciting adventure. Who knows, GA4 might just turn out to be the best thing since sliced bread. Or at least, since Universal Analytics.
Tracking All Your Marketing Metrics Under One Roof
With GA4, you can measure practically anything, even custom metrics. In fact, it comes with so many metrics and dimensions that it can be hard to tell where to start. The resounding advice? “start playing with it now, says” Hogan.
If you’re worried about adding another platform to your plate, don’t be. Using all-in-one client reporting software helps you track everything you need to get your agency proficient in GA4.
AgencyAnalytics has helped us seamlessly incorporate GA4 reporting for our clients. We are excited to seeing how we can can expand our GA4 reporting by identifying and reporting on a slew of new KPIs found in GA4.
Rick Hogan, CEO & Co-founder of Bleevit
Without context, the KPIs and metrics alone won’t give you actionable insights into how your client campaigns are performing. Give meaning to your campaigns by presenting Google Analytics data alongside your clients’ other marketing metrics like social media analytics, email marketing, and more.
Choose from dozens of pre-built report templates, including the Marketing Report Template, Google Analytics report template, Digital Marketing Report template, Facebook Ads Report template, and more!
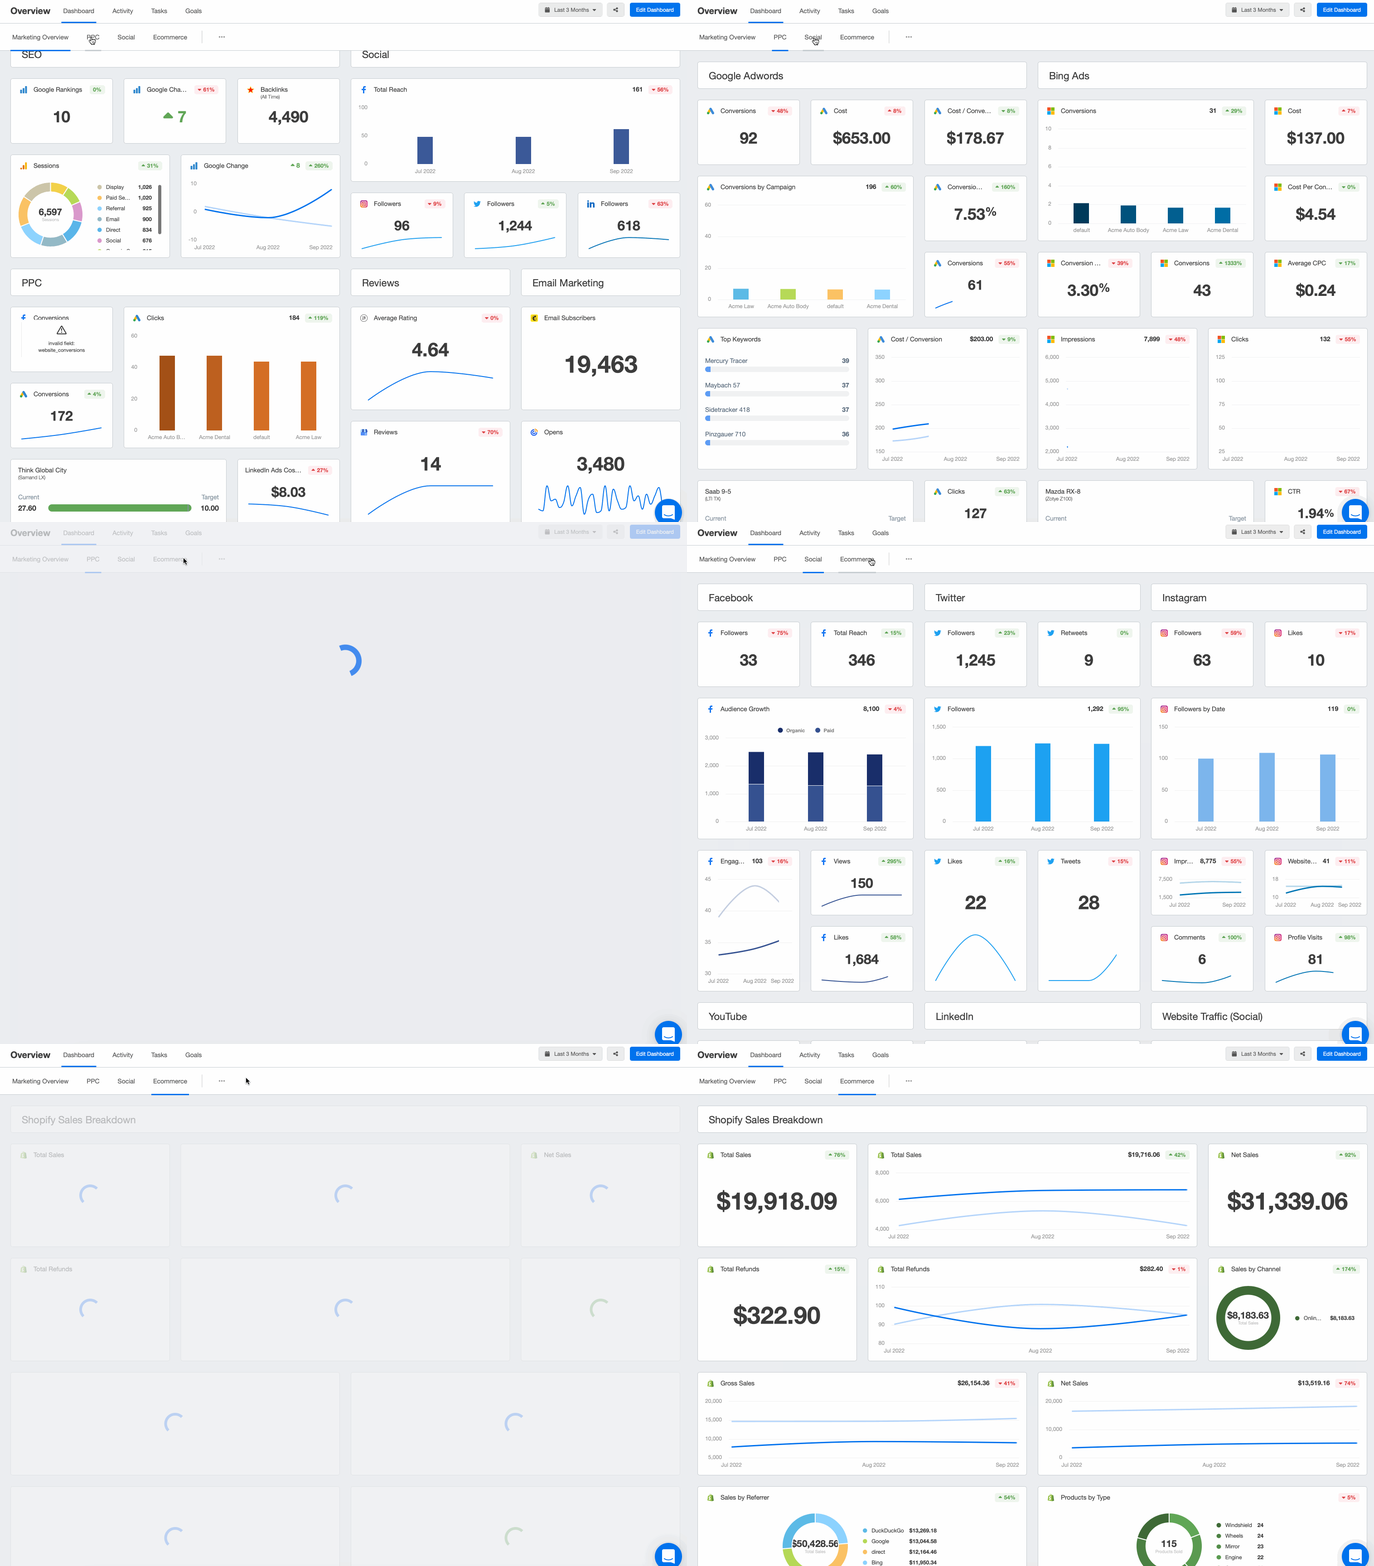
With over 80 integrations to choose from, AgencyAnalytics puts all your clients’ data under one manageable umbrella, saving you time, and billable hours each month. Start your free 14-day trial today.
FAQs About GA4 Metrics
Still have questions about GA4 Metrics? Don’t worry—we’ve got you covered.
Active Users shows how many users are actually engaging with your client’s site or app. This includes people who spend at least 10 seconds on the website, view more than one page, or trigger a conversion event. It's a reliable way to monitor user retention and determine if marketing efforts are reaching the right audience.
User Lifetime reveals how much long-term value a user brings to your client. It highlights revenue, engagement, and conversions across the entire customer journey. This helps agencies identify which campaigns deliver loyal, high-value users.
A transaction in GA4 is tracked as a 'purchase' event. It captures details like transaction ID, revenue, and item data. This shows how well your client’s site converts traffic into paying customers.
Engagement Rate measures the percentage of sessions where users spend at least 10 seconds on your client’s site, visit two or more pages, or complete a conversion. Unlike Bounce Rate in UA–which only flagged exits without interaction–Engagement Rate highlights how many users found the content useful.
Event Count shows how often users take tracked actions like clicks or downloads. Event Value is a custom parameter set in GA4 to assign a numeric value to those actions, such as a dollar amount or priority score. These metrics show both the frequency and impact of key user interactions.

Written by
Michael is a Vancouver-based writer with over a decades’ experience in digital marketing. He specializes in distilling complex topics into relatable and engaging content.
Read more posts by Michael OkadaSee how 7,000+ marketing agencies help clients win
Free 14-day trial. No credit card required.


