Table of Contents
QUICK SUMMARY: Getting clients noticed online is one of the biggest jobs an agency takes on. However, as your roster grows, disconnected and manual reporting becomes more trouble than it’s worth. This guide breaks down the SEM metrics that matter, how to read them, and the tools that make tracking, reporting, and proving results easier.
Staring at six separate dashboards at midnight, trying to explain a client’s random CPC spike? You’re in good company. The hidden blessing? Every click, impression, and dollar in search ads leaves a digital trail to follow.
For search engine marketing campaigns, that trail is made of SEM metrics. This guide covers the ones that count—CTR, CPC, CVR, CPA, plus a few that don’t even start with a ‘C’. You’ll also see tools that make tracking smoother, so you can take on more clients without ghosting your Friday night plans (again).
So, open a fresh tab, grab your data, and let’s make this a little less painful—and a lot more profitable.
What Are SEM Metrics?
Think of Search Engine Marketing (SEM) and Search Engine Optimization (SEO) as two very different sisters. SEM is the impatient one. She wants results now, through paid ads, quick clicks, and measurable conversions. SEO is the free-spirited sibling who plays the long game, building organic visibility that lasts.
In practice, it’s simple. Say a client is launching a new line of eco-friendly sneakers. With SEM, you’d run a Google Ads campaign targeting phrases like “best sustainable sneaker” and start driving clicks within hours. You control the ad copy, targeting, and budget.
SEO takes more time. You’d optimize product pages, create content about sustainable materials, and earn quality backlinks. It’s slower, but once you rank, those clicks don’t cost a dime.
Different speeds, same goal: show up in search and get found first. Tools like Semrush help agencies track both metrics together. And AgencyAnalytics takes that a step further. Pulling data directly into client-ready Semrush report templates that showcase your results in a way your clients will actually understand.
Why Measuring SEM Metrics Is Non-Negotiable
Roughly 75% of clicks go to the top three search results, whether paid or organic. If you’re not measuring the right metrics, you’ll have a hard time finding the insights that get your clients into those top spots (and keep them there).
SEM metrics cut out the guesswork. They show what’s working and what’s lagging, so when a client asks, “Are we on track this month?” you can answer with the cold, hard facts: “Conversion rate’s up 12%, CPC dipped last week, and branded terms are outperforming non-brand by 30%.”
That’s the kind of proof clients remember.

Top SEM Metrics To Track in 2025
Every SEM report is packed with data, but only a handful of metrics drive decisions. Whether you’re managing one Google Ads account or juggling campaigns across platforms, these key SEM metrics should be at the top of your dashboard.
Click-Through Rate (CTR)
Click-Through Rate (CTR) is the percentage of people who click through on an ad. If you're racking up views but nobody’s clicking, something’s off. Maybe it’s the ad copy, the targeting, the timing, or a bit of everything.
So, what’s a good CTR to aim for? It depends on the ad and industry, but for search around 6.6% is average. Get closer to 10% and you’ve earned serious bragging rights—just make sure those clicks convert. If not, that landing page might need a pep talk.
Agency Tip: Not sure if your client’s CTR is pulling its weight? Compare it to industry benchmarks in AgencyAnalytics. On the low end? Try ad extensions like callouts, site links, and structured snippets. They give your ads more space and more reasons to click.
Quality Score (Google Ads Specific)
Google’s Quality Score is like a health check for how relevant and helpful your client’s ads and landing pages are. Scores are based on expected click-through rate, landing page experience, and ad relevance. A higher score means better ad placement and a lower cost per click. In other words, your client shows up higher on Google for less money—which is a major win.
So, how do you get there? Create ads that match your landing page and use target keywords your audience is actively searching for.
One last thing: Quality Score shifts with performance, so keep an eye on it, especially if your client’s rankings drop or costs start to creep.
Conversion Rate (CR)
Clicks are nice, but conversions pay the bills. Conversion rate (CR) is the percentage of viewers or visitors who take a desired action. The action depends on your client’s goal: sign-ups, purchases, bookings, you name it. If the conversion rate’s tanking, something’s broken. Maybe the landing page is clunky. Maybe the offer falls flat. Or the ad says one thing and delivers another.
Too many agencies brag about high CTRs but ignore whether that traffic actually converts. If your client’s SEM campaigns dump clicks onto a dead-end page, they’re not just wasting money—they’re burning trust.
Agency Tip: Need to pinpoint what’s killing conversions? AgencyAnalytics tracks CR across channels and segments, so you can move from “what happened” to “here’s how we’re fixing it”.
Cost Per Conversion (A.K.A. Cost Per Acquisition: CPA)
Cost per Conversion or acquisition (CPA) measures how much your clients pay to land a lead or close a sale. It’s the clearest link between spend and results, and a quick gut check on whether that budget’s pulling its weight. Simply divide the total number of new customers by your client’s total ad spend—that’s it.
A high CPA usually means targeting is too broad, bids are bloated, or the offer just doesn’t justify the price per lead. In short: it’s working, but not efficiently enough to grow without bleeding cash.
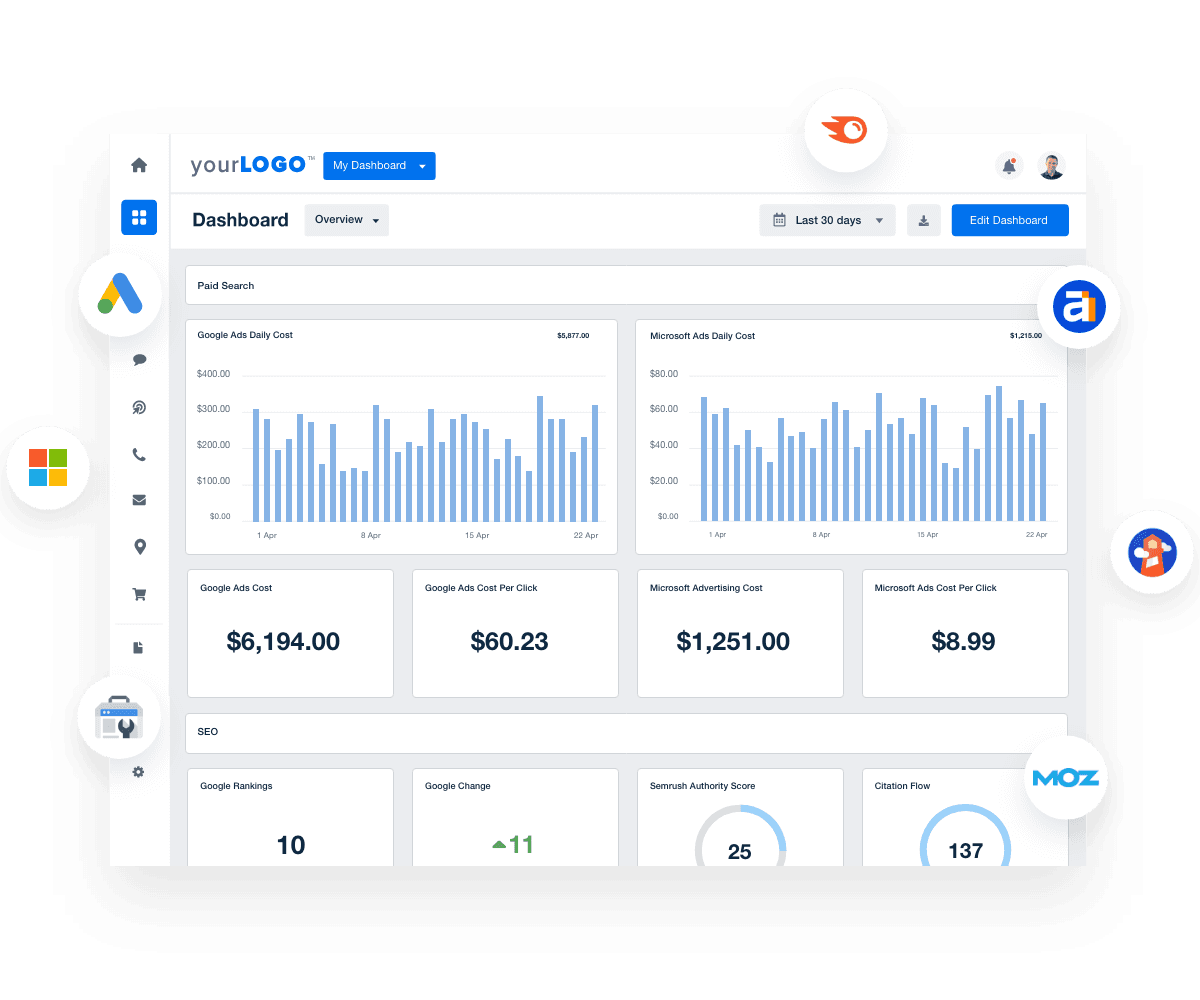
Agency Tip: Don’t just eyeball CPC alone. Stack it next to CTR, CVR, and Quality Score to see where the budget’s working (and where it’s going to waste). AgencyAnalytics’ automated SEM reports pull it all together in one dashboard, so you can prove ROI without the dashboard whiplash.
Cost Per Click (CPC)
Cost per Click (CPC) measures the amount paid for each click on a digital advertisement. It provides insight into how far your client’s budget stretches and how often you win bids in crowded auctions.
But don’t judge CPC by itself. A $10 click might sting until you see it converts at 30%. Suddenly, that “expensive” click is a steal compared to a cheap $2 click that never turns into anything.
On the flip side, if CPC keeps climbing while conversions flatline, it’s time to recalibrate. Maybe competition’s heating up, the Quality Score dipped, or seasonal demand is driving prices up. Revisit your target audience, tighten your messaging, or adjust bids before budget leaks turn into budget floods.
Impression Share
Impression share shows how often your client’s ads show up compared to how often they could. Think of it as a peek at how much digital shelf space your client owns versus how much they’re handing over to competitors.
Sometimes strong SEM campaigns get throttled by budget limits or low bids, cutting visibility even though performance is solid. Other times, impression share flags technical issues like disapproved ads or missed keyword matches you wouldn’t catch otherwise.
Agency Tip: Track impression share monthly to plug leaks before they get expensive. Low share but high results? That’s your cue to increase spending or reallocate budget from underperformers hogging the spotlight.
Return on Ad Spend (ROAS)
Return on Ad Spend (ROAS) measures the amount of revenue generated for every dollar spent on ads. It’s the metric that ties your agency’s hard work back to real business results.
Strong click-through rate? Awesome. Solid CPA? Even better. But if ROAS is weak, the strategy isn’t pulling its weight, no matter how good the other numbers look.
Agency Tip: What counts as “good” depends on the client. Some might be thrilled with 3:1. Others might need 6:1 just to stay in the black. Either way, context matters here. So, always track ROAS by campaign, channel, and margin to get the full picture.
Bonus Metrics
Once you’ve locked down the essentials, a few bonus metrics will take your search engine marketing strategy from good to great. These might not headline your SEM report, but they explain the weird stuff like a sudden spike in ad spend or an unexpected performance drop that nobody can quite figure out.
Bounce Rate
You ran the ad, they clicked…then immediately bailed. Bounce rate measures the percentage of visitors that visit a page and leave without any further action. Maybe the page loads like molasses. Maybe the headline misses the mark. Regardless of the reason, a high bounce rate is a sign you’re losing conversions before you even get a chance to make your pitch. Sometimes the reason behind high bounce rates isn’t obvious. But if you’re seeing a high bounce rate and a low conversion rate that usually means your landing page copy needs a tune-up.
Ad Relevance and Engagement Metrics
Not every metric gets a flashy headline. Sometimes you need the supporting cast: expected CTR, engagement rate (especially for Microsoft Ads), or scroll depth. These numbers dig into ad quality: how well the keywords match intent, how the message lands, and whether people stick around once they click.
Together, they explain the why behind a performance dip, so you know exactly what to fix.
Cost per Thousand Impressions (CPM)
Cost per Thousand (CPM) measures how much it costs to get an ad in front of 1,000 people. It shows up most often in display and awareness campaigns but matters for SEM too—especially if you’re chasing brand lift or top-of-funnel reach.
Agency Tip: Pair CPM alongside click-through rate (CTR) and other performance metrics to make sure those impressions actually lead to action.
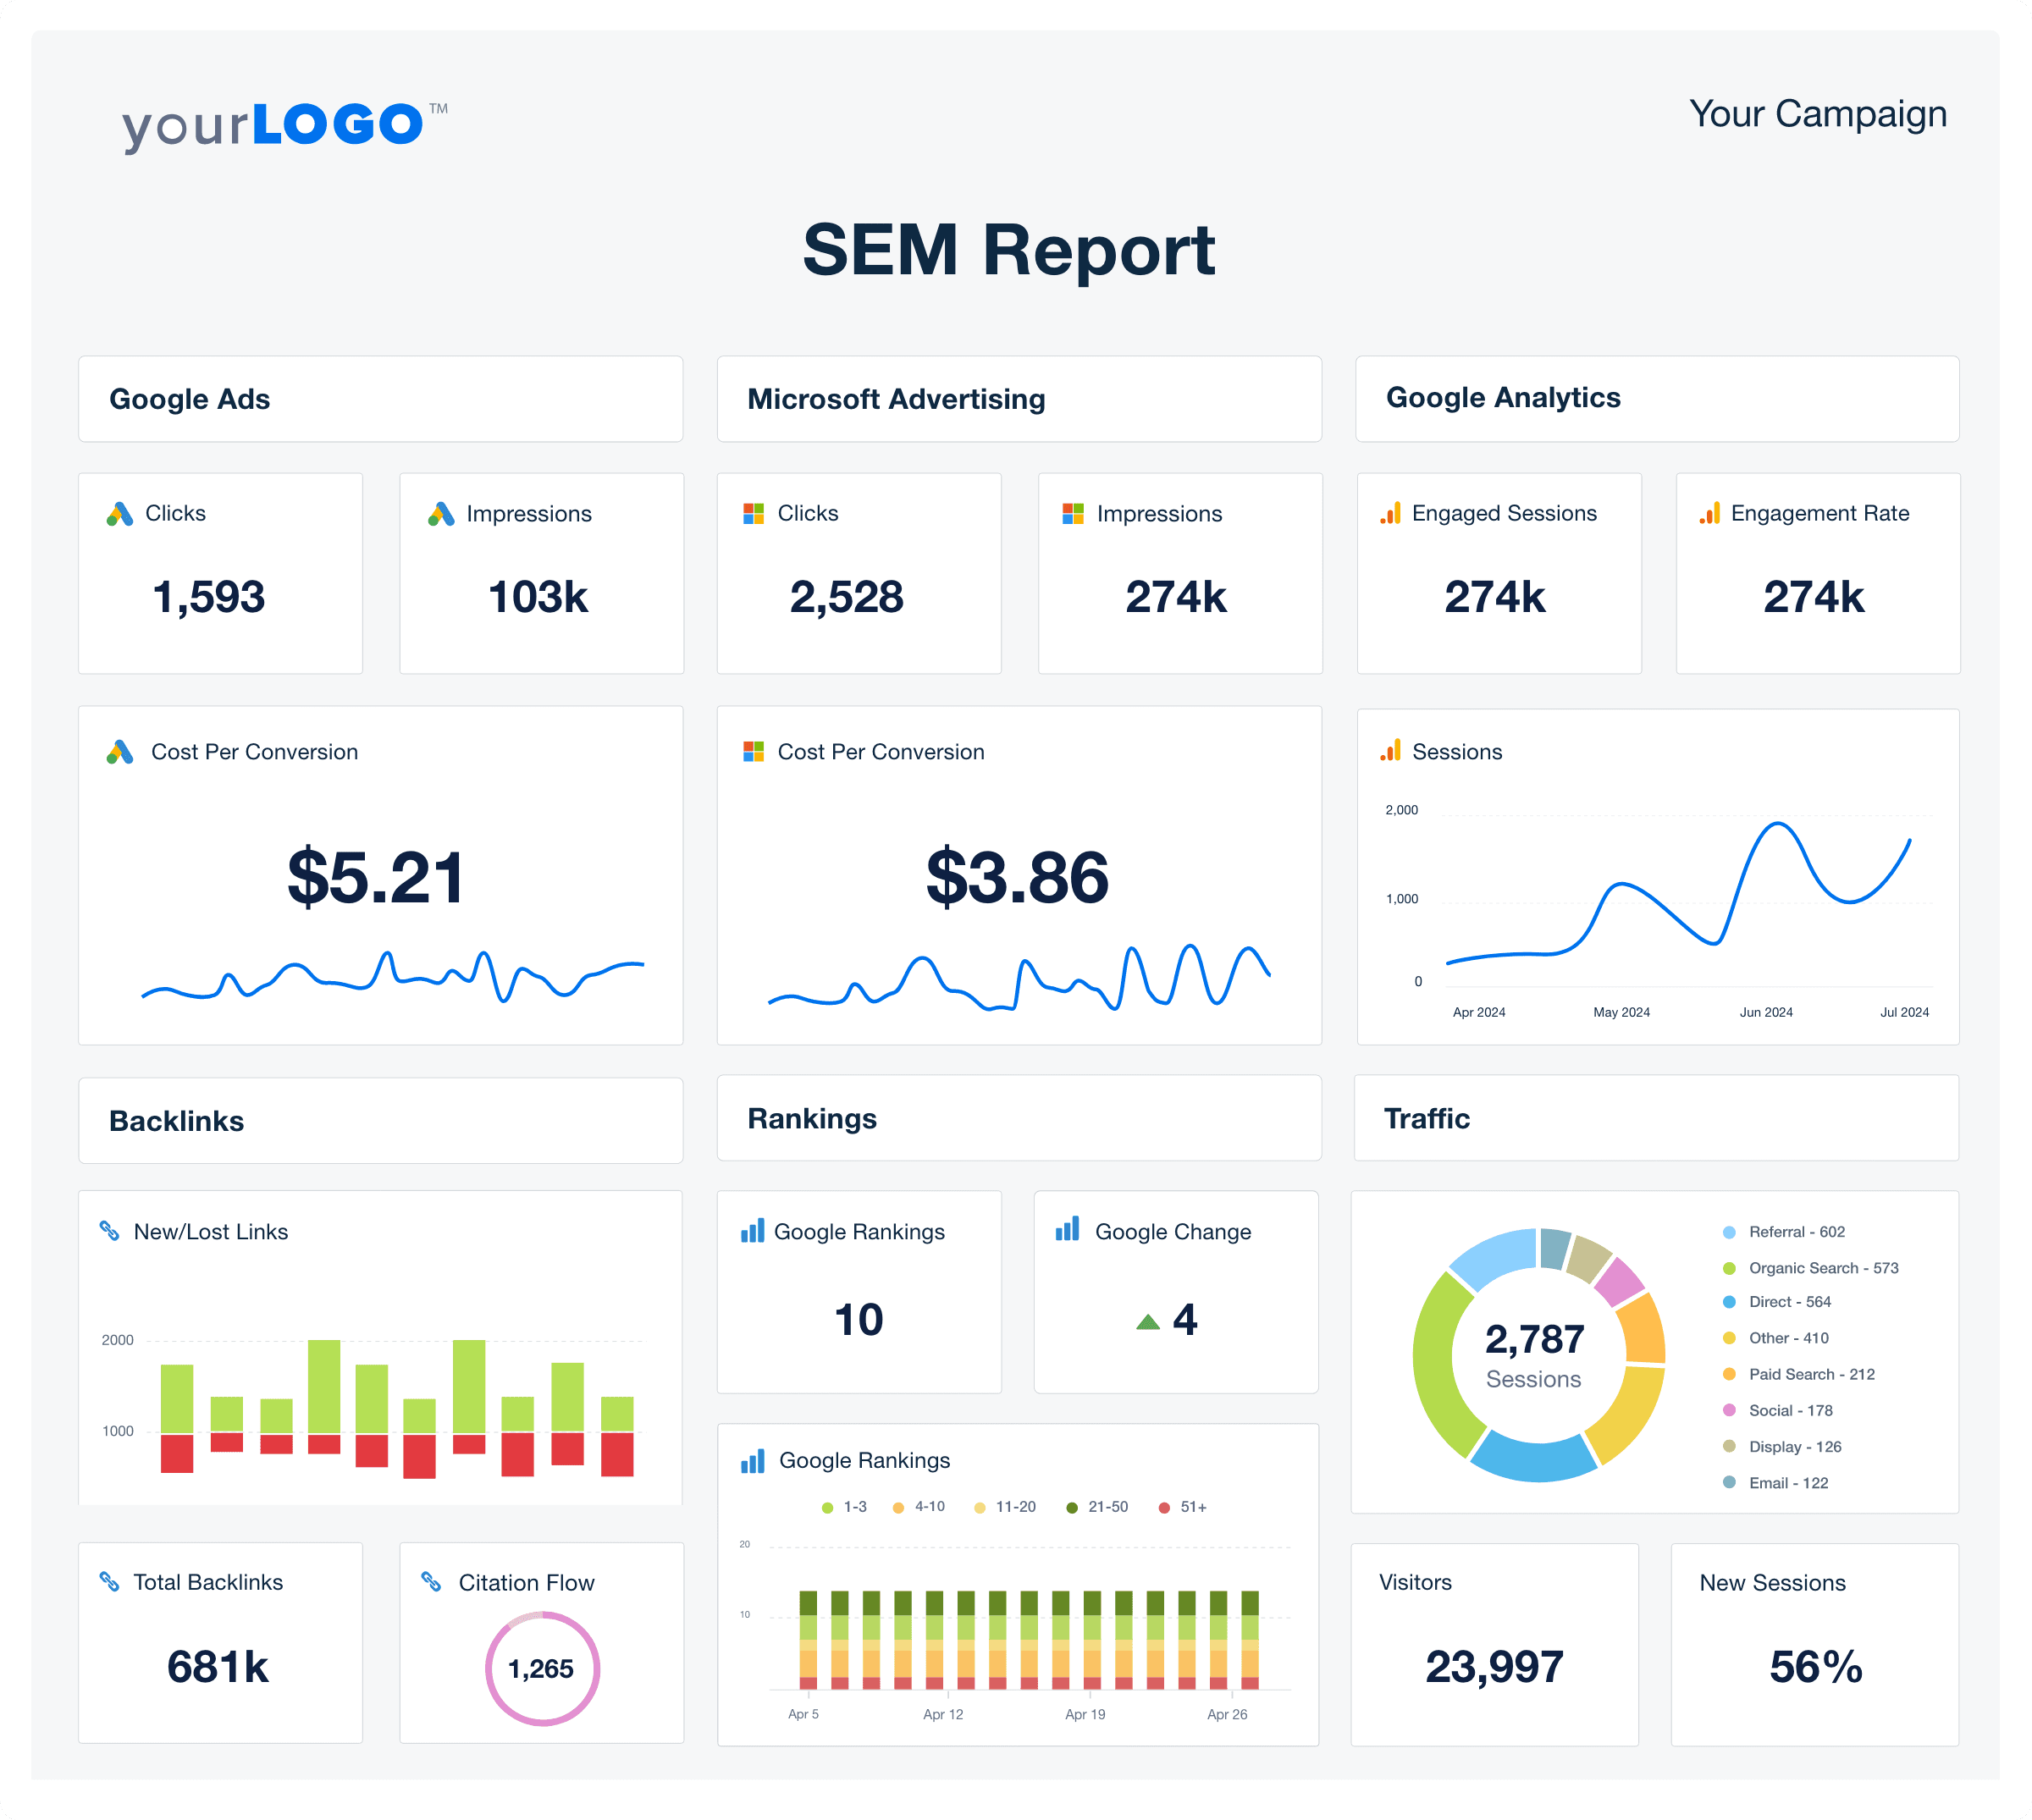
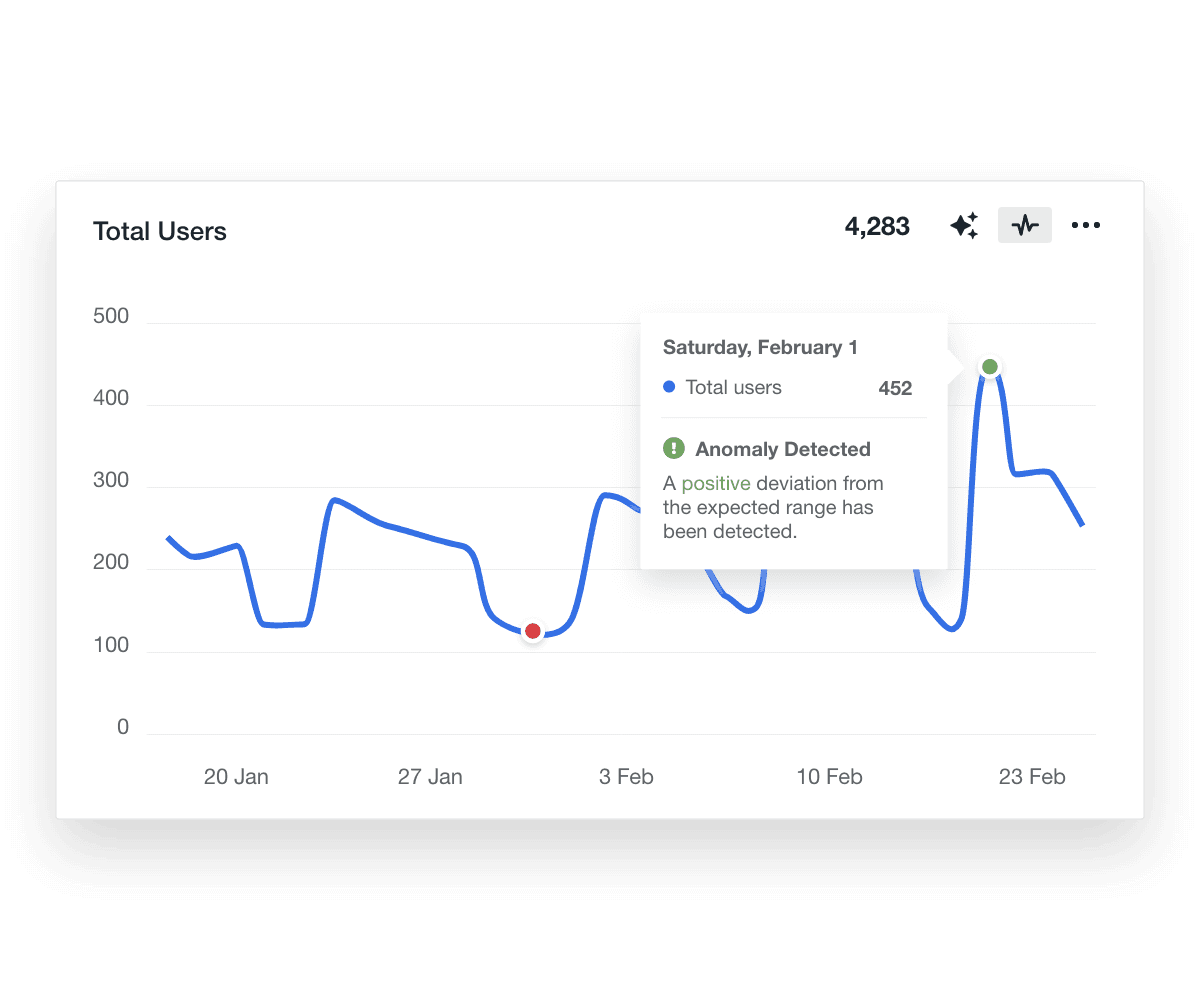
AgencyAnalytics’ SEM reporting platform pulls everything into live dashboards, automated reports, and easy-to-read visuals. And with built-in tools like anomaly detection, forecasting, and benchmarks, you always know where campaigns stand and where to go next. Try it free for 14 days!
How To Analyze SEM Performance
Juggling clicks, CPC, ROAS, and a dozen other numbers across different tools can make even seasoned marketers want to chuck their laptops. But search engine marketing analysis isn’t rocket science. It comes down to having your data in one place, comparing it to the right benchmarks, catching leaks early, and fixing them before they burn through your budget.
Here’s how busy marketing teams slice and dice SEM data to deliver results that keep clients sticking around for years.
Pull All Your SEM Metrics Into One Dashboard
Stop toggling between Google Ads, Bing Ads, Google Analytics, and half-finished spreadsheets. When everything’s side by side, you’ll spot issues at a glance. No more hidden budget drains. No more “Why is this so expensive?” moments when the invoice lands.
AgencyAnalytics’ live SEM dashboard pulls clicks, impressions, CPC, CPA, CVR, bounce rate, Quality Score, ROAS, and impression share into a single, always-updated view. So you spot trends faster, catch budget leaks sooner, and spend less time jumping between tabs.
Always Check Real Benchmarks
A metric in isolation is just a number. Context is where the truth lives. Compare your CTR, CPA, ROAS, and CPC against trusted industry benchmarks. You’ll see in seconds whether you’re ahead of the game or need to adjust.
For example, say your CTR hovers at 5%. That might seem fine until you see your client’s niche benchmark sits at 7% or higher. That context turns a “fine” CTR into a flashing warning sign that it’s time to tweak, test, and get back to work.
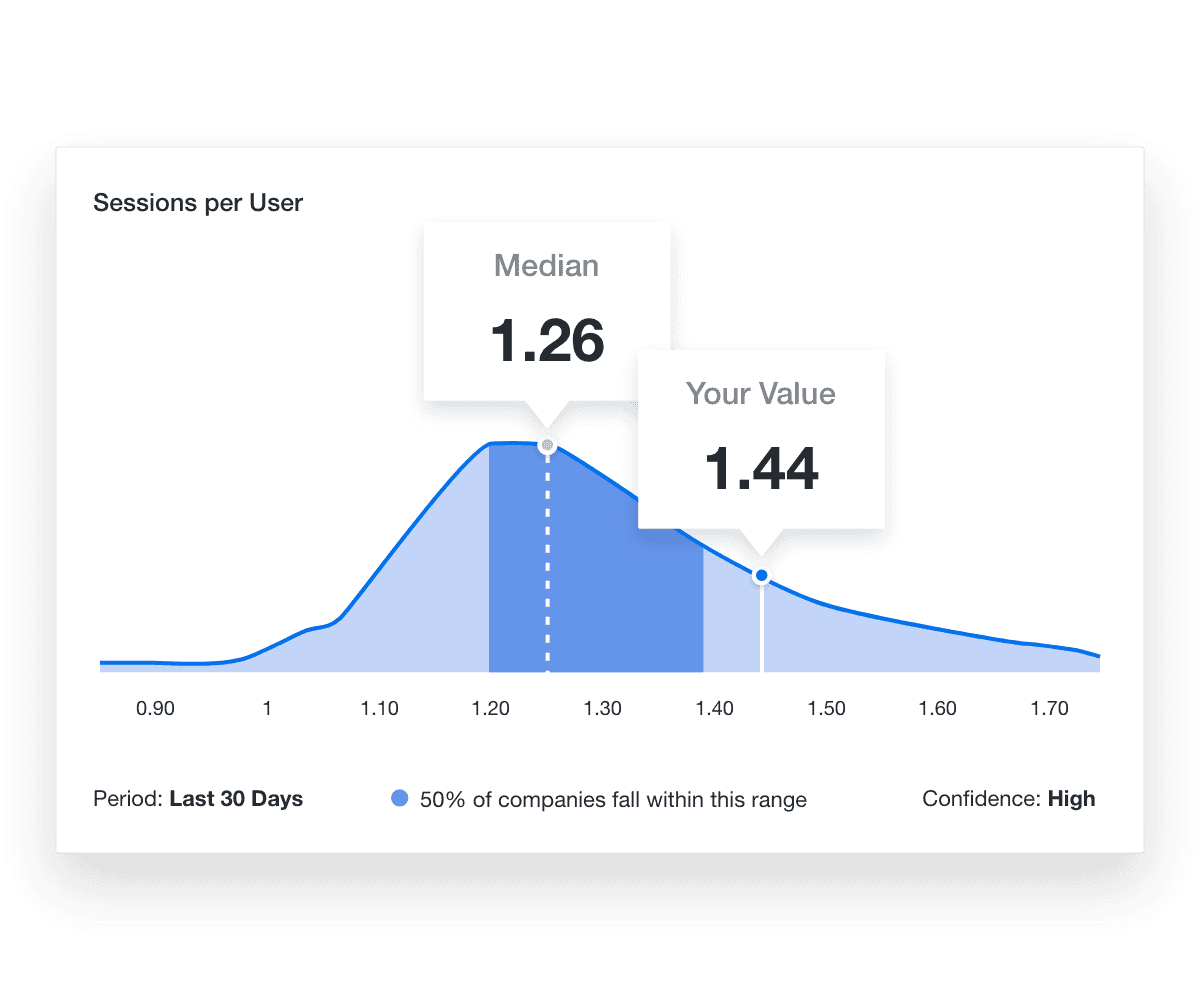
Compare your client’s SEM performance to others in their industry, based on insights from 150,000 campaigns pulled by real agencies like yours. Try it inside AgencyAnalytics–free for 14 days!
Spot Where Metrics Clash
Patterns hide in the mismatches. This is where you find wasted spend and untapped profit. Keep an eye out for these classics:
High CTR, Low Conversions: The ad grabs attention but the landing page disappoints. Tweak your headline, test your offer, or improve page speed.
Rising CPC but Flat ROAS: Costs creep up while returns stagnate. Tighten your target audience, refine bids, or check for new competition bidding you up.
Low Impression Share, Strong CVR: The ads you do run convert well, but they’re barely seen. Time to increase or reallocate the budget, so your client’s ads get noticed.
Watch Trends Over Time, Not Just Spikes
Any campaign can have an odd day. But what matters is the trend line. Use historical data and forecasting tools to see if costs are drifting higher, conversions are slipping, or Quality Scores are dropping.
For example, if CPC crawls up 10% each month while conversion rates hold steady, your CPA quietly balloons. Spot that early, fix your bids, and keep your clients happy.
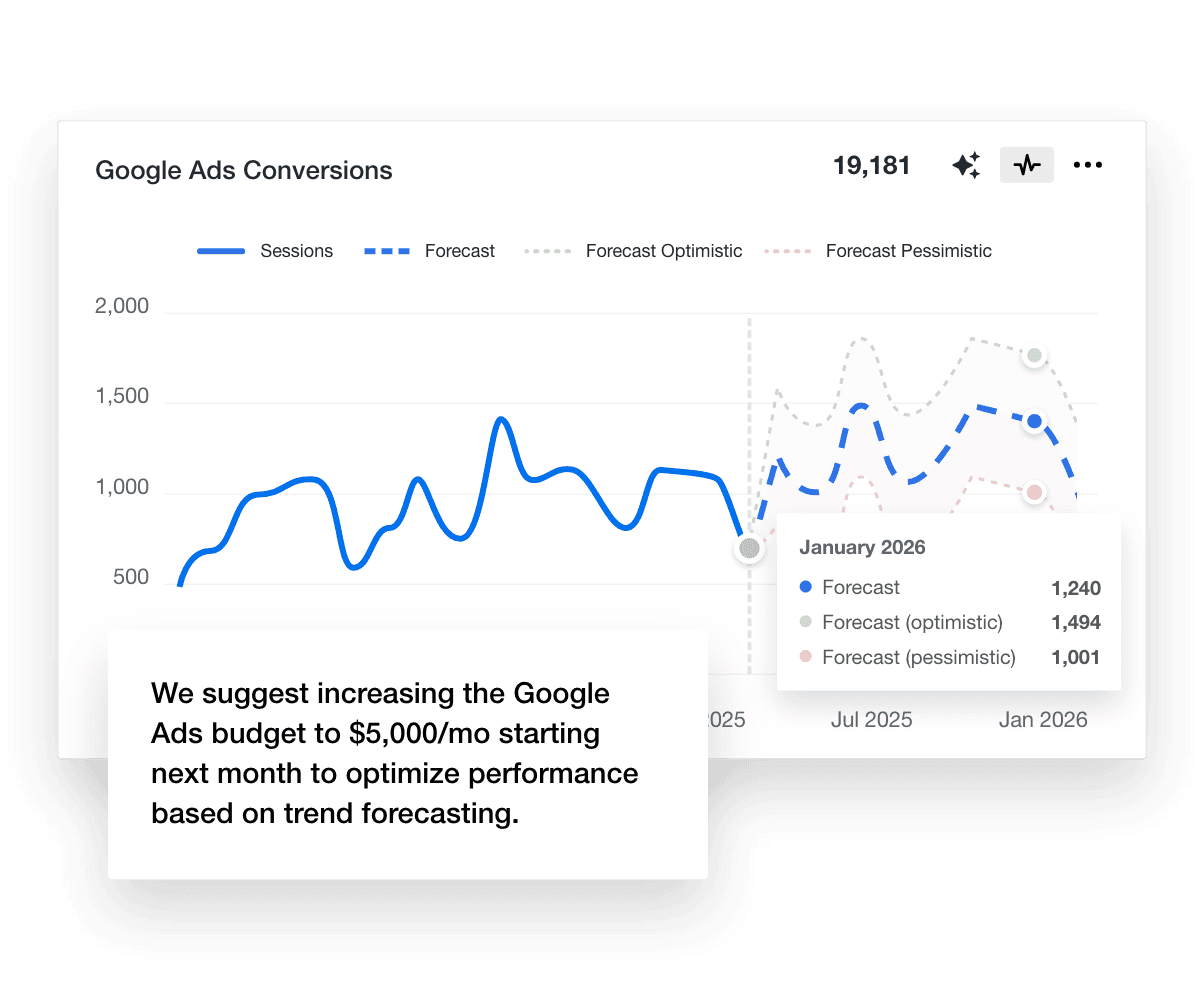
Use the forecasting feature from AgencyAnalytics to predict performance, based on current and historical trends. Back up your strategy with a look at the future–try it free for 14 days!
Let AI Do the Heavy Lifting
Digging for insights shouldn’t devour your whole day. Ask AI is your on-demand SEM analyst inside AgencyAnalytics. It scans every click, cost, and keyword and turns raw data into clear answers you can actually use.
Need to know why CPC spiked overnight? Just ask, “What caused the CPC to jump last week?”
Wonder which keywords are bleeding budget with weak returns? Ask, “Which campaigns waste the most money with low ROAS?”
Want to find your best bet for scaling up profitably? Ask, “Where should I increase the budget for better ROI?”
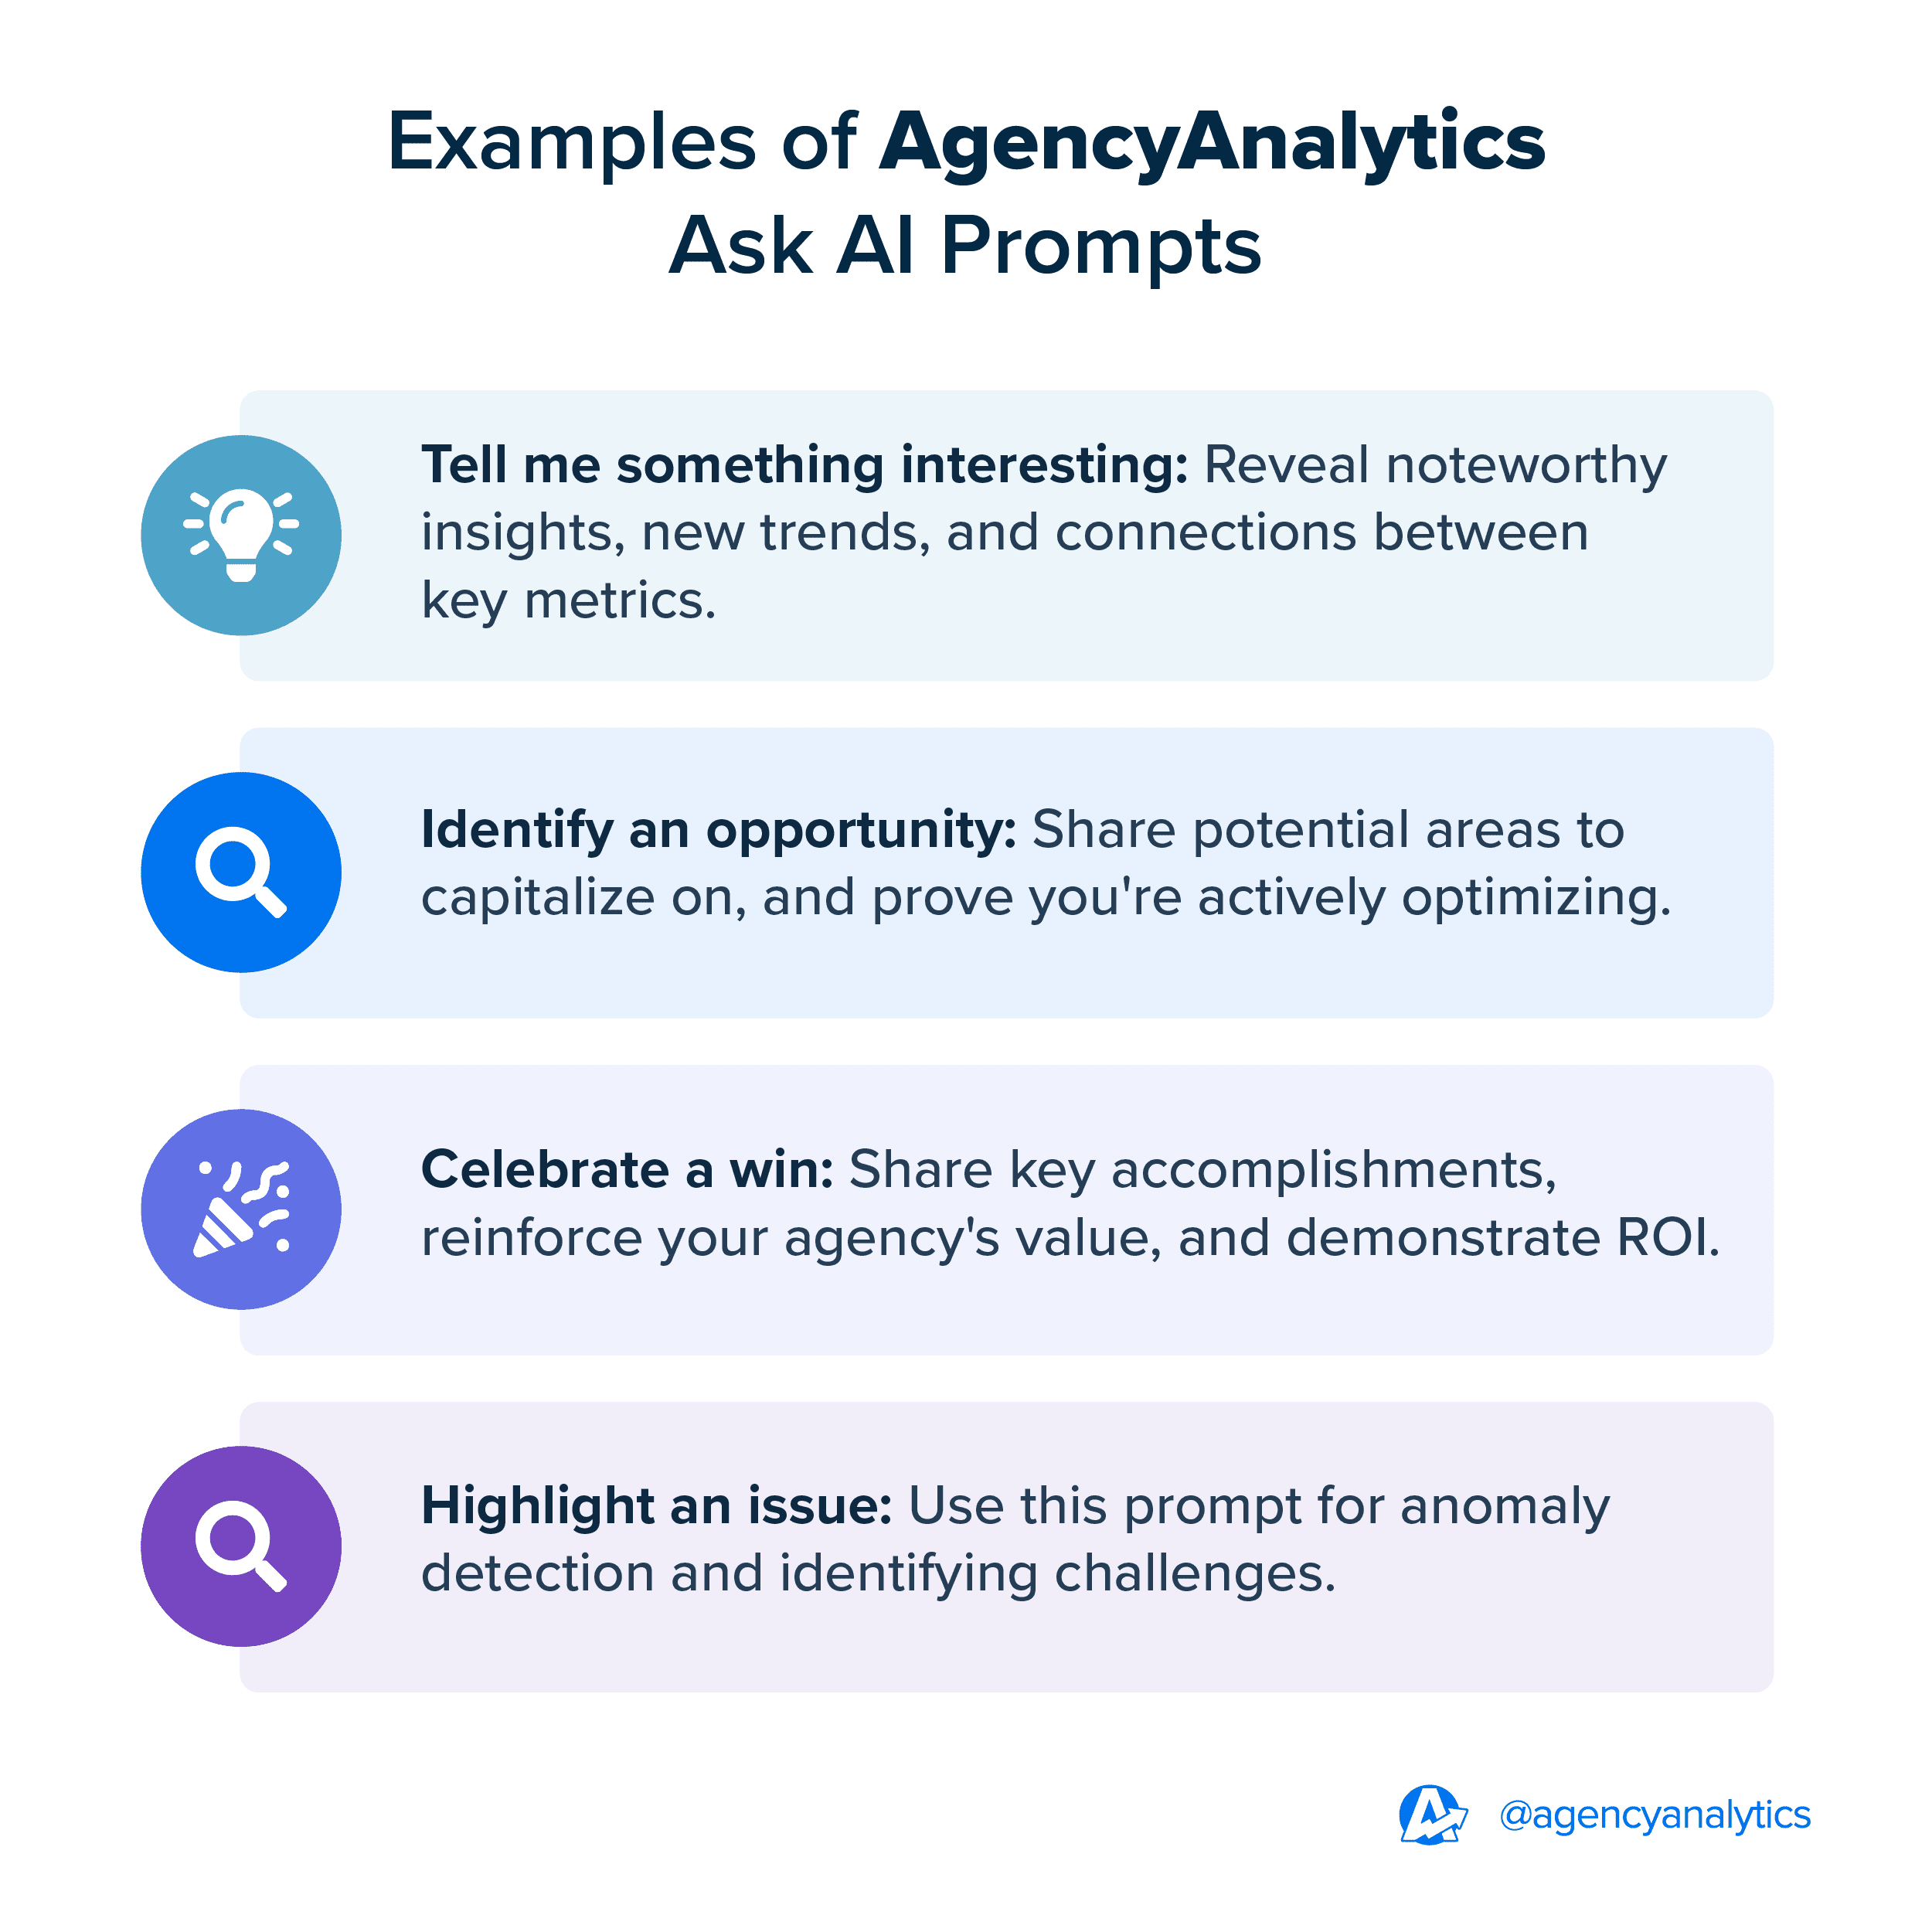
Ask AI does in seconds what used to take an analyst hours. No filters, no pivot tables, no second-guessing. Sign up for a free 14-day trial today and see everything AgencyAnalytics has to offer.
Turn Insights Into Action
A sharp report is only half the job, real results come from putting it to work. Once you see what’s working (and what’s not), act on it:
Update Ads: Think fresh headlines, sharper CTAs, and new extensions.
Refine Target Audience: Ditch the window shoppers who never convert.
Improve Landing Pages: Match the ad promise, load fast, and keep it clear.
Shift Budget: Move money from underperformers to your high-ROI heroes.
Set Up Guardrails
Even the best SEM managers can’t watch metrics 24/7, but you can set up alerts that keep you ahead of the game.
Set metric alerts so you’re the first to know when CPC jumps or impression share dips.
Let anomaly detection flag sudden traffic spikes or cost surges before they wipe out ROI.
Use forecasting tools to prepare for seasonal shifts and budget accordingly, without surprises.
Put It All Together
Metrics don’t tell the whole story on their own, but an SEM reporting template does. It ties all those numbers together, shows what’s working, and lays out what’s next. Clients see the wins, the tweaks, and exactly where you’re steering their budget.
Bring Clarity to the Chaos
SEM performance shouldn’t feel like a wild goose chase through tabs and tangled spreadsheets. When your data’s clear, your next move is obvious—and your budget stays on track.
AgencyAnalytics keeps reporting simple. You get one dashboard, clear insights, and client-ready SEM reports that show exactly why working with your agency is paying off. Spend less time explaining stats and more time launching campaigns that actually drive clicks and conversions. Try it for free today and join 7,000 agencies reporting smarter.

Written by
Kali Armstrong is a freelance content writer with nearly a decade of experience crafting engaging, results-driven copy. From SEO blogs to punchy short-form pieces, she combines strategic insight with authentic messaging to captivate audiences and drive results.
Read more posts by Kali ArmstrongSee how 7,000+ marketing agencies help clients win
Free 14-day trial. No credit card required.


