Gross Revenue Retention (GRR)
Retention Analysis
Use GRR to gauge the effectiveness of customer retention strategies.
Financial Forecasting
Create accurate revenue predictions and financial plans.
Client Reporting
Highlight in client reports to showcase customer loyalty and stable revenue.
Product Insights
Analyze GRR to understand product value and customer satisfaction.
Why Gross Revenue Retention Is Important
Gross Revenue Retention helps evaluate a company's financial health and stability. A strong GRR indicates a company's ability to maintain its existing customer base, a testament to the product-market fit and the effectiveness of customer success initiatives. A significantly declining GRR suggests potential issues that require immediate attention.
This metric becomes even more significant in businesses with a subscription-based model where monthly recurring revenue is a key financial driver. Because GRR excludes expansion revenue, it focuses solely on the retention of existing revenue streams. High GRR rates reflect customer loyalty and predict stable future revenue streams.

Stop Wasting Time on Reports. Get Marketing Insights Faster & Drive Results.
How Gross Revenue Retention Relates To Other KPIs
While GRR focuses on the revenue retained from existing customers without considering upsells or cross-sells, it is closely linked to Net Revenue Retention (NRR) and Net Dollar Retention (NDR). Both NRR and NDR extend beyond GRR by including expansion revenue–capturing a more complete picture of revenue dynamics, including upsells, cross-sells, and downgrades.
However, GRR's emphasis on existing customer revenue makes it an essential metric for assessing the efficiency of customer retention strategies. These insights are invaluable for a company’s financial well-being and assist with forecasting and resource allocation. Revenue retention metrics also clarify the focus on customer satisfaction and product improvements, as GRR is sensitive to customer churn and dissatisfaction.

Key Factors That Impact Gross Revenue Retention
Several factors critically influence Gross Revenue Retention, primarily those focusing on the ability to retain customers. For example, satisfied customers are more likely to continue using a product or service, positively impacting gross retention rates. This satisfaction often hinges on the perceived value of the product or service, underscoring the importance of aligning offerings with customer expectations and needs.
Another significant factor is the company's approach to addressing churned customers. Effective strategies to re-engage or understand why customers leave provides valuable insights into improving GRR. This includes analyzing customer feedback to identify common pain points or areas for improvement.

How To Calculate Gross Revenue Retention
Gross Revenue Retention is calculated by dividing the revenue retained from existing customers over a specific period by the total revenue at the start of that period. Although similar to the Net Revenue Retention Formula, it only considers the revenue lost during the period and does not consider the upsell or expansion revenue from existing clients.
Gross Revenue Retention Formula Example
What Is a Good Gross Revenue Retention Rate?
A GRR above 90% is often considered healthy, especially for subscription-based and SaaS companies. This number reflects a loyal customer base and effective retention strategies.
What Is a Bad Gross Revenue Retention Rate?
A GRR significantly lower than industry benchmarks may be a red flag, prompting a deeper analysis of customer feedback, market positioning, and competitive dynamics.
Digging Deeper Into Gross Revenue Retention Benchmarks and Goals
To extract deeper insights into GRR and what it means to a business, segmentation is key. Breaking down GRR by customer demographics, product lines, or geographic regions unveils underlying trends and problem areas. This granular approach facilitates targeted strategies to enhance retention in specific customer segments, ultimately boosting overall Gross Retention Revenue.

Why Gross Revenue Retention Matters to Clients
At its core, GRR reflects the resonance of a company's value proposition with its existing customers. High Gross Revenue Retention rates are testaments to a business's ability to evolve with its customer's changing needs. This evolution is pivotal in industries characterized by rapid technological advancements and shifting consumer preferences.
Beyond the surface-level understanding of customer retention, it provides a lens through which clients view the efficacy of their engagement strategies. A stable or increasing GRR is a signal that customer engagement and nurturing programs are paying off, leading to a loyal customer base.

Why Gross Revenue Retention Matters to Agencies
From an agency perspective, GRR offers insights into client loyalty and the success of current engagement strategies. It also helps agencies understand the long-term value they provide to their clients, guiding strategic decisions and resource allocation.
A high GRR provides agencies with a stronger case for supporting higher budgets, particularly in competitive industries. It demonstrates the agency's ability to not only attract but retain customers, and provides a clear picture of Customer Lifetime Value vs. Customer Acquisition Costs, and the long-term ROI driven by agency campaigns.

Win Back Billable Hours by Automating Your Client Reporting
Best Practices When Analyzing and Reporting on Gross Revenue Retention
Comprehensive analysis of GRR sheds light on customer retention trends, helping to craft more effective and efficient marketing strategies.
Ensure Data Accuracy
Inaccurate data leads to misguided strategies and poor decision-making. Regular audits and cross-checks of revenue figures are essential to maintain data integrity.
Trend Analysis
Analyzing GRR over time reveals trends and patterns. This longitudinal analysis helps in understanding the effectiveness of retention strategies and their impact on revenue.
Compare Across Channels and Campaigns
Comparing GRR across different channels and campaigns gives insights into which marketing programs are the most effective at attracting and retaining customers.
Contextual Analysis
Consider factors like market conditions and competitive dynamics when putting GRR in the context of overall business performance and industry benchmarks.
Align to Client Goals
Include actionable recommendations based on GRR analysis, the insights gained, and how they will drive relevant, tangible improvements to client outcomes.
Visualize Performance
Visualizing GRR performance through graphs and charts makes the data accessible and comprehensible, which is useful when communicating complex findings to stakeholders.
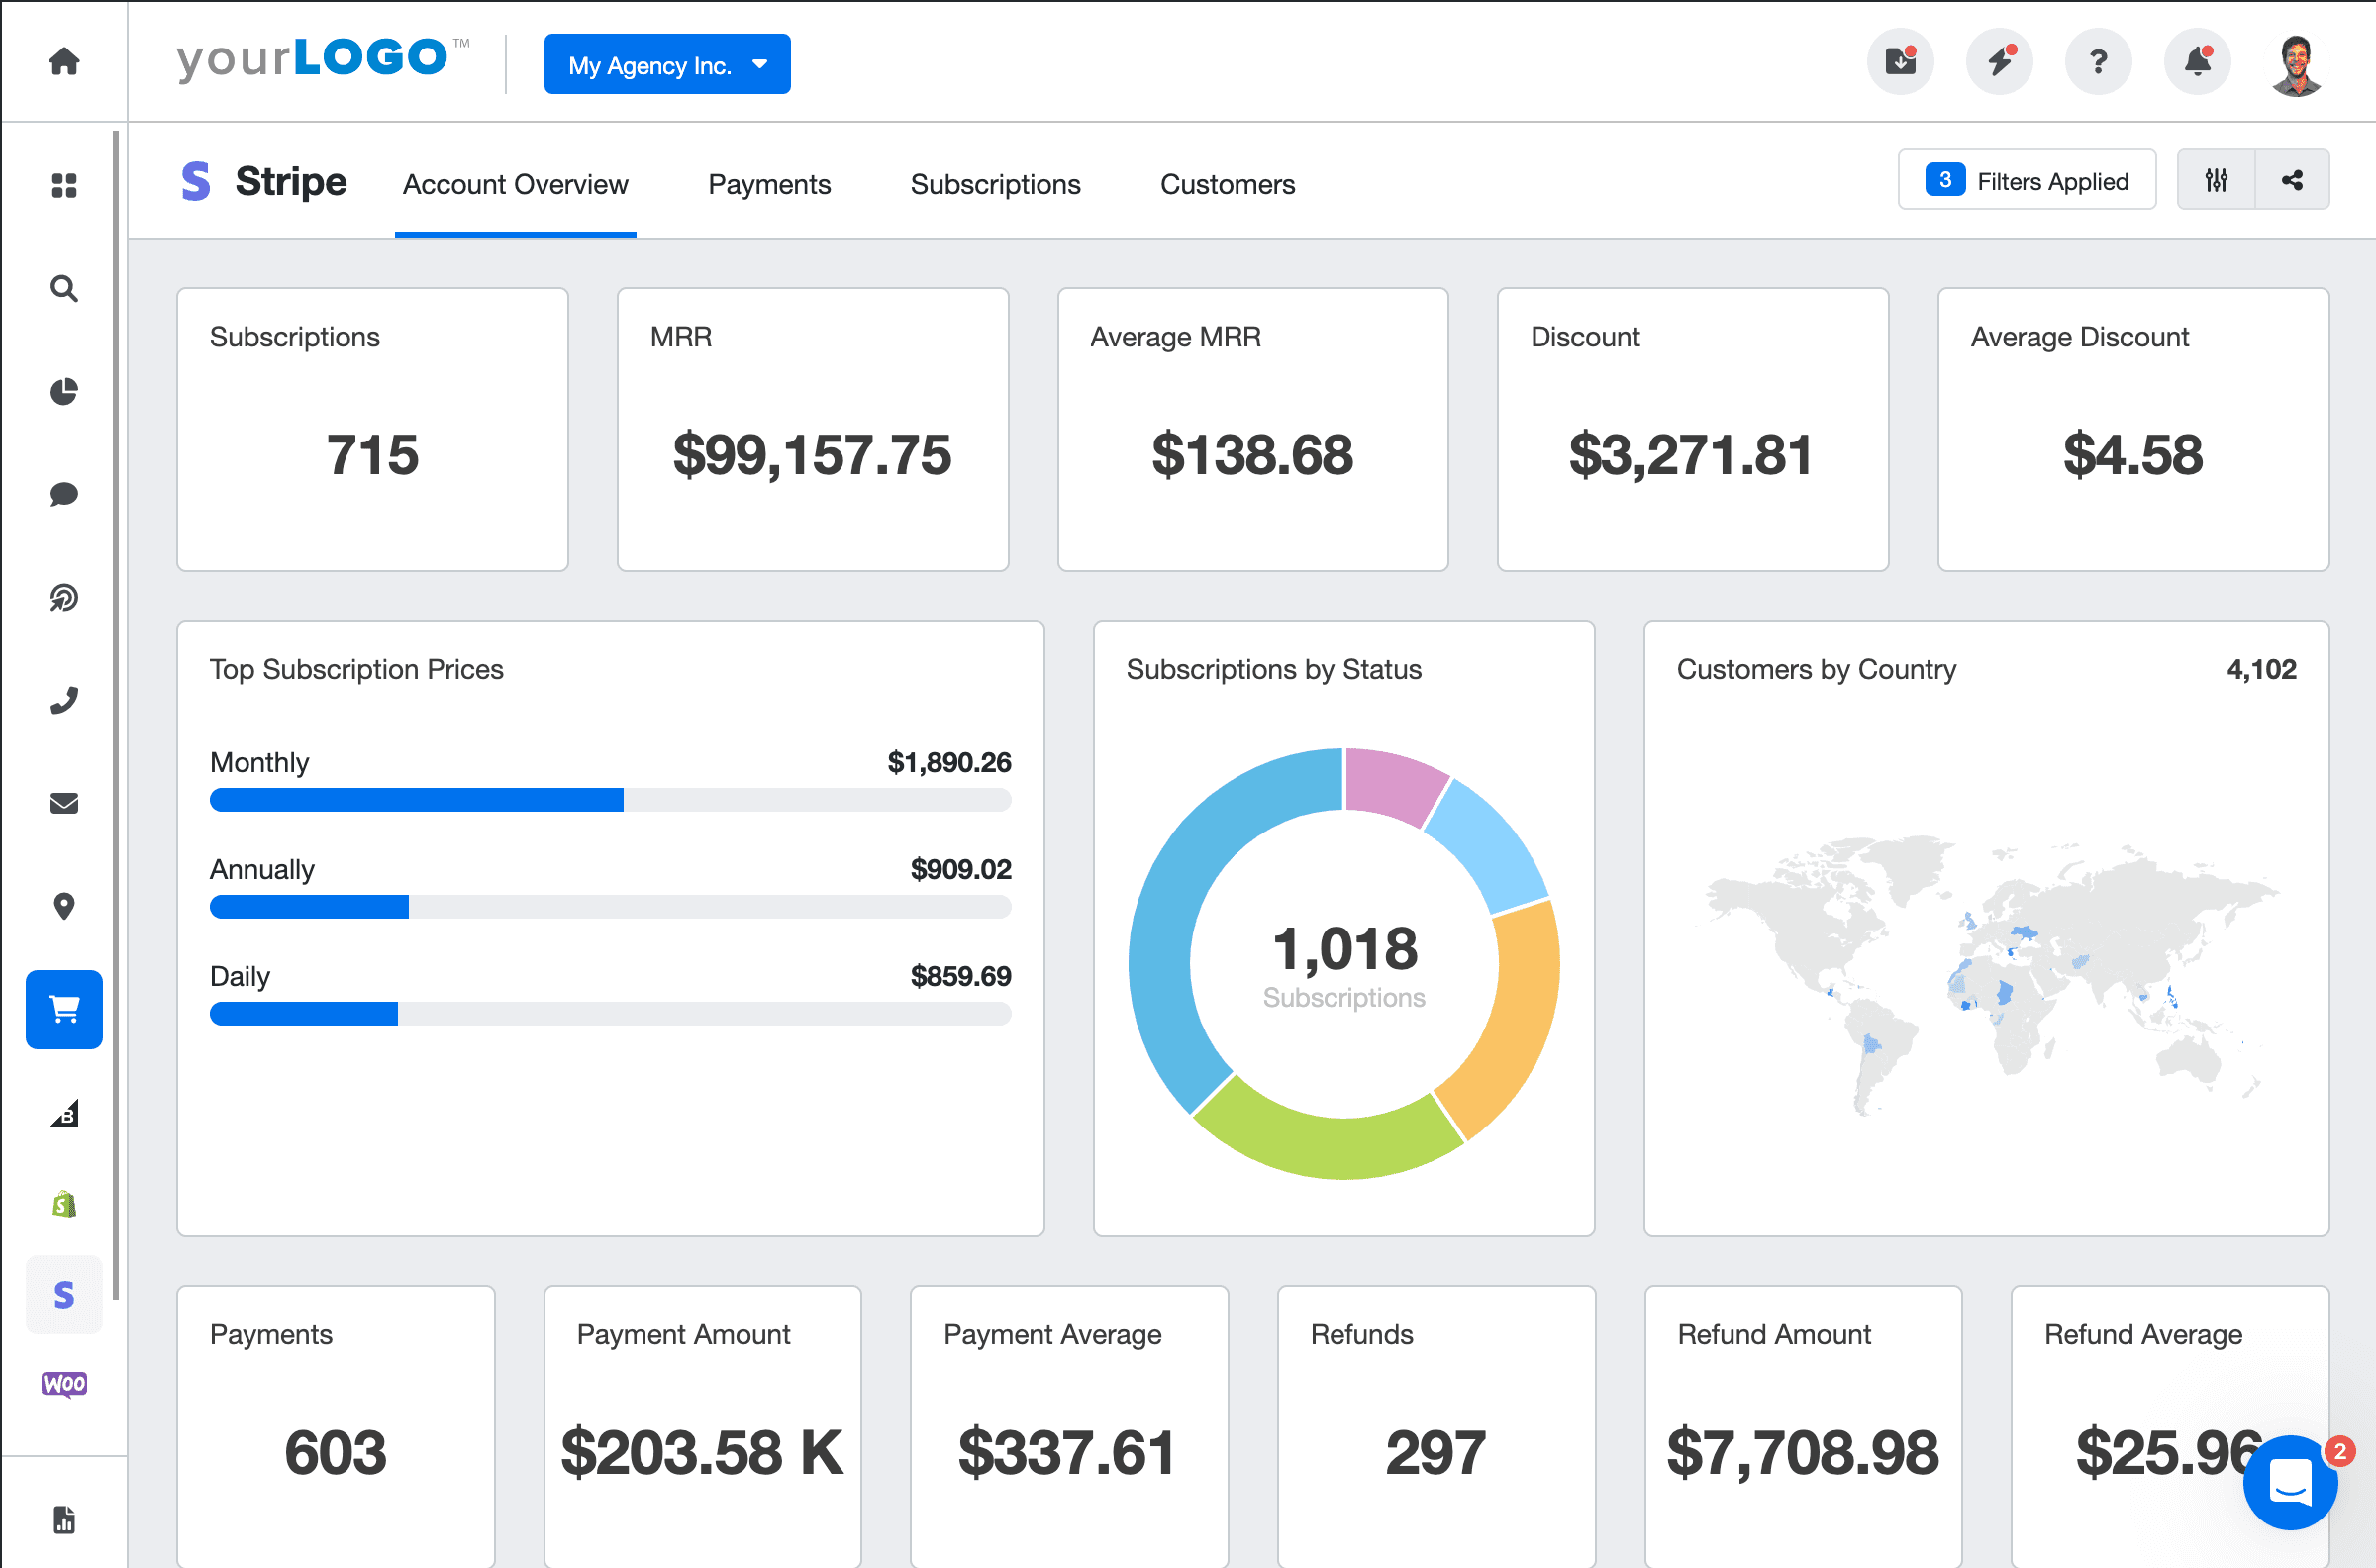
Stripe Dashboard Example

Related Integrations
How To Improve Gross Revenue Retention
Understanding and applying strategies to enhance GRR significantly impacts the overall financial health of a business. This involves maintaining current revenue levels and strategically planning for growth.
Focus on Customer Satisfaction
High customer satisfaction is directly linked to better GRR (and an improved Net Revenue Retention Rate). To ensure that customers derive continuous value from the product or service, regularly solicit and act on customer feedback to enhance customer satisfaction and loyalty.
Tailored Customer Experiences
Customizing experiences to meet the specific needs and preferences of different customer segments significantly improves gross and net retention. Personalization strategies demonstrate an understanding and appreciation of customer needs, fostering stickiness.
Data-Driven Decision Making
Using data analytics to understand customer behavior and preferences aids in making informed decisions. Calculate Net Revenue Retention and Gross Revenue Retention independently to analyze trends in customer engagement, and improve product offerings and customer experiences.
Related Blog Posts
See how 7,000+ marketing agencies help clients win
Free 14-day trial. No credit card required.


