Table of Contents
QUICK SUMMARY:
CRM reports deliver key insights into customer interactions, supporting business strategic decisions. They present a detailed performance analysis for defined periods and pinpoint growth opportunities. This article covers the most important aspects of successful customer relationship management reports with strategies to optimize operations and client relationships through detailed data analysis.
Customer relationship management (CRM) software is jam-packed with data. They offer a wealth of information to help your clients run a smoother business–while giving your agency granular insights to run better campaigns.
However, CRM reporting software is clunky and hard to parse information. And when you’re scaling your agency, you don’t have time to manually extract data each time for different types of essential CRM reports.
This article shows you six types of business insights to extract from CRM reporting to provide valuable intel your clients will keep coming back to your for. You’ll also learn how to set the entire process on autopilot with scheduled reports.
What Makes a Great CRM Report?
CRM reporting software isn’t just for warehousing information about your clients’ leads and sales activities. It’s what your agency does with that information to show the value you bring to the table–enter CRM reporting.
CRM reports act as a performance summary during a specific time period. It should highlight opportunities for your agency to offer expertise while helping your clients’ businesses grow.
So what makes a great CRM report?
First, it should clearly provide actionable data for each stakeholder. This means CRM reporting should help with specific project management aspects. For example, different types of CRM reports break down insights for your marketing team to make better campaign optimizations based on data–and to allow your client's sales team or sales reps to run a smoother business and never miss out on an opportunity.
Second, CRM reporting should be easy to understand. Clients don’t have time to decipher what their marketing data means. By presenting it in an intuitive report, you and your clients keep track of notable trends.
For example, by showing them metrics like website traffic, clicks on particular paid ads, or social media posts with high engagement rates, their sales team connects the dots of the customer journey and makes informed decisions to fill their sales pipeline with qualified leads.
Third, CRM reporting should complement your marketing campaign data to build better sales funnels, improve lead capture, calculate KPIs, and identify the channels that provide the best ROI. Your clients want a healthy sales funnel and the opportunity to build an informed sales forecast report. Your agency has the power to help them make data-driven decisions and achieve business growth with great CRM reporting.
At the end of the day, your clients' sales teams need to understand their customers more to fill their sales pipeline. With the help of your agency's CRM reporting, they're empowered to take those insights and turn them into action.
There are six common types of CRM reports that all serve different purposes.
6 Essential CRM Reports for Your Clients
1. Showcase Profitability for Business Insights
Profitability CRM reports show where your client's money is coming from.
There are tons of valuable insights to take advantage of just by paying close attention to the customer database in their CRM software. Look for things like purchase history and customer buying habits and include them in your clients' CRM reporting. Both of these key metrics help sales reps determine which customers are their biggest contribution to revenue, the most loyal, and have the highest potential to buy again in the future (driving customer lifetime value).
Profitability CRM reports often include:
Total revenue
Total leads
Won deals
Total expenses
ROI (return on investment)
The profitability report can be one of the more popular CRM report types with your clients and their sales reps-and for a good reason. It demonstrates campaign costs, how many leads and opportunities were generated, and how these were reflected in monetary terms.
2. Demonstrate How Different Channels Contribute to Revenue for Budgeting Decisions
Do you know how long it takes for your client’s leads to convert? There are many variables like what industry they’re in, what products and services they offer, etc. Sometimes it takes longer than expected, so it’s important to understand how different channels contribute to revenue and how long they take to do so. You also want to know exactly how many leads each channel brings in to build actionable revenue forecasts in. This helps make proactive decision-making that could directly impact your clients' bottom line.
To prepare a campaign leads by channel report, you need to assign a “source” label to every contact in your client’s CRM software. For example, if your client sells products online, label lead flows using Google Analytics sources:
Organic Search
Direct
Referral
Email
Paid Search
Social
Etc.
To keep track of these in your CRM reporting, be sure to use UTM parameters every time you launch a new campaign. Although Google will often align traffic based on the original source, it's not as accurate as putting that source in the UTM tracking code.
Agency Tip: Goal setting helps monitor targets like MQLs by source, location, or a combination of both. Create custom lead goals to extract Google Analytics goal data by segments and channels to track progress against those specific deliverables.
3. Pinpoint Opportunities for Follow-up
Create an opportunities generated report to keep track of opportunities generated for your client's sales team as well. Think about their potential customers who have maybe asked for a product demo or contacted their sales rep asking about prices. These are important for their sales teams to know as it directly affects their sales process. After all, these potential customers could be new opportunities they should be approaching!
Create opportunity forms in your CRM reporting about your clients' qualified leads and categorize them by:
Expiration or closing date of an opportunity
Estimated revenue
Status
Topic
Contact
Once you categorize the opportunities generated, it’s easier to see who’s managing which lead (salesperson, an entire sales team, etc.) and then funnel the results back to their pre-determined KPI in their CRM reports.
4. Identify Lead Sources To Calculate ROAS
This is similar to tracking campaign leads by channel, but instead of looking at each channel, you want to analyze and compare specific lead sources.
For example, if your client has different lead magnets on their website, all of these can be included in one lead source analysis report. On the other hand, if a client has a variety of referrals coming in, you may choose to include and analyze them separately.
To prepare your lead source analysis report, you want to include standard UTM values and clearly labeled marketing campaigns: “Facebook,” “Google,” etc. Every time a new lead comes in, information about the source is recorded in the CRM.
Lead source analysis reports are extremely useful for calculating ROAS and CPA. Acquisition channels vary in price, so when you prepare a budget for a specific campaign, you need to predict how many “target actions” it will bring in and what revenue the client will receive.
5. Segment Revenue by Campaign To Invest in the Best ROI-Generating Channel
If you launch multi-channel campaigns for your client, you know there are a lot of variables: different ad creatives, segments, allocated budgets, etc.
So, to compare the effectiveness of your efforts, it's beneficial to look at revenue per campaign versus the number of qualified leads per campaign. You need to consider how many conversions are happening and leading to how much revenue (real-world results) is being generated.
This report offers insights into whether or not it’s worth it to invest in a social media influencer or direct their budget toward search ads.
To set up a revenue generated by campaigns report, be sure to group closed deals according to their sources. Then, compare results visually in a bar chart, for example.
6. Use Call Tracking To Discover High Intent Leads and Improve Customer Service
Everyone knows the importance of customer satisfaction. Simply put, happy customers are more likely to return and do business with your clients again versus upset customers.
So, monitoring things like client calls opens new opportunities in areas where your clients should improve customer satisfaction with a focus on their sales or customer service processes.
By preparing call tracking reports with data from their customer relationship management tool, you measure metrics such as:
Talk time (the average time an employee spends on calls with customers)
Talk quantity (the number of calls every salesperson makes)
Call results (the number of unanswered calls or conversations that lead toward a specific sales funnel)
Assess the information in the call tracking tool to help clients turn call leads into customers, get insights into individual sales performance reports, or compare them with market benchmarks.
7 Strategies To Manage Your Custom CRM Reports
Your clients don’t have time to flip through giant, segmented CRM reports–nor does your agency have the time to make them. Combine your CRM reporting for your clients with multiple marketing platforms they’re on in one simplified report.
Here are seven strategies to manage your essential CRM reports.
1. Connect All Your Client’s Metrics in One Place
With over 80 integrations, it’s quick and easy to connect all of your client’s key metrics in one place, including their CRM software. There’s no need to create a separate CRM report just for their specific CRM data and another for their campaign results. Combine everything in one centralized place to save you and your client’s time.
2. Use Internal Dashboards To Keep Your Team on the Same Page
There are a few ways your team benefits from creating internal dashboards. For example, keep track of clients that need additional services (think upselling opportunities) or monitor internal agency goals to better understand the ins and outs of your digital marketing activities (think about cost, how much revenue, etc.). Manage your agency in the most scalable way possible with software that lets you keep track of all your client’s campaigns in one place.
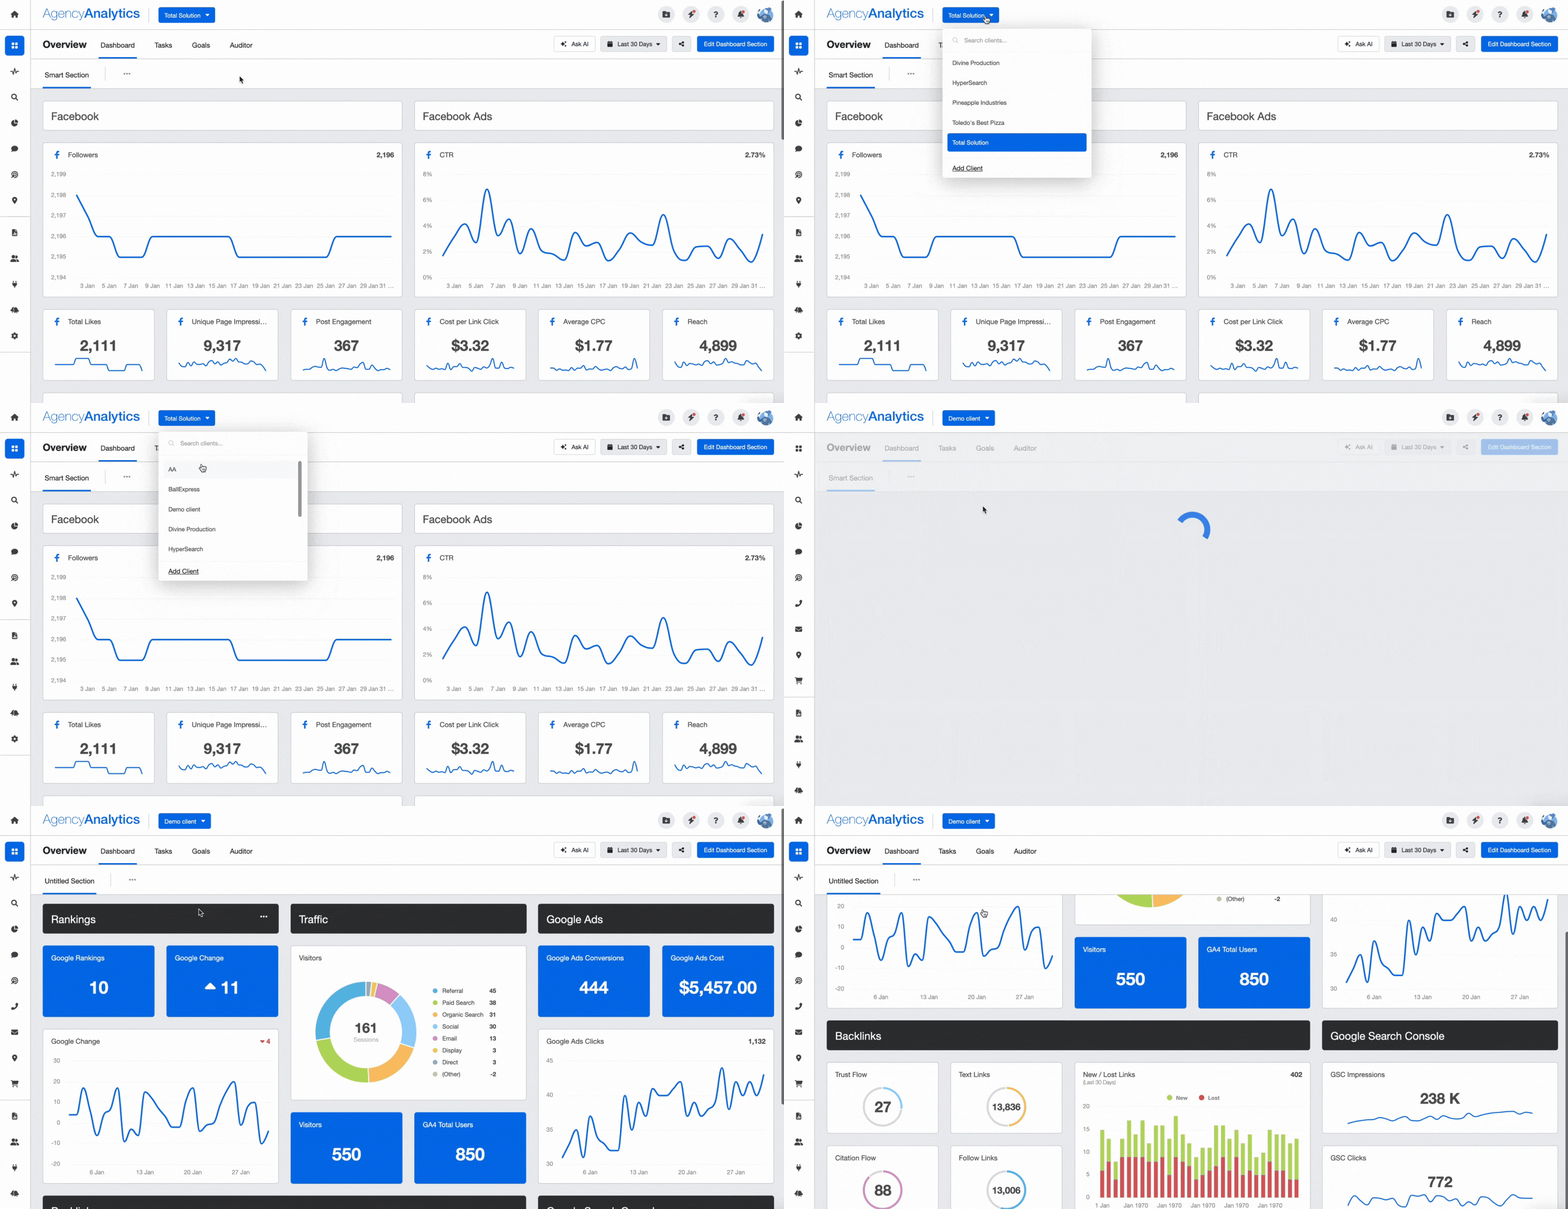
Here are just a few of the 15 dashboard templates available to get you started. Plus, there is a dedicated reporting dashboard for each of the 80+ built-in platform integrations.
3. Give Clients a Login to Their CRM Dashboard
Instead of clients calling your team every time they have a question, give them access to their live dashboard. Streamline your everyday workflow by creating client and user accounts and choose exactly what you want to share with them. Or, try out the API feature and create your own custom login page right from your agency’s website.
4. Use Custom Metrics To Combine CRM Data With Other Campaign Metrics
Create custom marketing dashboards that combine your client’s CRM metrics with their other sales and marketing campaigns. For example, creating a custom metric for their ROAS from a Facebook campaign or the conversion rates across multiple platforms is a great way to connect their entire digital marketing goals to their CRM metrics and overall refined sales report or live marketing dashboard.
5. Use Goals & Annotations To Communicate Your Progress
Tracking goals in your report ensures everyone is on the same page. It gives an opportunity for you to revisit your client’s goals on a regular basis and see how things are progressing so you make any necessary adjustments. It’s also a great idea to highlight future plans for any upcoming campaigns or strategies. One of the best ways to tell a story with AgencyAnalytics is to add annotations and goals to your charts.
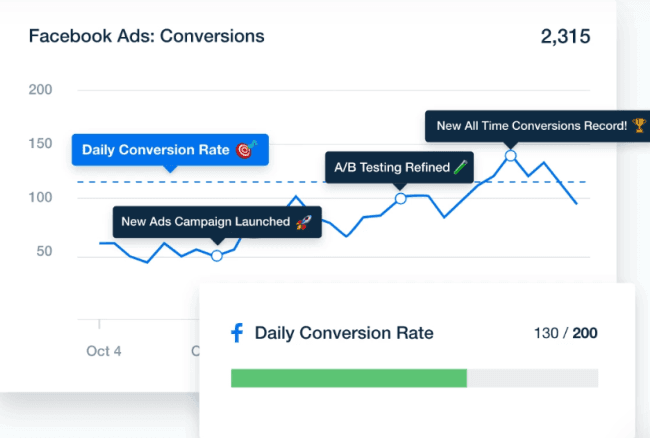
Creating goals helps fill up your client’s sales pipeline while managing their campaign performance goals–without the weekly activity of pulling and extracting all the data into Google Sheets.
6. Visualize Data for Storytelling
Go beyond reporting standard data points by telling a story with the numbers you’re presenting. You want to help inform your clients about their results, leaving them empowered to make informed business decisions. Simplifying how your agency is presenting data highlights easily recognizable patterns and trends that might otherwise be overlooked.
7. Automate Your CRM Reporting To Spend More Time on Billable Tasks
Creating client reports can eat up a lot of your agency’s time and resources. Spend more time on tasks that are actually bringing in revenue with marketing automation tools.
Simply connect your client's data sources, including their CRM, to the AgencyAnalytics platform and start saving valuable time. Choose from prebuilt marketing report templates or create your own customizable dashboard templates.
How To Present Data in Your CRM Reports & Best Practices
Whether your clients use HubSpot or another CRM system such as Keap, Salesforce, or Brevo (formerly Sendinblue), you want to incorporate data visualization so your clients can easily see and understand all of the data you’re presenting.
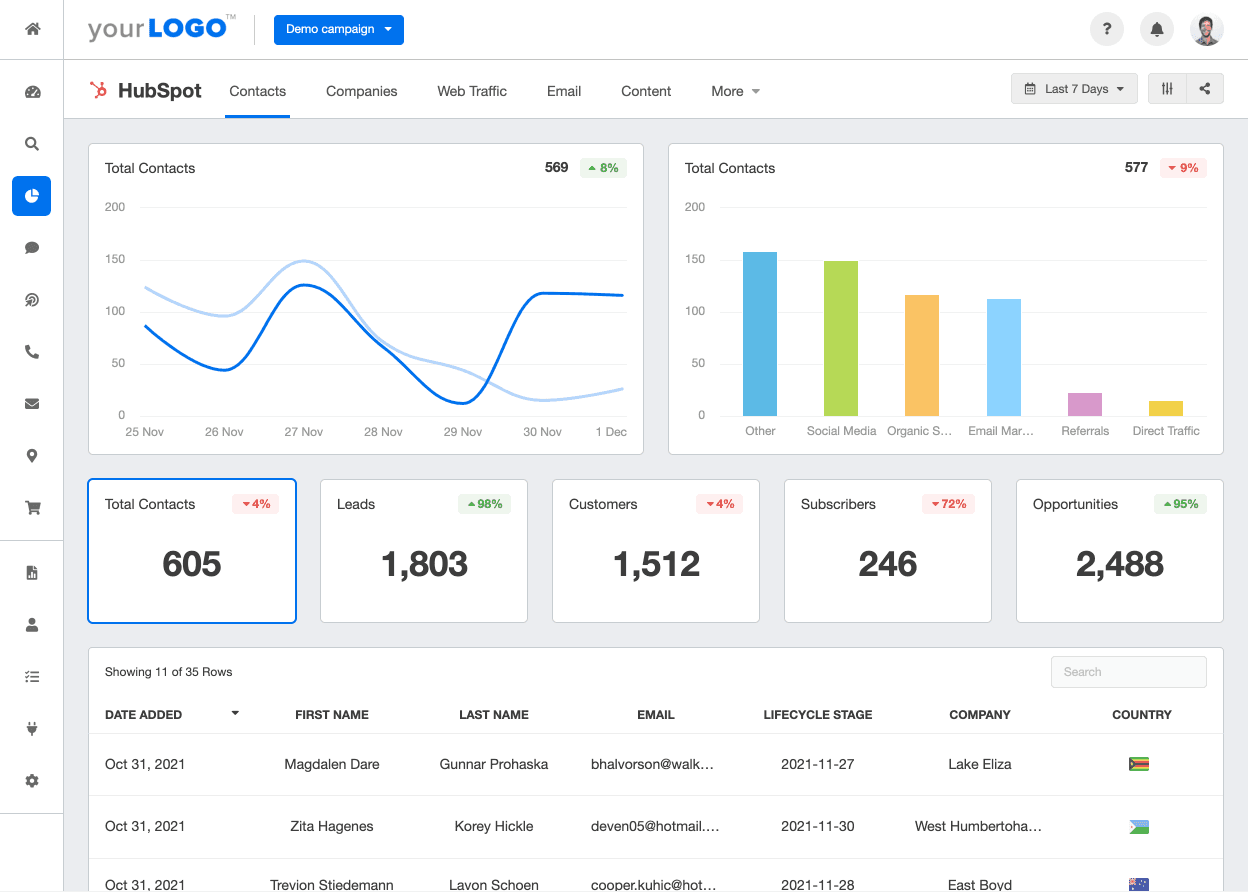
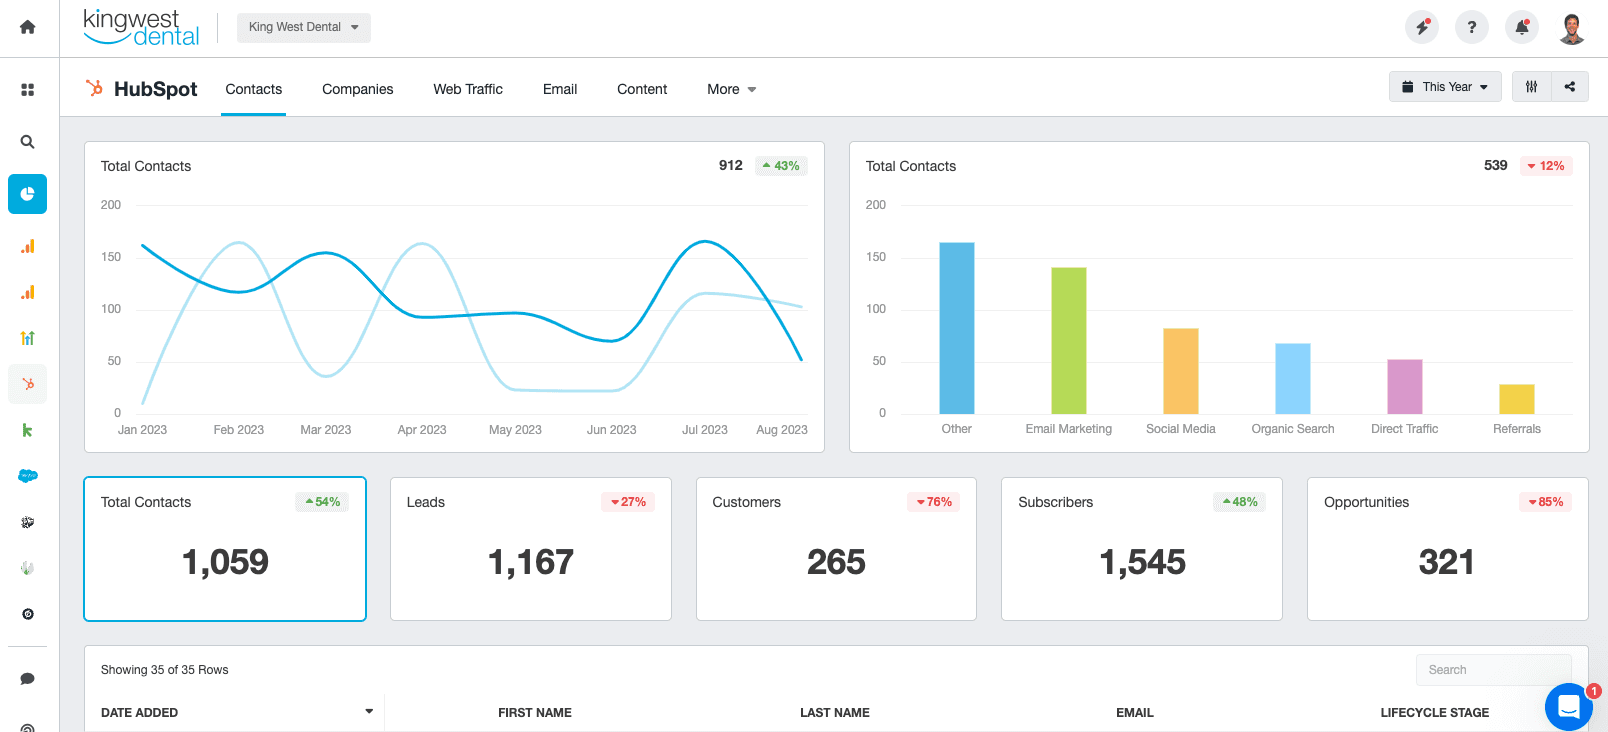
Depending on your client’s key performance indicators, what they want to see in their reports could differ. For example, a dedicated Hubspot reporting dashboard showcases a client's sales funnel, incoming calls, conversion rates, and more, helping them make data-driven business decisions (thanks to the assistance your marketing agency provided).
Here are some best practices to incorporate into a custom report or live CRM dashboard to show real-time data for your clients and their sales teams.
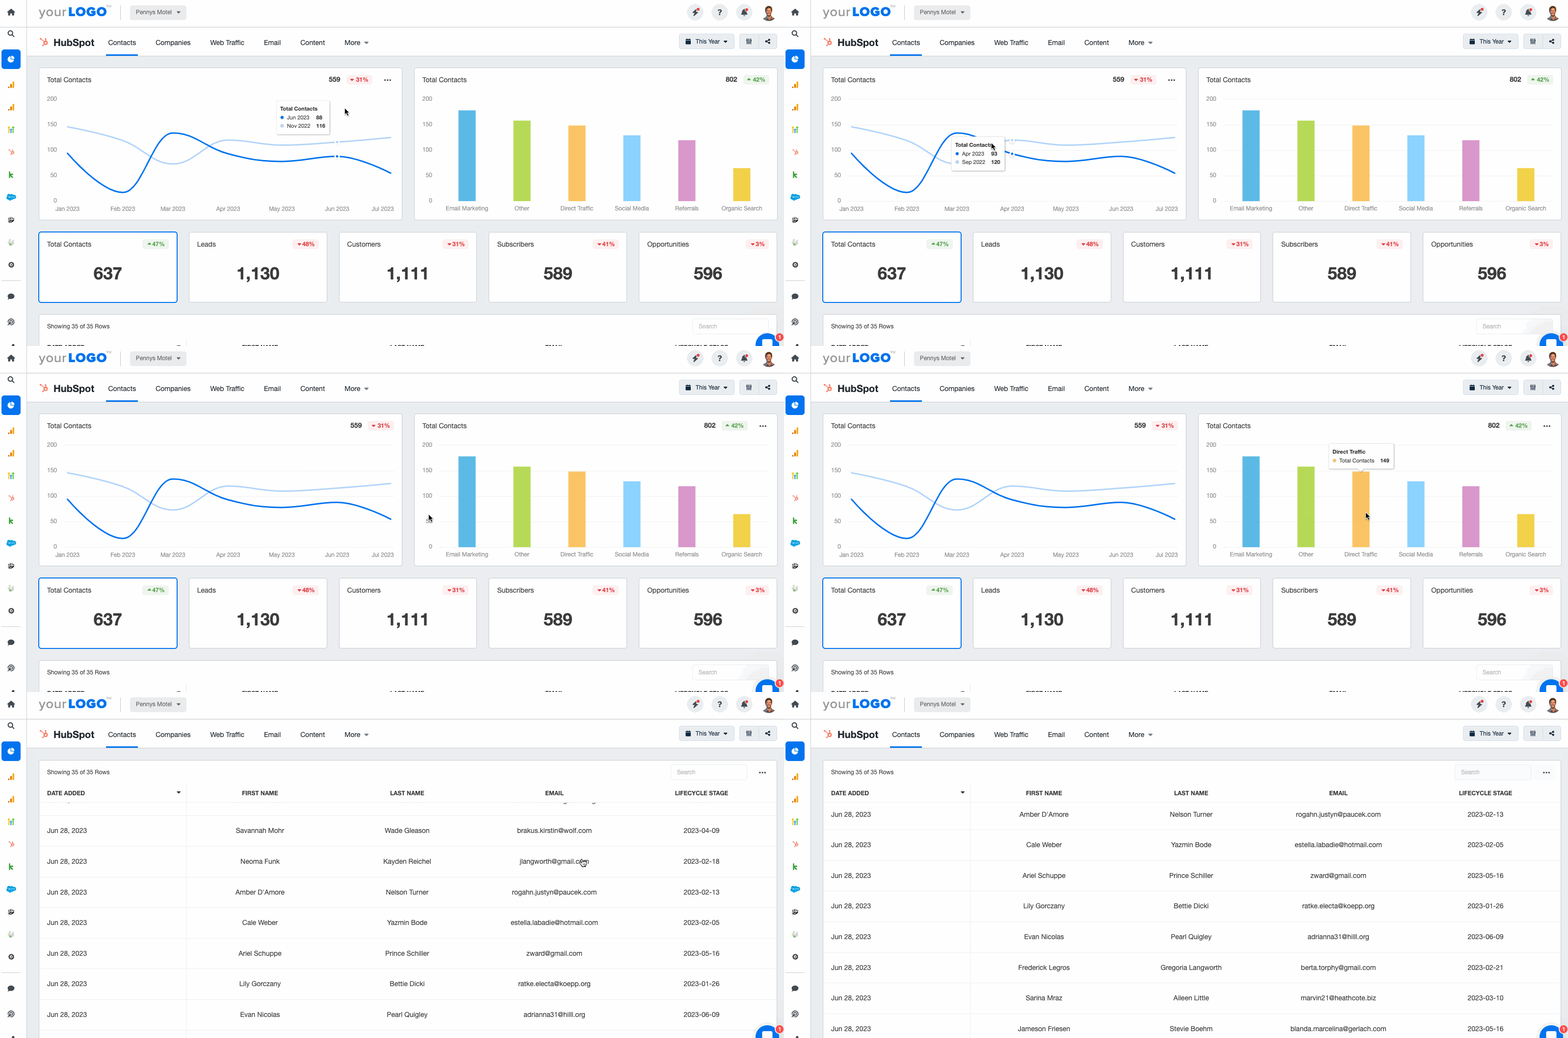
Contacts
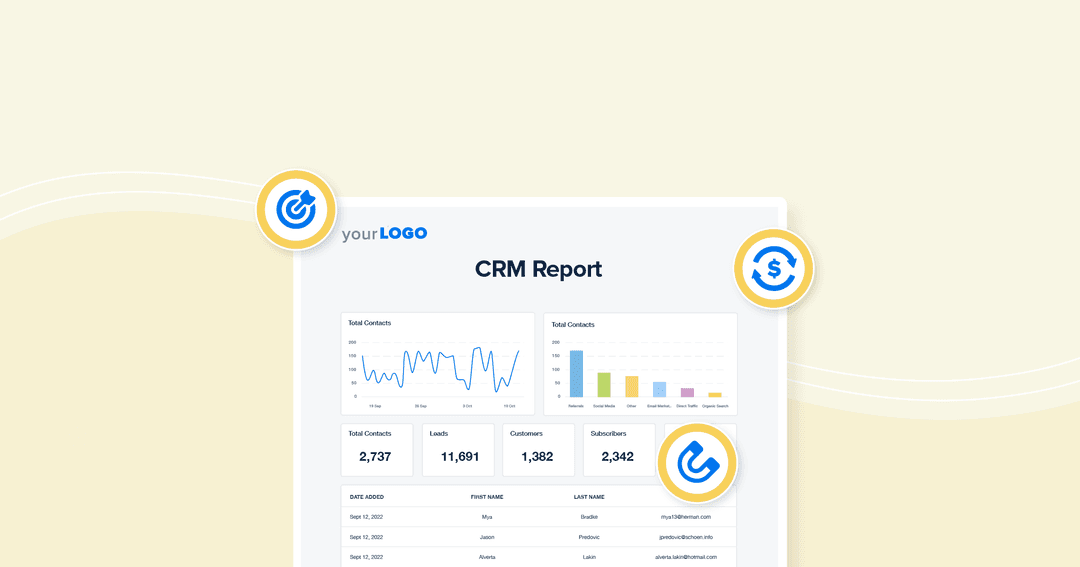
Include a section in their customer relationship management report that goes over contact details such as total contacts, new leads, opportunities, subscribers, data pipeline reports etc. Plus, add a list of those contacts that they can easily reference and follow up with by displaying their first and last name, email, and the date they were added to their CRM.
Companies
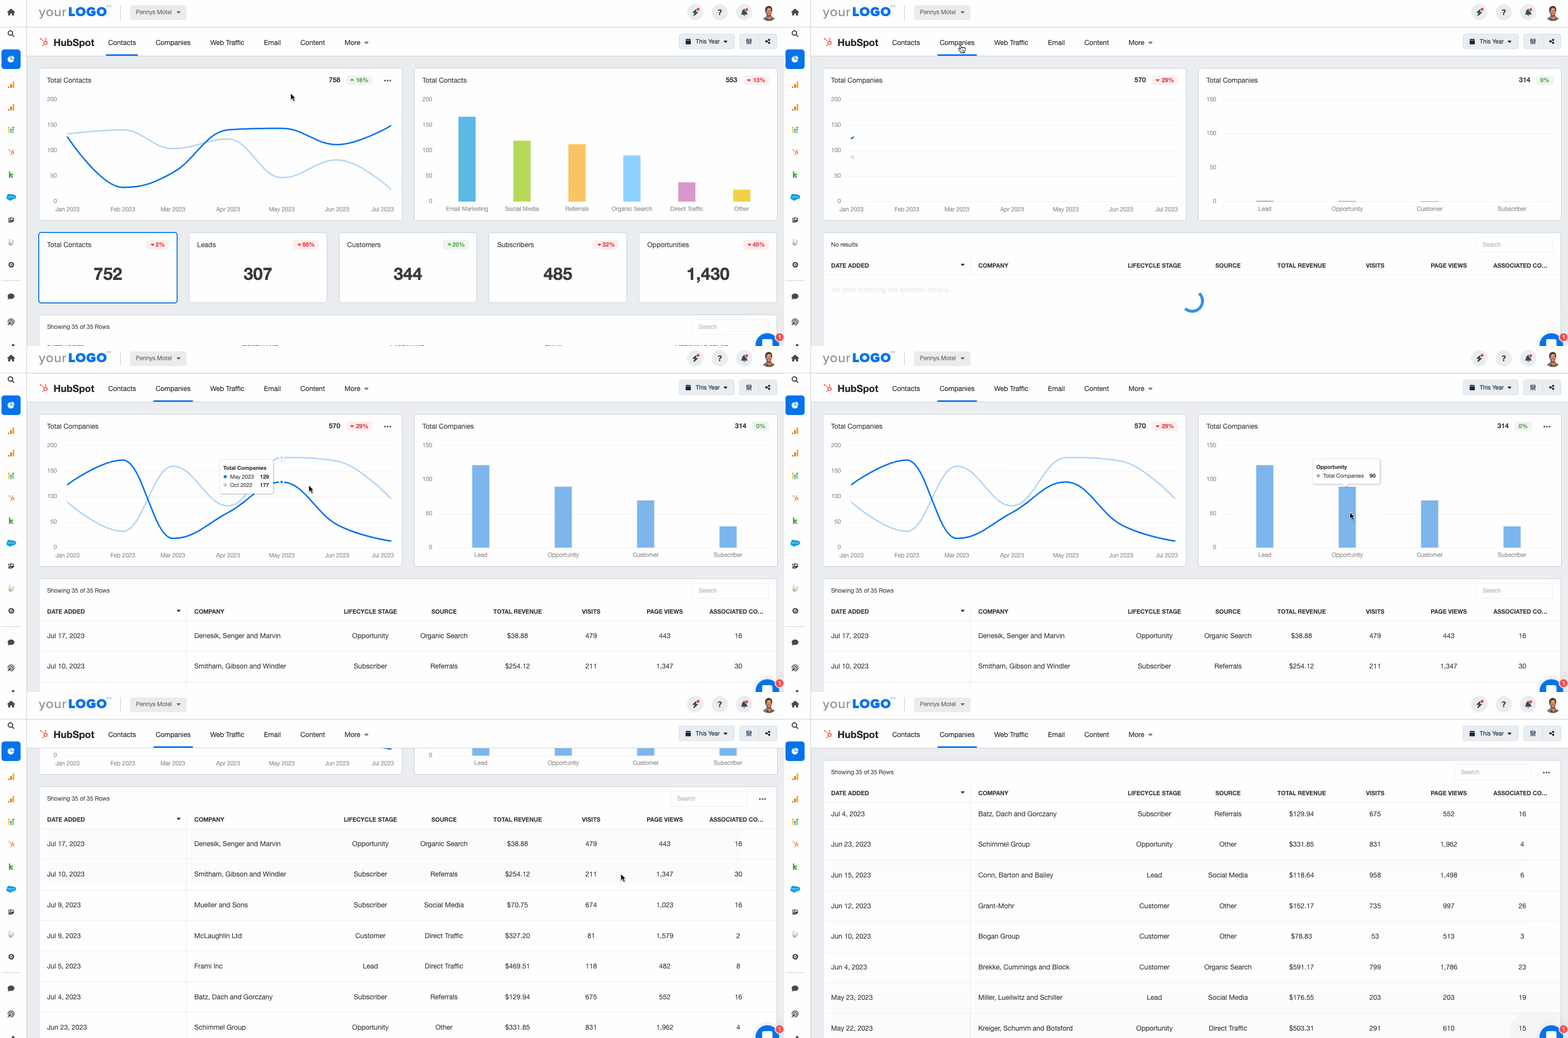
If your client is in the B2B space, it’s helpful to have a dedicated section to the different companies they work with. Test out different data visualizations such as line graphs, bar charts, and even detailed lists that include insights on:
Lifecycle stage
Source
Total revenue
Visits
Web Traffic
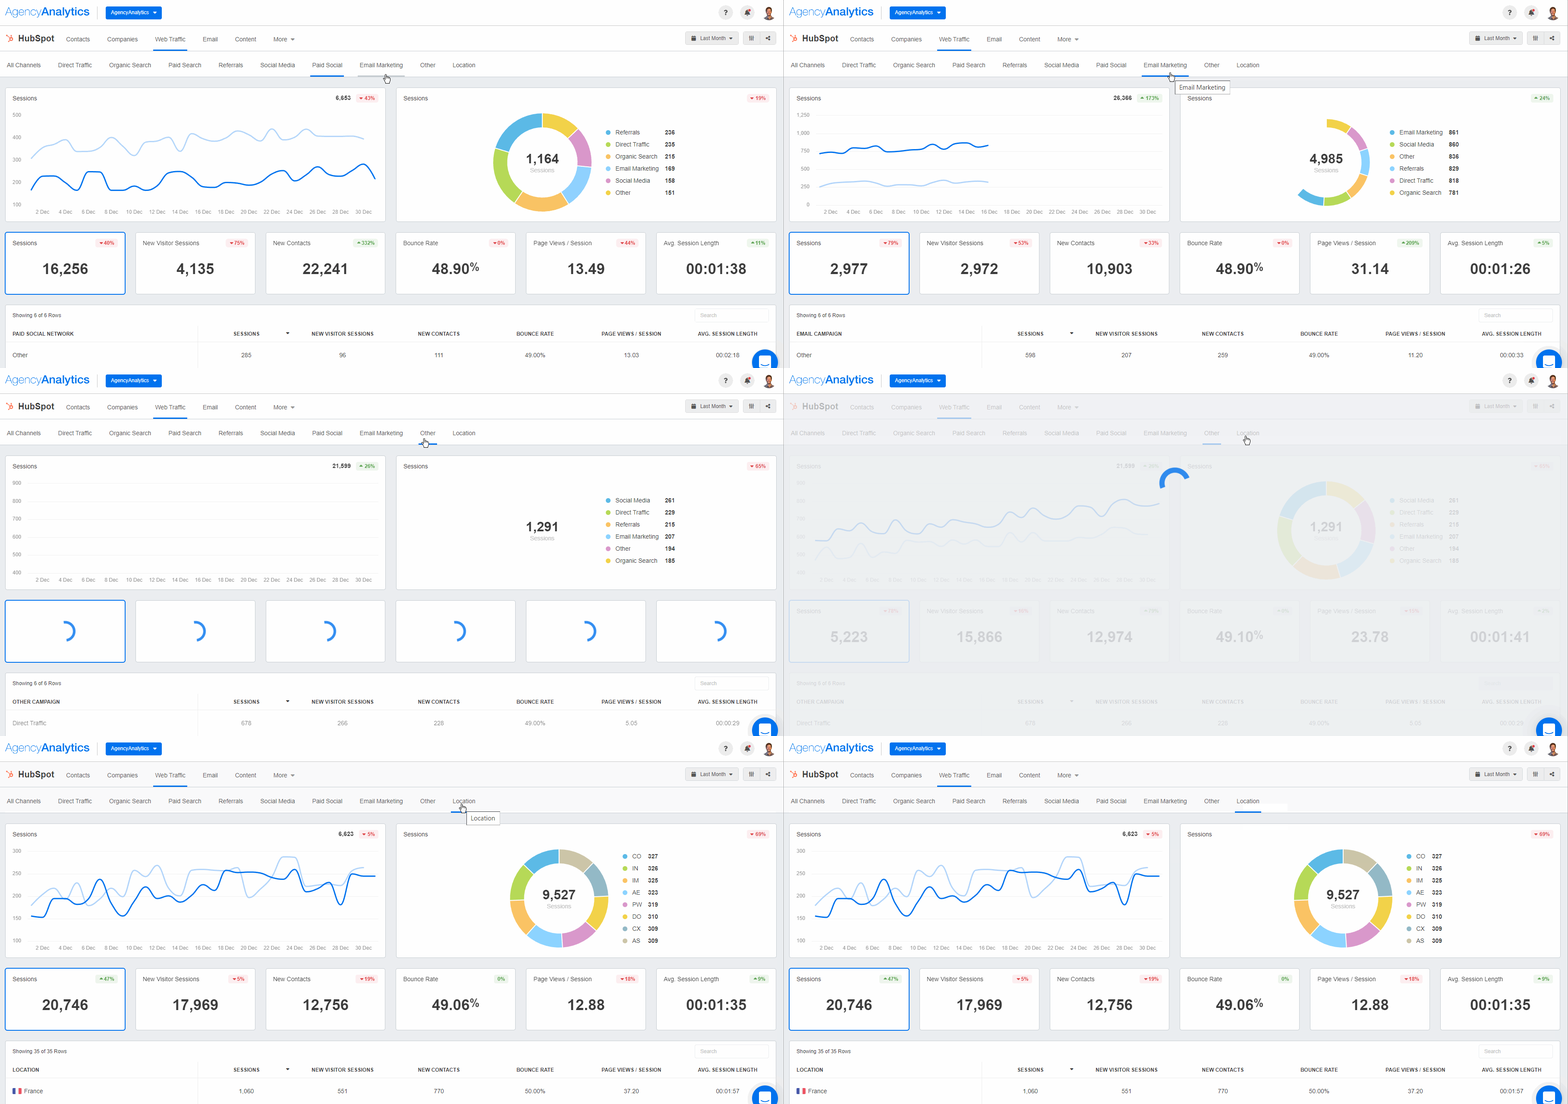
This section in your client’s CRM report can get quite detailed of course. It includes key metrics on the channels their lead source is coming from: direct traffic, organic search, paid search, organic and paid social media, email marketing, and more.
It can be helpful to set up a dashboard for each of these channels but be sure to add metrics such as:
Sessions
New visitor sessions
Contact conversion rates
New Contacts
Bounce rate
Page views/sessions
Returning visits
Opportunities
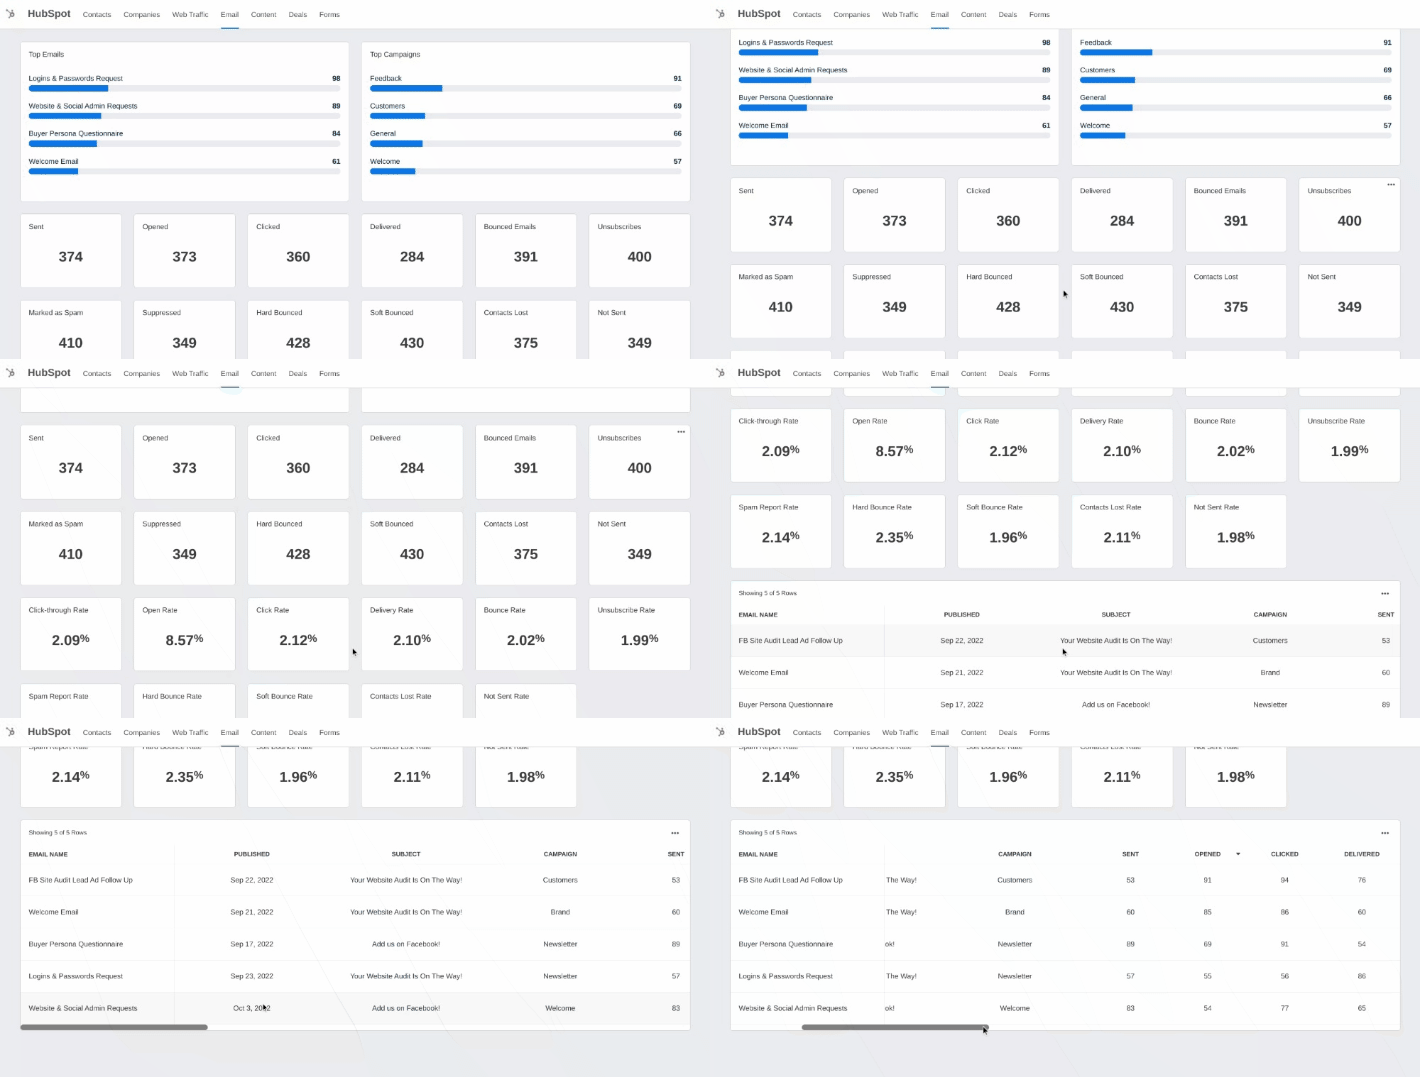
Show your clients how their email campaigns are doing with a clearly laid out dashboard that reveals important information. Make suggestions on how to improve subject lines or create new incentives that improve their email marketing key performance indicators. Report on key metrics such as:
Sent
Opened
Clicked
Delivered
Bounced emails
Unsubscribers
Open Rate
Content
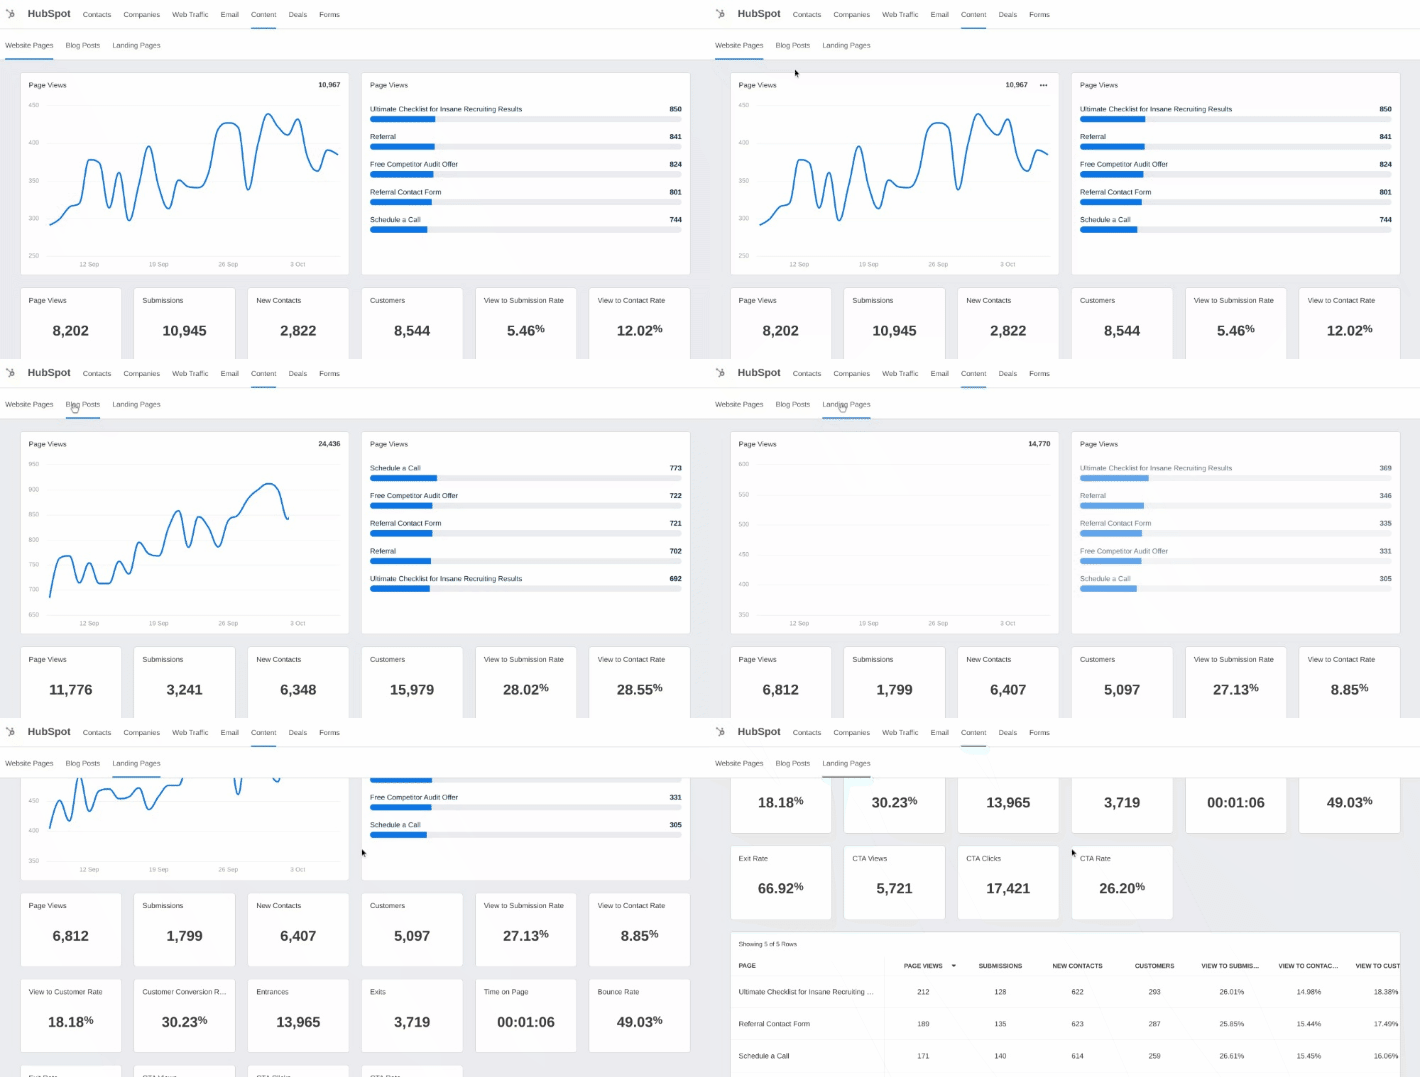
Break out your content dashboard to include website pages, blog posts, and landing pages if these all apply to your client. Clearly demonstrate what content is resonating with their customers and what actions they’re taking. For each section, add metrics such as:
Page views
Submissions
Time on page
Bounce rate
CTA clicks
Deals
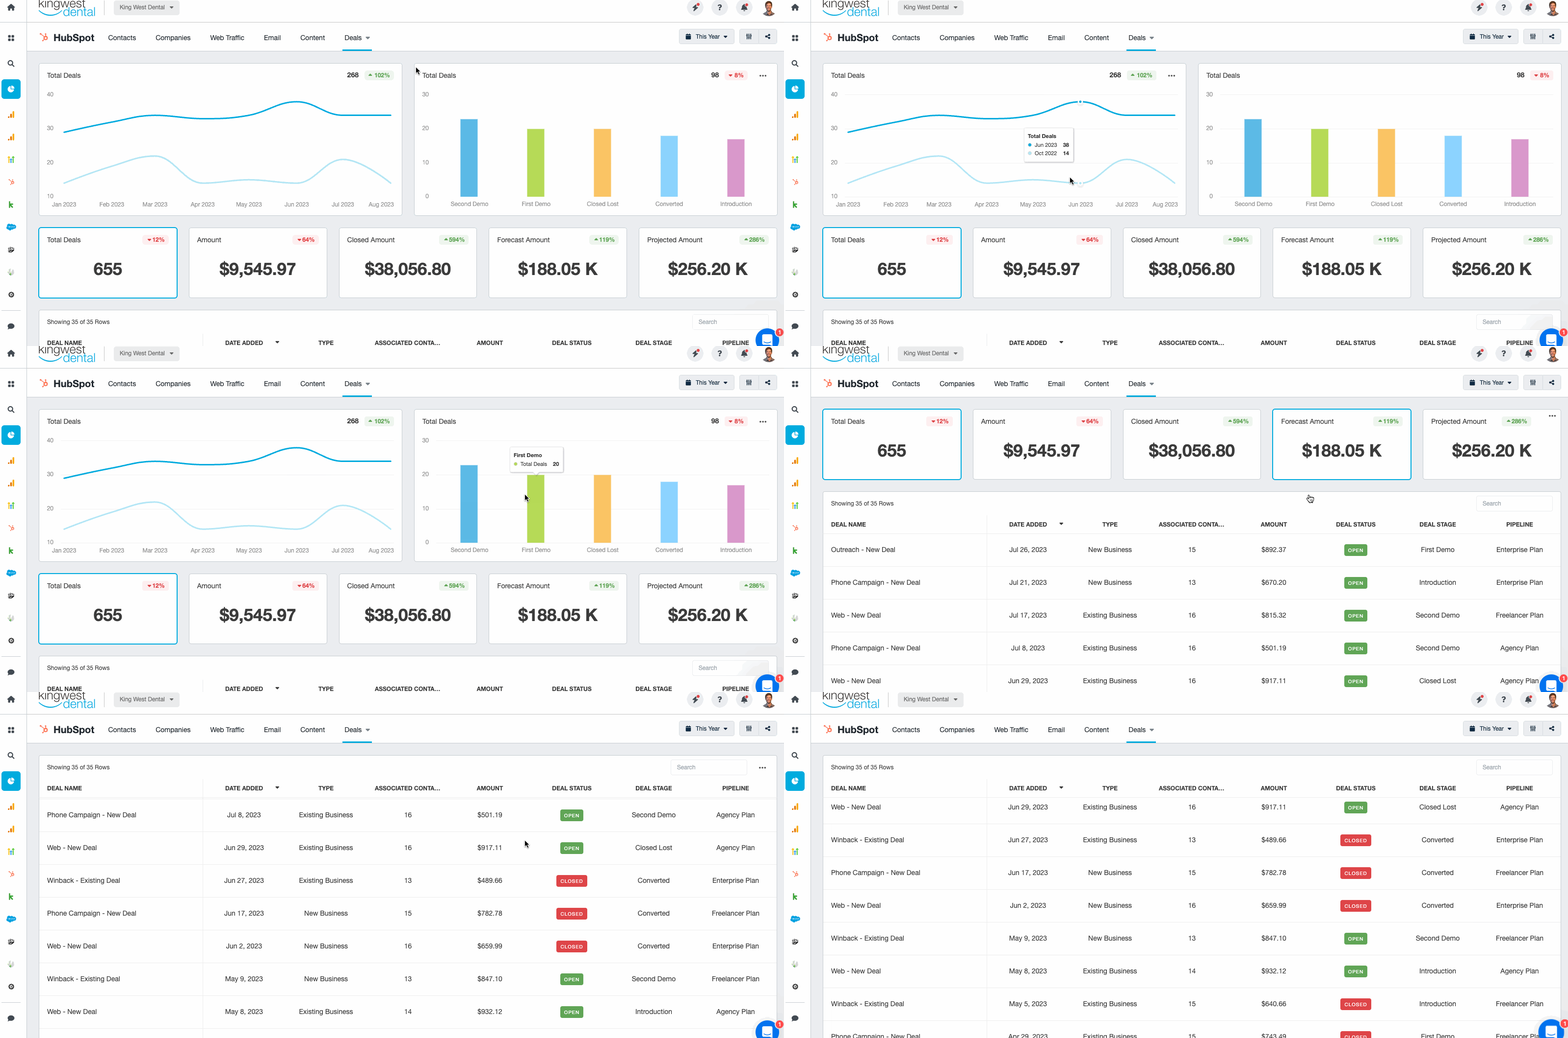
This section shows your client the number of deals closed, forecasted, total amount, and more. Sales forecast reports highlighting deals metrics offer valuable insights for the sales team to understand what sales process might or might not be working, plus a general overview of the status of their deals.
Incorporating sales reporting alongside a deals dashboard highlights what deals your client closed from a first or second product demo, for example, and where their sales rep can dedicate time toward meeting their sales goals.
Cover some of these key deals metrics:
Total deals
$ amount
Closed amount
Sales forecast amount
Projected amount
Forms
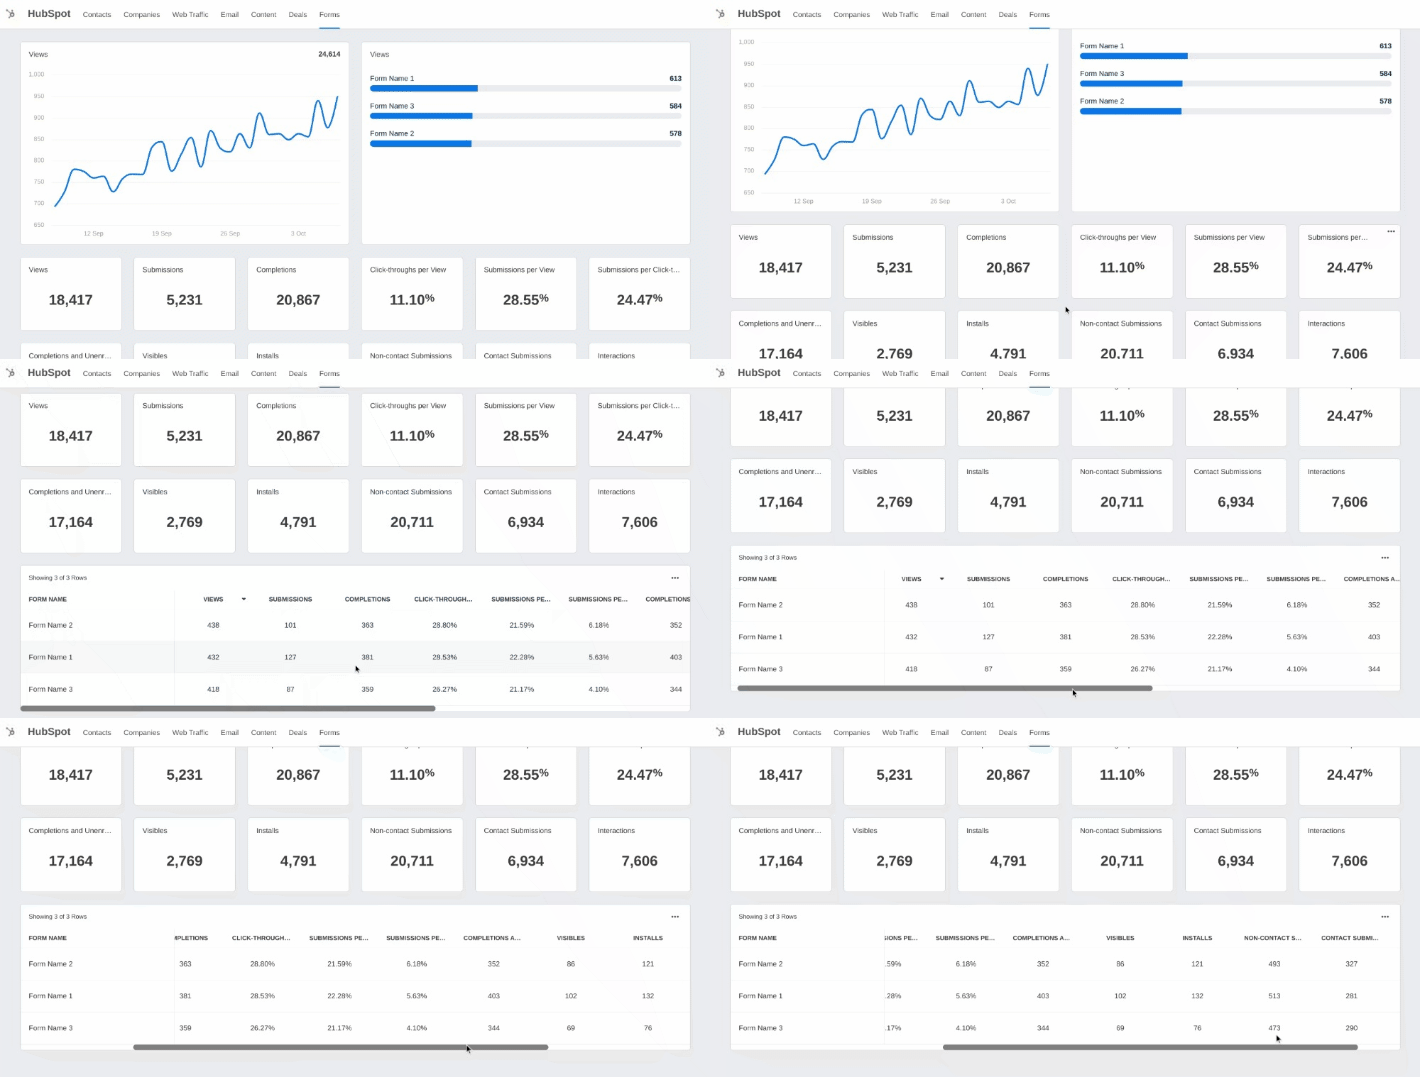
If your client has forms on their website for scheduling appointments, contacting a salesperson, joining a waitlist, or any other type of form, you want to keep track of these in their customer relationship management report. This keeps everything in one place for sales managers and their sales teams to view things like common pain points their customers may be inputting into form submissions.
Let them know what is resonating with their customers and make strategic adjustments. Some metrics to highlight:
Views
Submissions
Completions
Non-contact submissions
Contact submissions
Automate Your CRM Reporting
CRM reports bring valuable insights marketers use to their advantage when communicating with their clients. The custom reports allow you to adjust sales process, sales performance, acquisition strategies, email, and advertising campaigns, switch between converting channels, personalize communication, and predict ROI–all valuable assets to your clients.
Save your agency’s valuable time by putting your data reporting on autopilot. Reporting tools help your agency set easy scheduling and decide if you want to approve each report before it gets sent to clients if you want to review and address any issues.
Customizable, white-labeled reports showcase your agency's professionalism. Create easy-to-understand reports that combine your client’s CRM report with data from over 80 different marketing data sources, including GA4, PPC, SEO, and social channels, to create a detailed and complete picture of your client’s marketing campaigns.
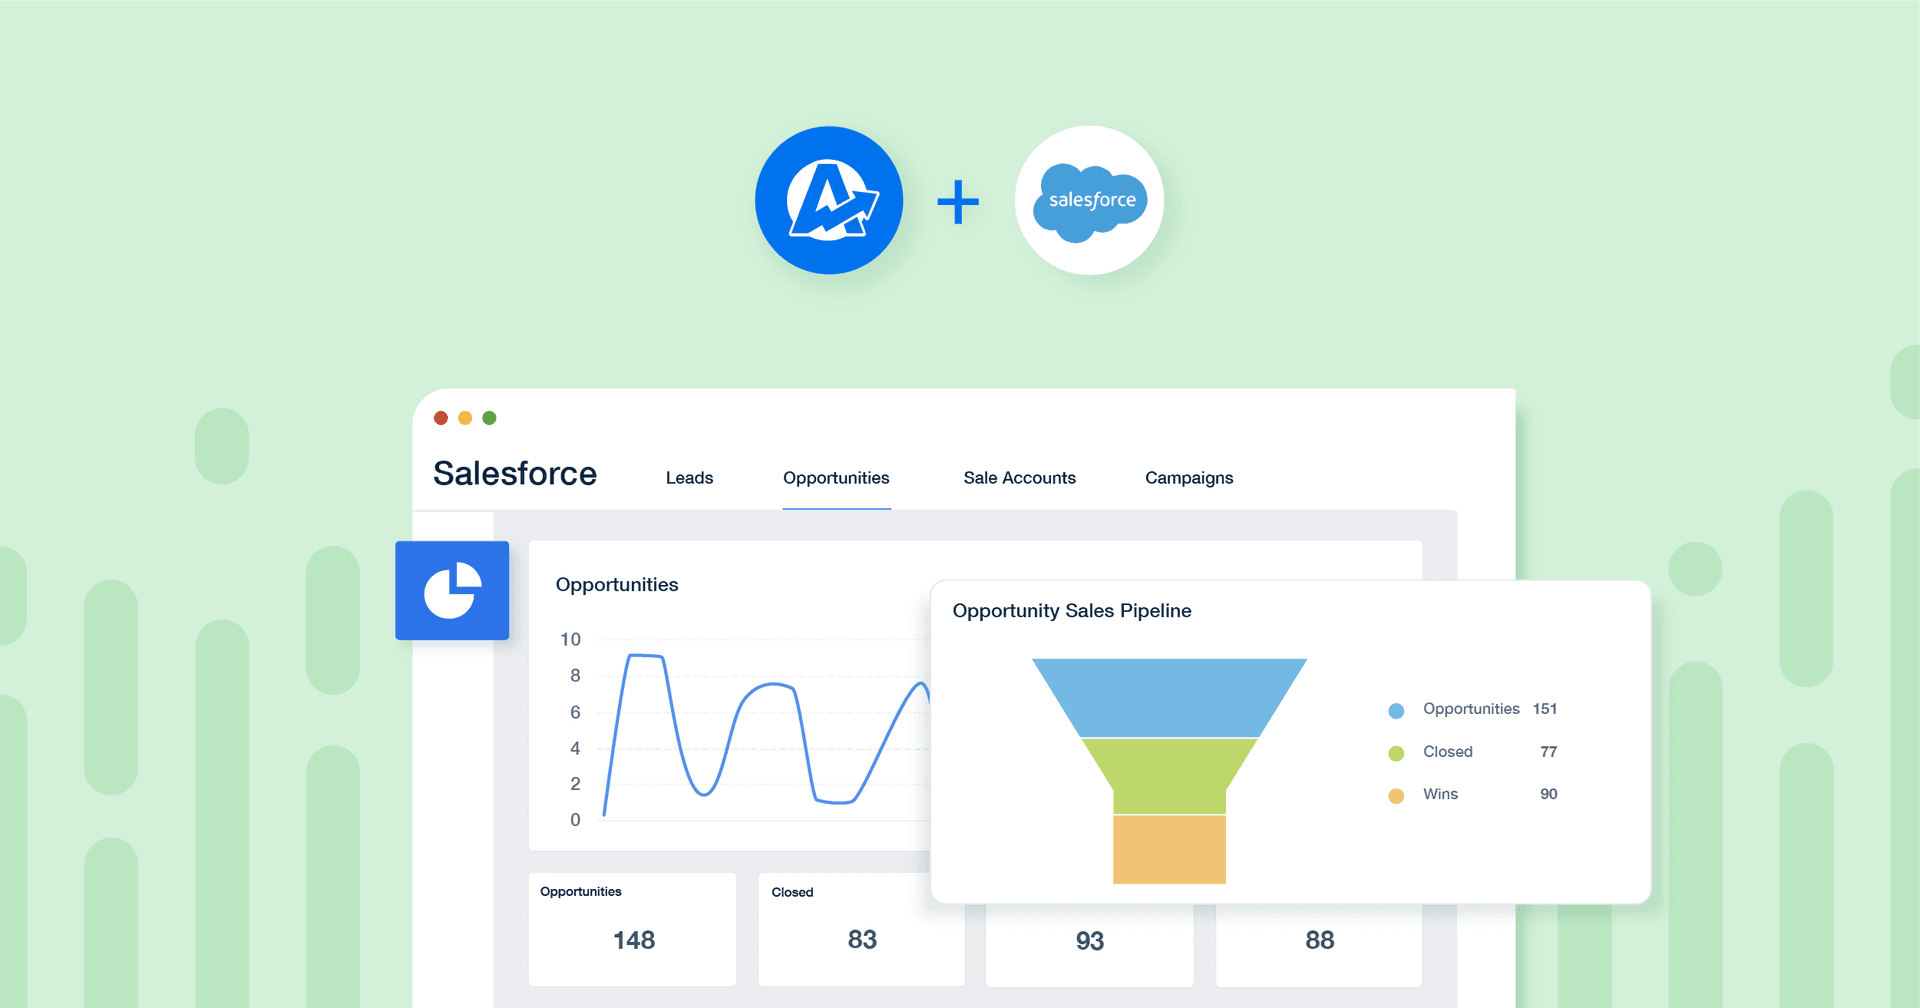
What are you waiting for? Use a customizable Salesforce report template to showcase your agency's value. Start your free 14-day trial to create CRM reports in minutes.

Written by
Richelle Peace is a writer with a degree in Journalism who focuses on web content, blog posts, and social media. She enjoys learning about different topics and sharing that knowledge with others. When she isn’t writing, Richelle spends time teaching yoga, where she combines mindfulness, movement, and her passion for wellness.
Read more posts by Richelle PeaceSee how 7,000+ marketing agencies help clients win
Free 14-day trial. No credit card required.


