Table of Contents
QUICK SUMMARY:
Product-Led Growth metrics focus on user behavior and product interaction rather than traditional sales-driven approaches. This blog explores essential PLG metrics like Monthly Recurring Revenue (MRR), Churn, Product Qualified Leads (PQLs), Activation Rate, and Daily/Monthly Active Users (DAU/MAU) and why these metrics are instrumental in shaping user engagement and driving growth.
Working with clients who have implemented a Product-Led Growth strategy requires a shift in focus at your digital agency. Here, the product becomes the centerpiece of the marketing strategy; instrumental in attracting and maintaining users, primarily through the inherent value and functionality of the product.
The Product-Led Growth Flywheel is a strategic framework designed to accelerate growth by leveraging the product itself as the primary driver of customer acquisition, retention, and expansion. Unlike traditional sales-driven models, the PLG approach focuses on creating a product experience that attracts users, engages them deeply, and ultimately converts them into loyal customers.
For SaaS clients, success hinges on this approach, so it’s essential to measure Product-Led Growth effectively. This means going beyond traditional marketing metrics to evaluate how the product directly contributes to acquiring and retaining paying customers. It involves analyzing user interactions with the product and tracking how these interactions lead to conversions and long-term customer loyalty. And of course, most importantly, it means placing your client's product at the center of every marketing strategy you develop.
How will that PPC campaign drive free trial signups? How will those TikTok videos encourage potential leads to try out your client's product? And how will you measure PLG metrics to prove to your SaaS client that their investment in your agency is paying off?
In this guide, we dig into the specifics of Product-Led Growth metrics. Our aim is to provide a clear, actionable framework for your digital agency to track and interpret these metrics, to ensure the continued alignment of marketing efforts with the core value of the product.
A Brief Primer on Product-Led Growth
Product-Led Growth created a paradigm shift in the SaaS industry, focusing on the product itself as the main catalyst for customer acquisition, engagement, and retention. In a Product-Led Growth model, the product solves the user's problems and provides an intuitive and compelling user journey that encourages adoption and loyalty. User feedback is paramount, as input from existing customers is used to improve the product and make it more appealing to potential customers.
Customer satisfaction is ultimately the goal of a great partnership. Do clients love you even more because of a new service/product offered via a strategic partnership? Hopefully, the answer is yes! All other metrics are secondary.
James Shaw, Creative Director, Twin Creek Media
What is the Pirate Metrics Framework?
If your agency is working with SaaS clients, you may have heard mention of the Pirate Metrics Framework, often referred to as AARRR. It’s a framework for measuring and optimizing customer journey and growth for SaaS companies. The name "Pirate Metrics" stems from the acronym AARRR, which stands for Acquisition, Activation, Retention, Referral, and Revenue. These five metrics provide a simple yet comprehensive way to understand and improve the customer lifecycle and business growth.
Here’s a brief overview of each stage:
Acquisition: This stage involves attracting new users or customers to the product or service. It focuses on how users find and arrive at the product.
Activation: Once users are acquired, the activation phase ensures they have a great first experience. It's about making a strong first impression that leads to initial engagement with the product.
Retention: This step is about keeping users coming back. Retention strategies focus on creating long-term value for users, encouraging them to continue using the product.
Referral: Satisfied users are encouraged to refer others to the product, expanding the user base through word-of-mouth or referral programs.
Revenue: The final stage is where users contribute to the business's financial success, whether through direct purchases, subscriptions, or other revenue streams.
The Pirate Metrics Framework is particularly relevant to Product-Led Growth (PLG) strategies for several reasons:
Focus on the Product Experience: PLG emphasizes the role of the product in driving growth. This aligns closely with the Activation and Retention stages of the AARRR framework, where the user’s interaction with the product is crucial for engagement and long-term loyalty.
Organic Acquisition and Referral: In PLG, the product is the primary tool for acquiring new users. A great product experience leads to organic growth through user referrals, which is a key element of the Referral stage in the AARRR framework.
Data-Driven Approach: Both the Pirate Metrics and PLG rely heavily on data and metrics to understand user behavior and optimize the product. This analytical approach is essential for measuring the effectiveness of each stage of the customer lifecycle.
Revenue Through Product Value: In PLG, revenue is often generated when users recognize the value of the product and convert from free to paid versions or opt for premium features. This directly ties to the Revenue stage of the AARRR framework, where monetization strategies are implemented.
With the Pirate Metrics Framework, the key aspects of a client's growth are intrinsically tied to the principles of Product-Led Growth. By focusing on improving each stage of AARRR, agencies effectively implement strategies that support the client’s PLG strategy.
Impress clients and save hours with custom, automated reporting.
Join 7,000+ agencies that create reports in minutes instead of hours using AgencyAnalytics. Get started for free. No credit card required.
Reporting on Product-Led Growth Success
Like any growth strategy, creating detailed client reporting is an essential part of the process. Client reporting lets your agency celebrate your successes with your clients while keeping them in the loop on challenges that need to be addressed.
Let’s take a closer look at how to create an effective reporting structure on PLG metrics.
Top PLG Metrics To Measure Success
Client reports for product-led companies should including the following KPIs and product analytics:
Time to Value (TTV)
The time it takes for a customer to experience full value from a product, generally measured from when they sign up to when they start using key features. This metric helps clients achieve higher revenue growth rates.
To clearly measure this metric, it’s important to define what “value” means for your client.
To Measure:
Track the time it takes users to complete the self-serve onboarding procedure, measure the time it takes users to activate key features after sign up, and track conversion and customer retention rates.
Marketing Qualified Leads
A marketing qualified lead is a prospective customer who has shown interest in a company's products or services and meets specific criteria set by the marketing team, such as engagement with specific marketing assets.
To Measure:
Track views, downloads, or clicks on high-value assets that have a history of leading users to the next stage in the lead qualification funnel or purchases.
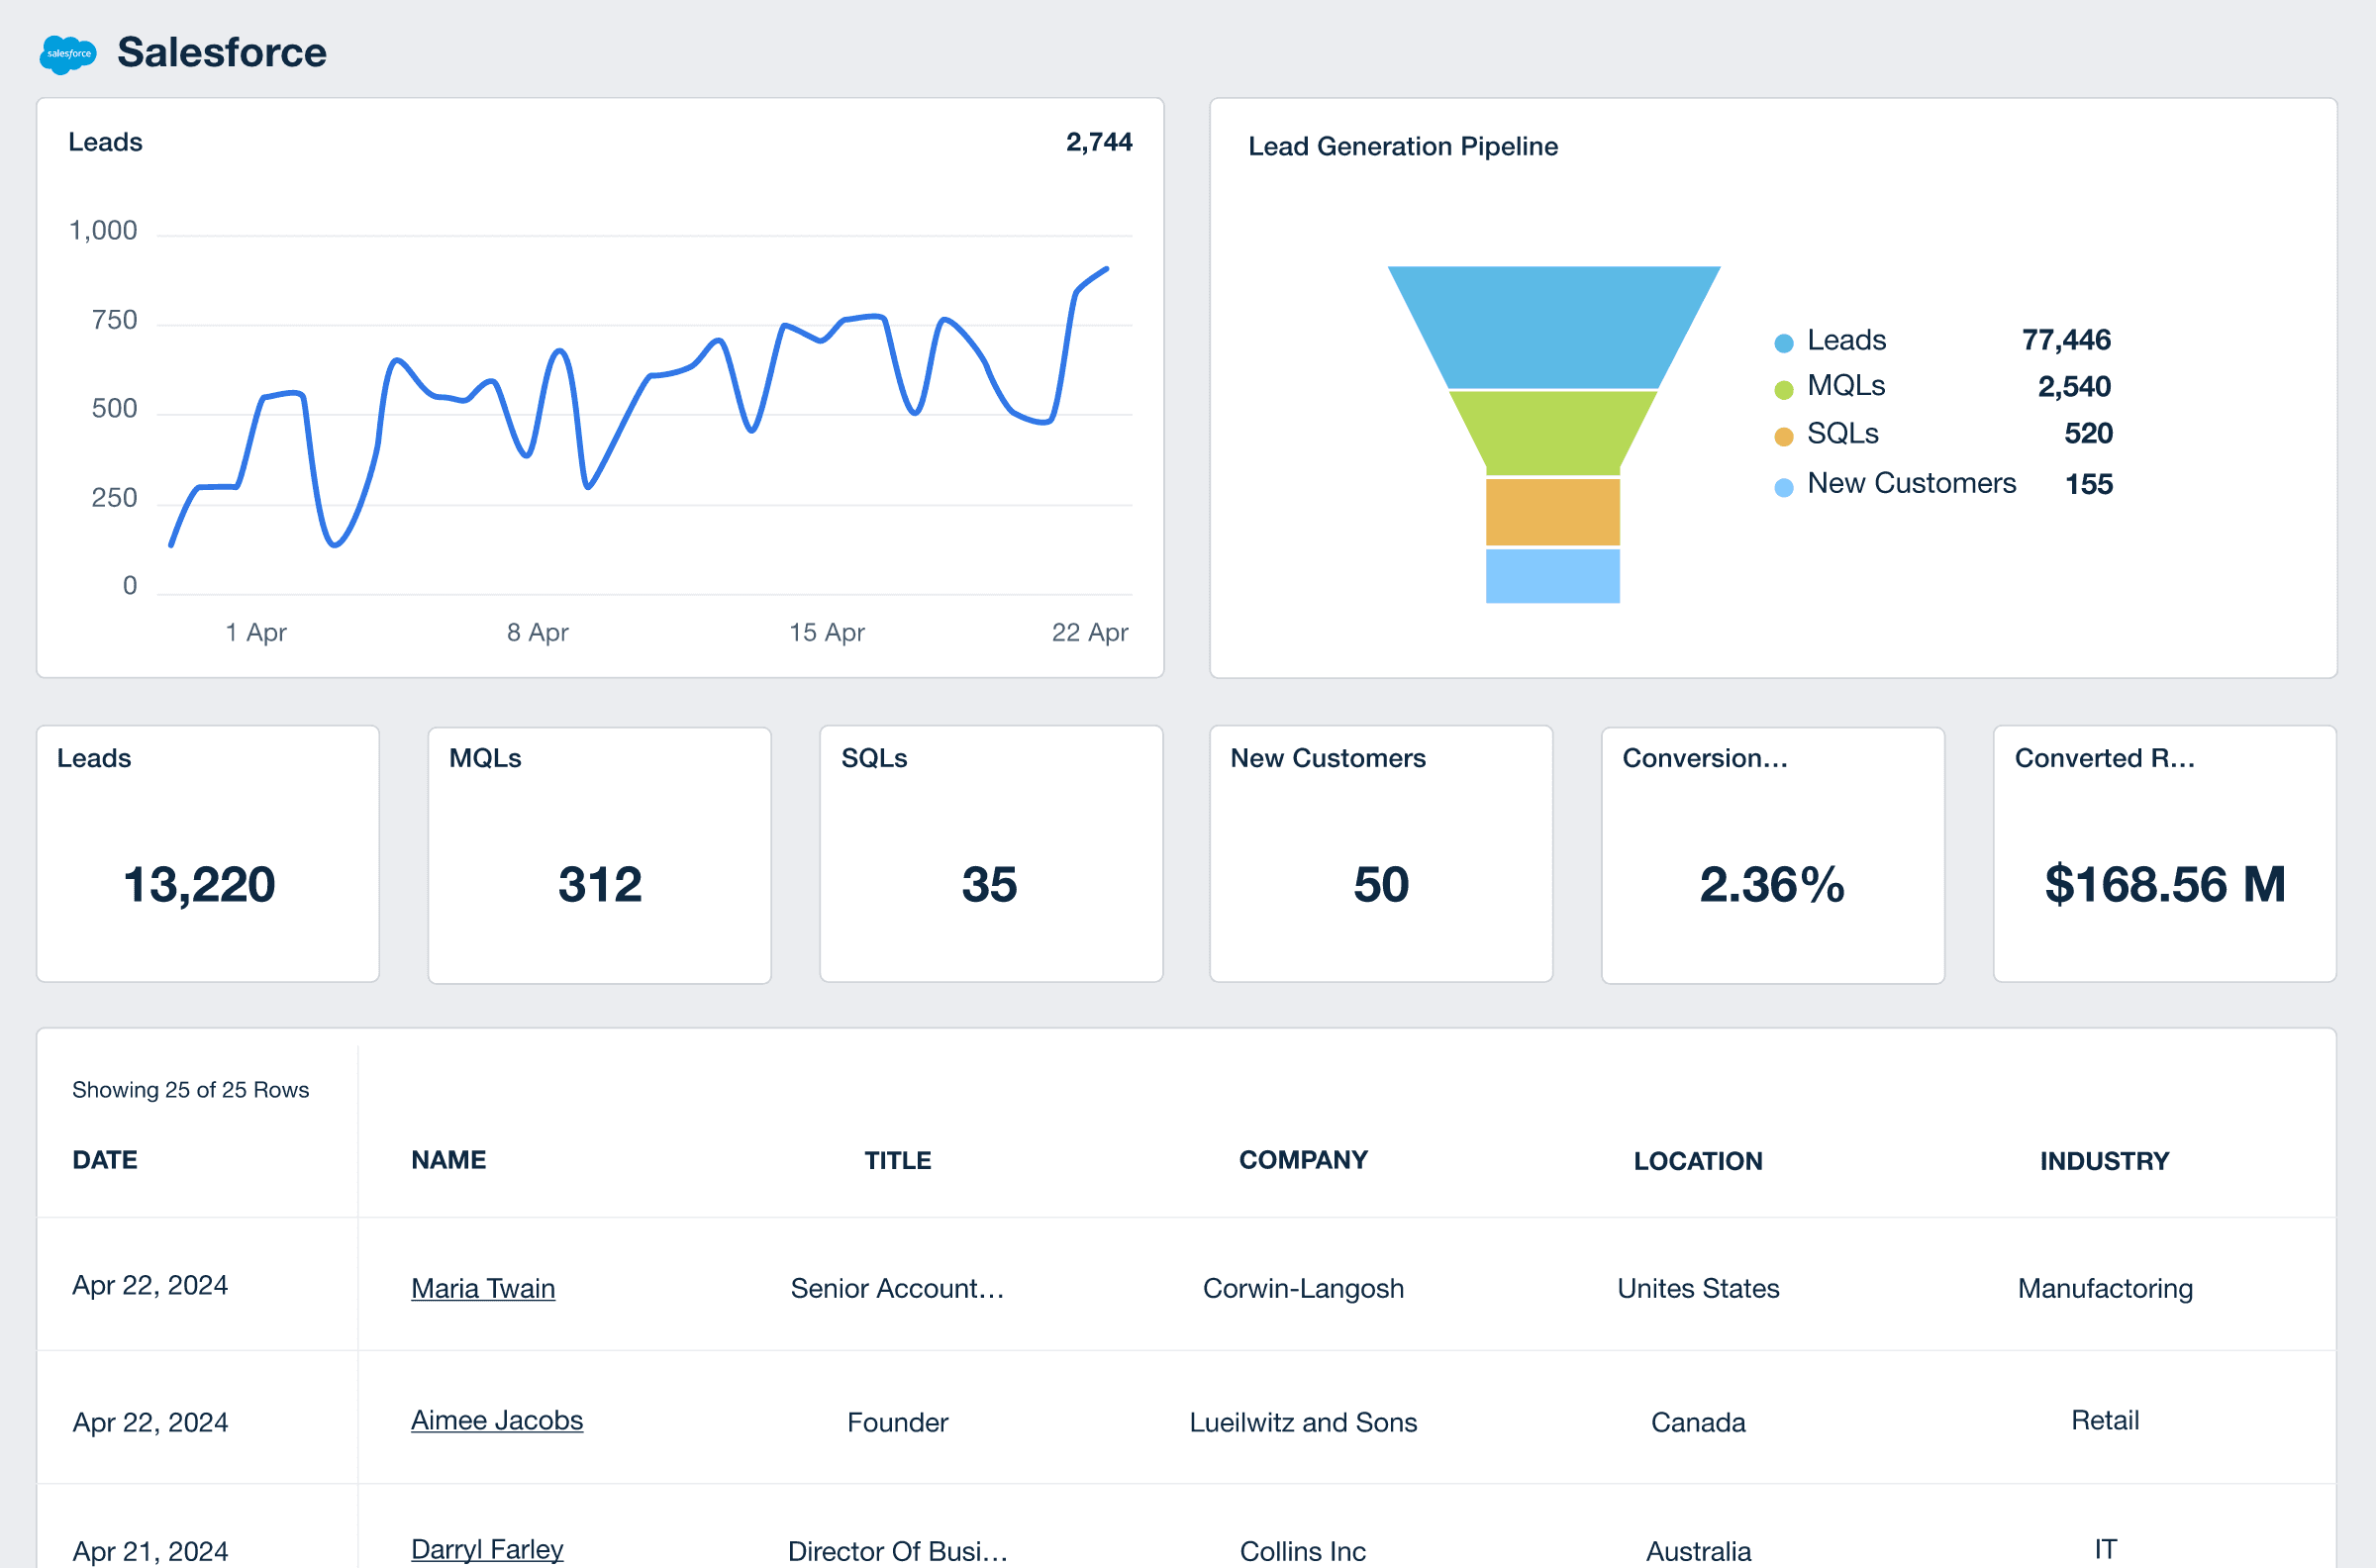
Track MQL fluctuations, assess lead quality, and see how these leads measure against conversion rates and revenue potential with an automated Salesforce dashboard. Try AgencyAnalytics free for 14 days.
Product Qualified Leads
PQLs are what we call “activated users”, which are free users (typically on a free trial or freemium model) that have engaged in a meaningful way with the product’s key features and have a high chance of converting to paid subscriptions.
To Measure:
Track activation and engagement metrics such as frequency of logins, time spent in the product or features used.
Sales Qualified Leads
A prospective customer who has moved beyond the initial interest stage and has been vetted by both marketing and sales team as a potential buyer, showing readiness to make a purchasing decision.
To Measure:
Track conversions from MQLs to SQLs by monitoring criteria such as completed forms, direct inquiries, engagement with sales representatives, and participation in product demonstrations or trials.
Activation Rate
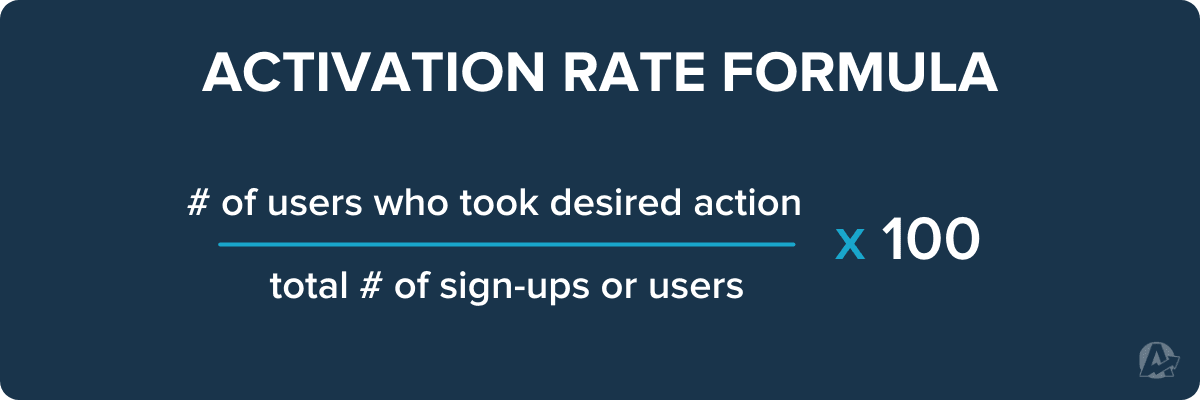
Activation rate measures the percentage of users who took a desired action after engaging with your client’s product. This might be signing up for the free trial, converting from a freemium plan to paid, or utilizing a specific add-on feature.
To Measure:
To calculate the activation rate, begin by determining the action(s) your client is interested in tracking. Next, use the following formula:
Customer Acquisition Cost
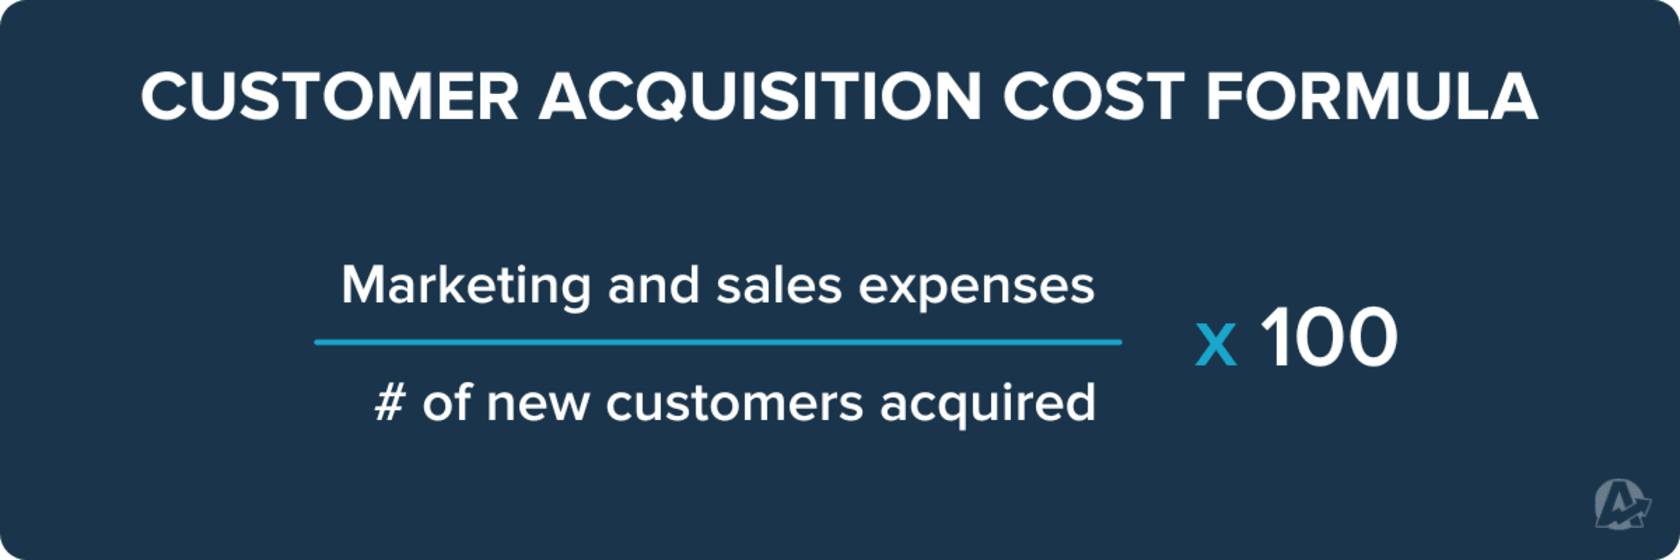
Customer Acquisition Cost (CAC) measures the expense incurred to acquire a new customer, an essential metric in Product-Led Growth strategies. It reflects the effectiveness of these strategies in terms of cost-efficiency. A lower CAC indicates a more efficient, product-driven user acquisition approach.
We use the average customer’s lifetime value to calculate customer acquisition cost targets in several ways. Setting advertising budgets, optimizing conversion rates, refining customer targeting and monitoring campaign performance.
Ken Krystofik, Head of Client Development, Intellisea
To Measure:
Calculate CAC by dividing the total costs associated with acquiring more customers (including marketing and sales expenses) by the number of new customers acquired in the same period. Analyze this metric to ensure sustainable growth and profitability.
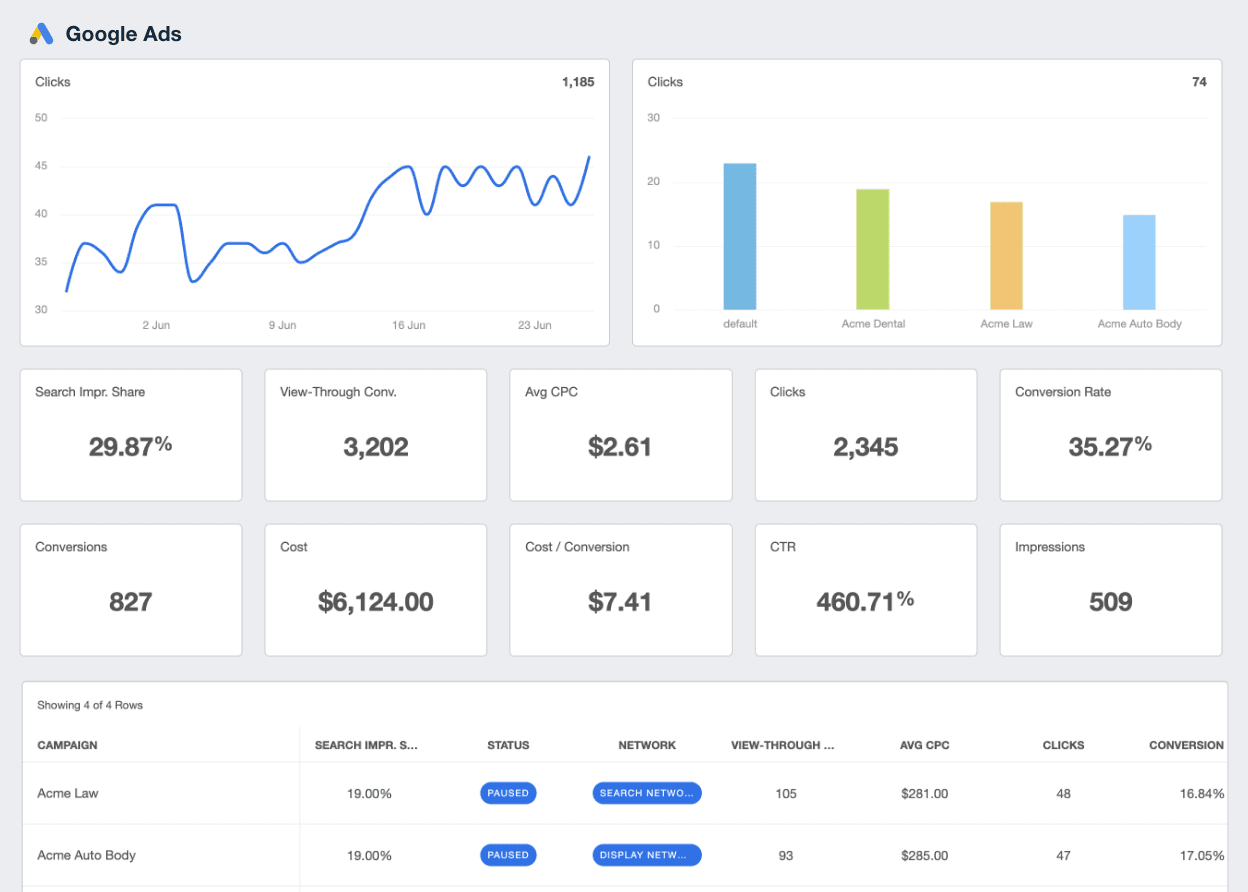
The AgencyAnalytics Google Ads integration makes it easy to track key metrics like CAC in just a few clicks. Try it free today for 14 days.
Active Users (Daily, Weekly, Monthly)
Daily Active Users (DAU), Weekly Active Users (WAU), and Monthly Active Users (MAU) illustrate how many active customers are using your client’s product every day, week or month. This metric gives you a sense of whether product-led strategies are effective in increasing the number of users over a set period of time.
To Measure:
Simply track the number of users each day, week, or month over a desired time period and interpret any trends.
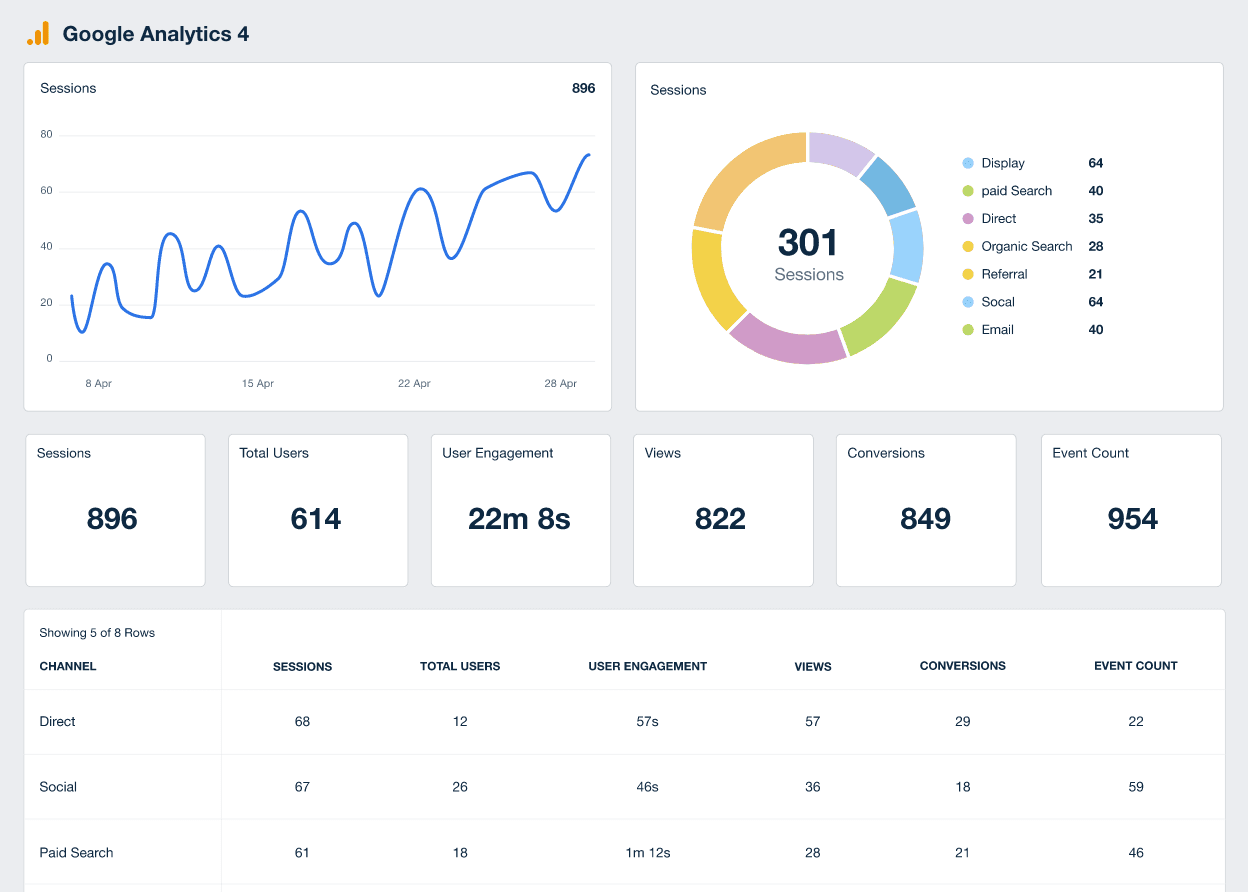
Track web analytics metrics like DAU, WAU, and MAU alongside data from more than 80 marketing platforms. Use the Google Analytics 4 integration to segment by channel and determine what’s driving traffic and conversions. Try AgencyAnalytics free for 14-days.
Feature Adoption Rate
This is a percentage that tells product-led businesses which features new users engage with the most, a strong leading indicator of customer success.
To Measure:
To calculate feature adoption rate, use the following formula:

Monthly Recurring Revenue (MRR) and Annual Recurring Revenue (ARR)
A financial metric that quantifies a business's predictable income from subscriptions or ongoing services, typically on a monthly (MRR) or annual (ARR) basis.
To Measure:
MRR is the sum of all fees paid every month by subscribers or users of a service. This could include subscription fees, retainer fees, or any other consistent monthly customer payments.
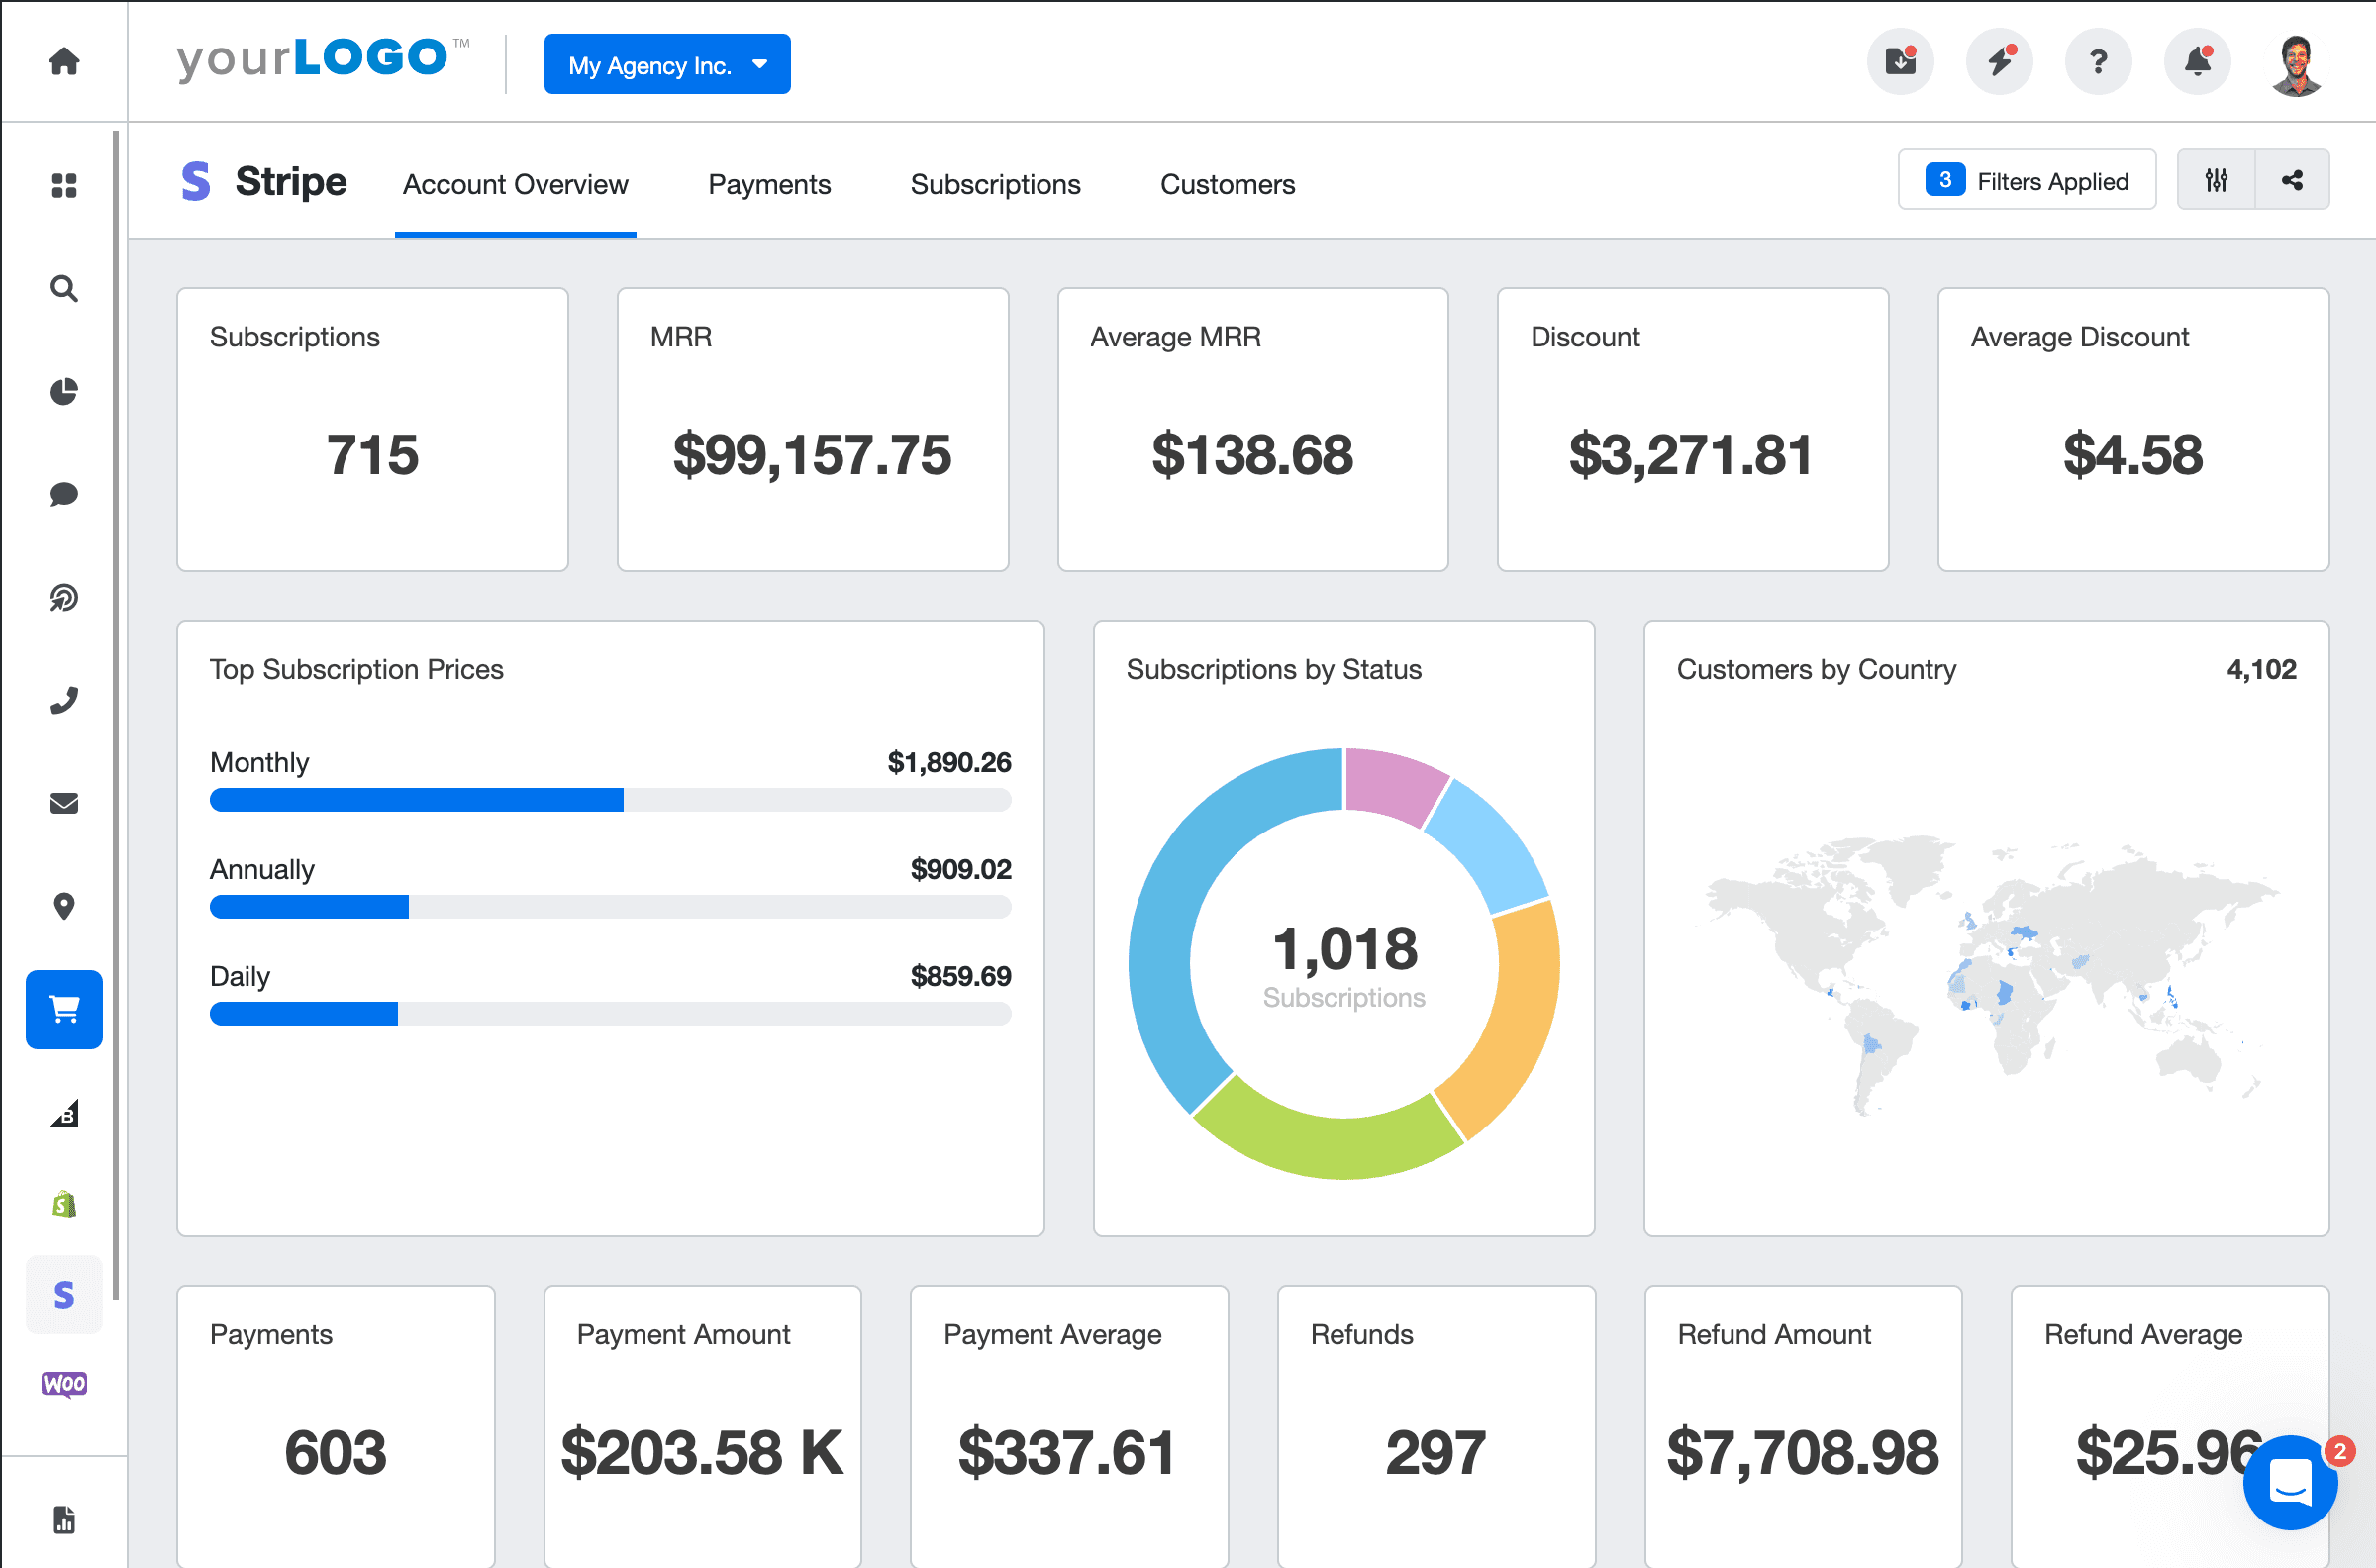
Use the Stripe integration to consolidate your clients’ payment and revenue data into a visually appealing report or dashboard. Track new customers and subscriptions to clearly demonstrate increases in MRR and ARR. Try AgencyAnalytics free for 14 days.
Expansion Revenue
Expansion revenue indicates the amount of revenue generated through customer add-ons and upsells.
To Measure:
Begin by determining the time period for which you’d like to understand the expansion revenue. Next, add all the revenue generated from upsells, cross-sells, and add-ons at the beginning of the time period, and subtract it from those same numbers calculated at the end of the time period.
Average Revenue Per User (ARPU)
ARPU indicates how much value one user provides by measuring revenue over a specific period.
To Measure:
Divide monthly recurring revenue by the number of users.
Customer Lifetime Value (CLV)
CLV is used to pinpoint which customer segments are most valuable. It shows product-led businesses the amount of revenue a single user may bring in over their account’s lifetime.
To Measure:
Multiply customer value by the average customer lifespan.
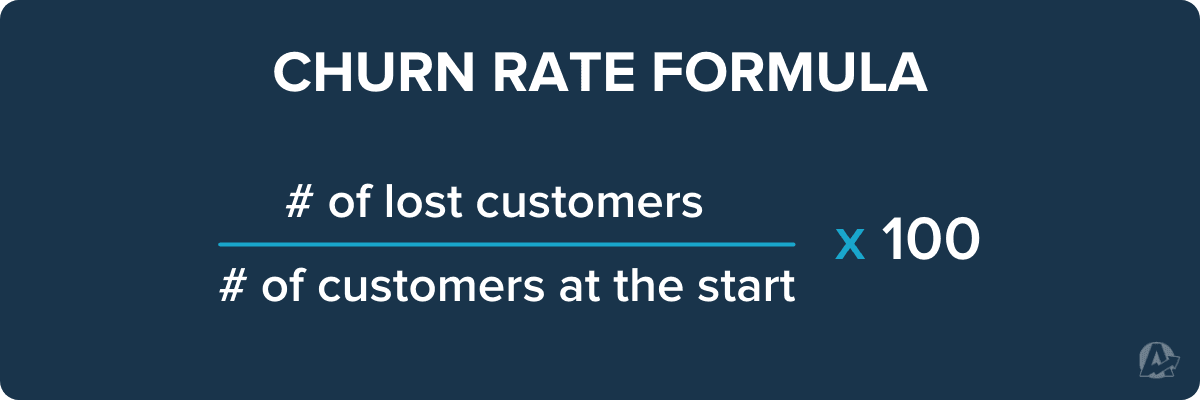
Churn Rate
The percentage of customers a SaaS business loses over a set period of time, typically monthly, quarterly, or annually.
To Measure:
To calculate Churn Rate, use the following formula:
Net Revenue Churn
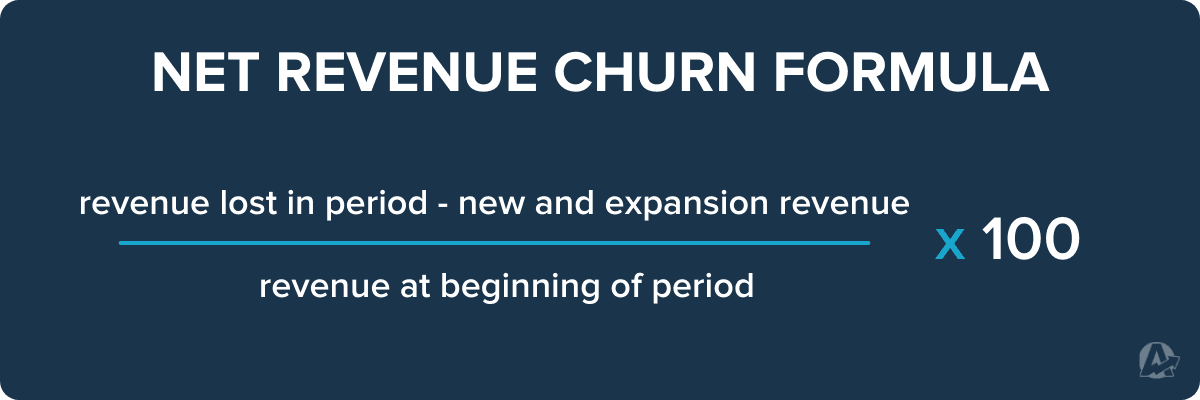
Net revenue churn shows how much money was lost during a certain period after calculating new revenue and expansion revenue.
To Measure:
To calculate net revenue churn, use the following formula:
Net Revenue Retention
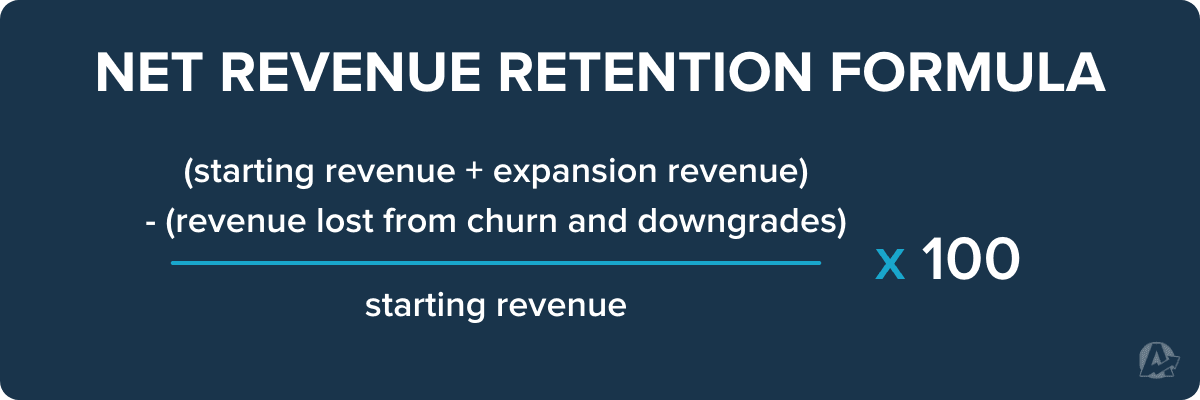
This metric measures how much revenue was earned aside from new revenue, expansion revenue and net revenue churn. Net revenue retention is different from gross revenue retention, which focuses focuses solely on the retention of existing revenue streams.
To Measure:
To calculate net revenue retention, use the following formula:
Customer Satisfaction Score
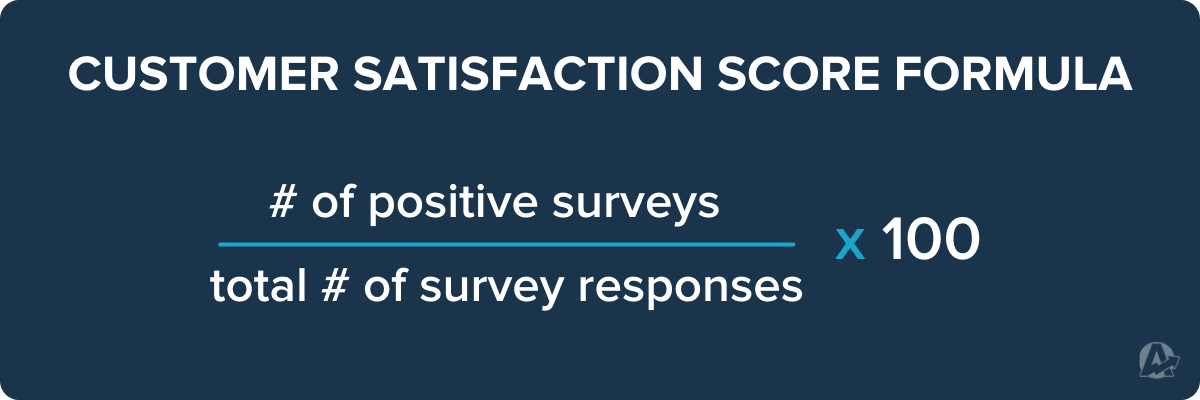
Customer Satisfaction Score is a good way to gauge how many users have had a positive experience with a product.
To Measure:
To calculate customer satisfaction score, use this formula:
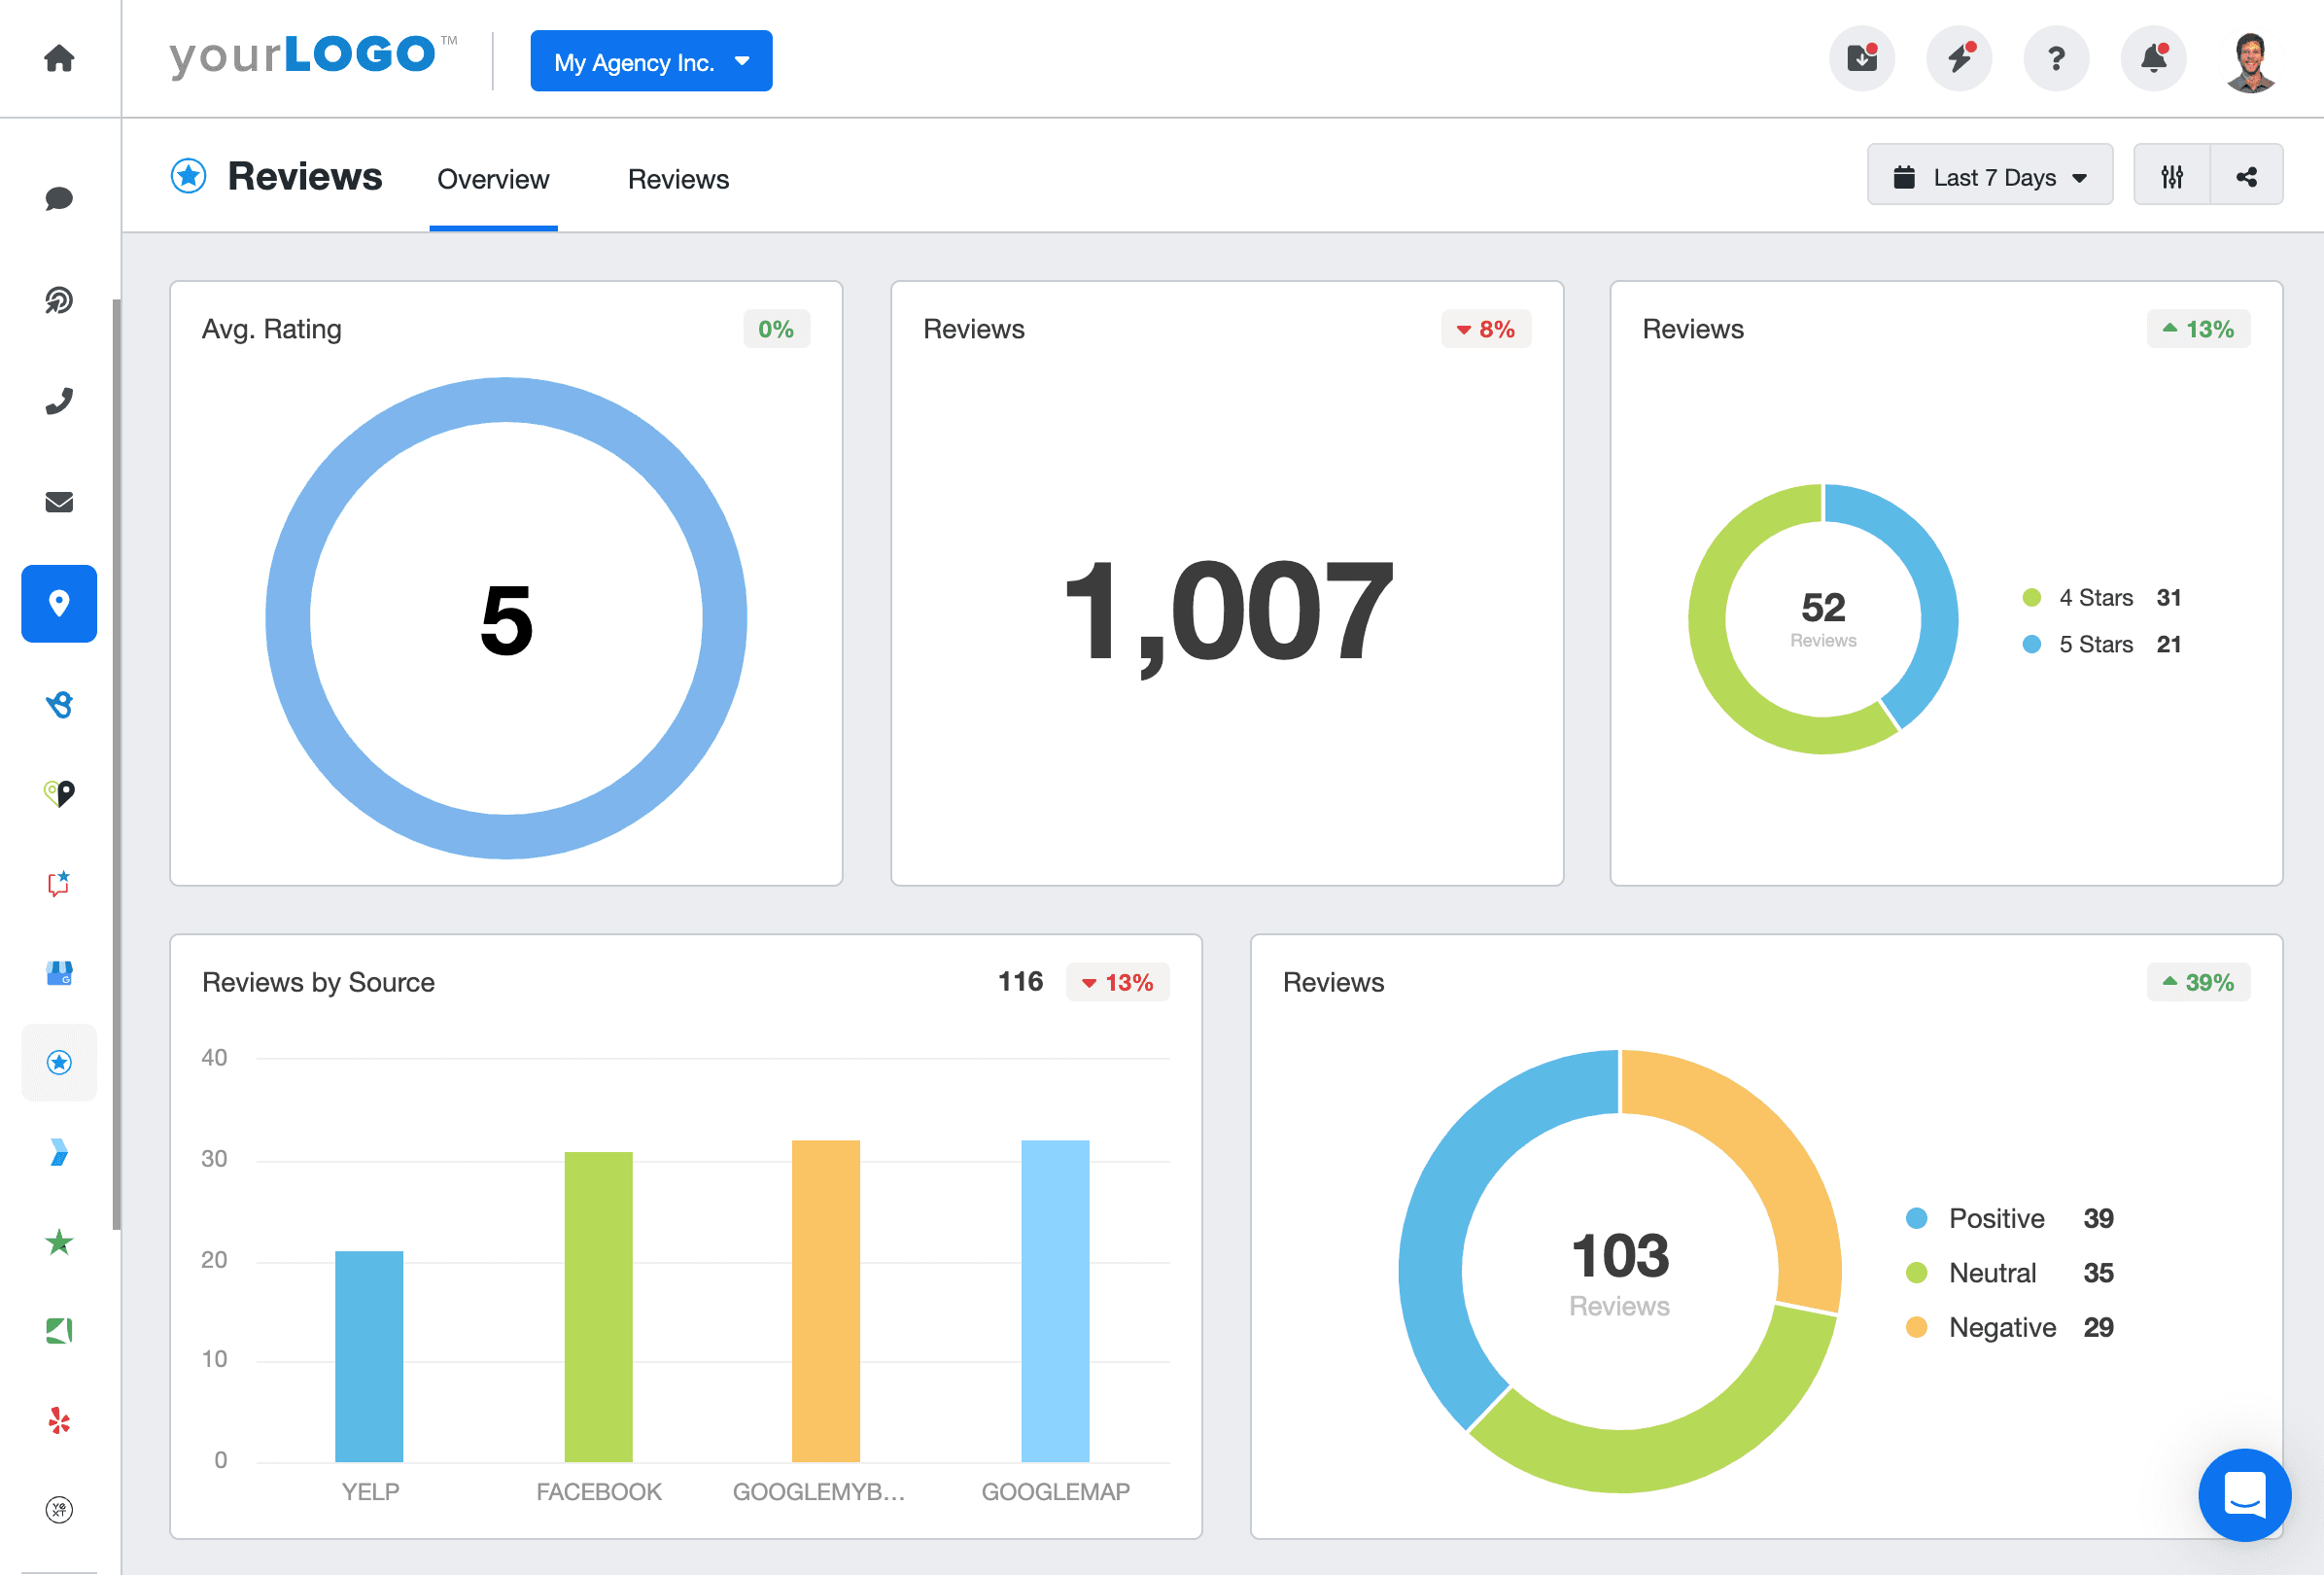
Monitor your client’s reputation management with a Grade.us dashboard. Keep track of customer sentiment and live reviews in real-time. Try AgencyAnalytics free for 14 days.
Net Promoter Score
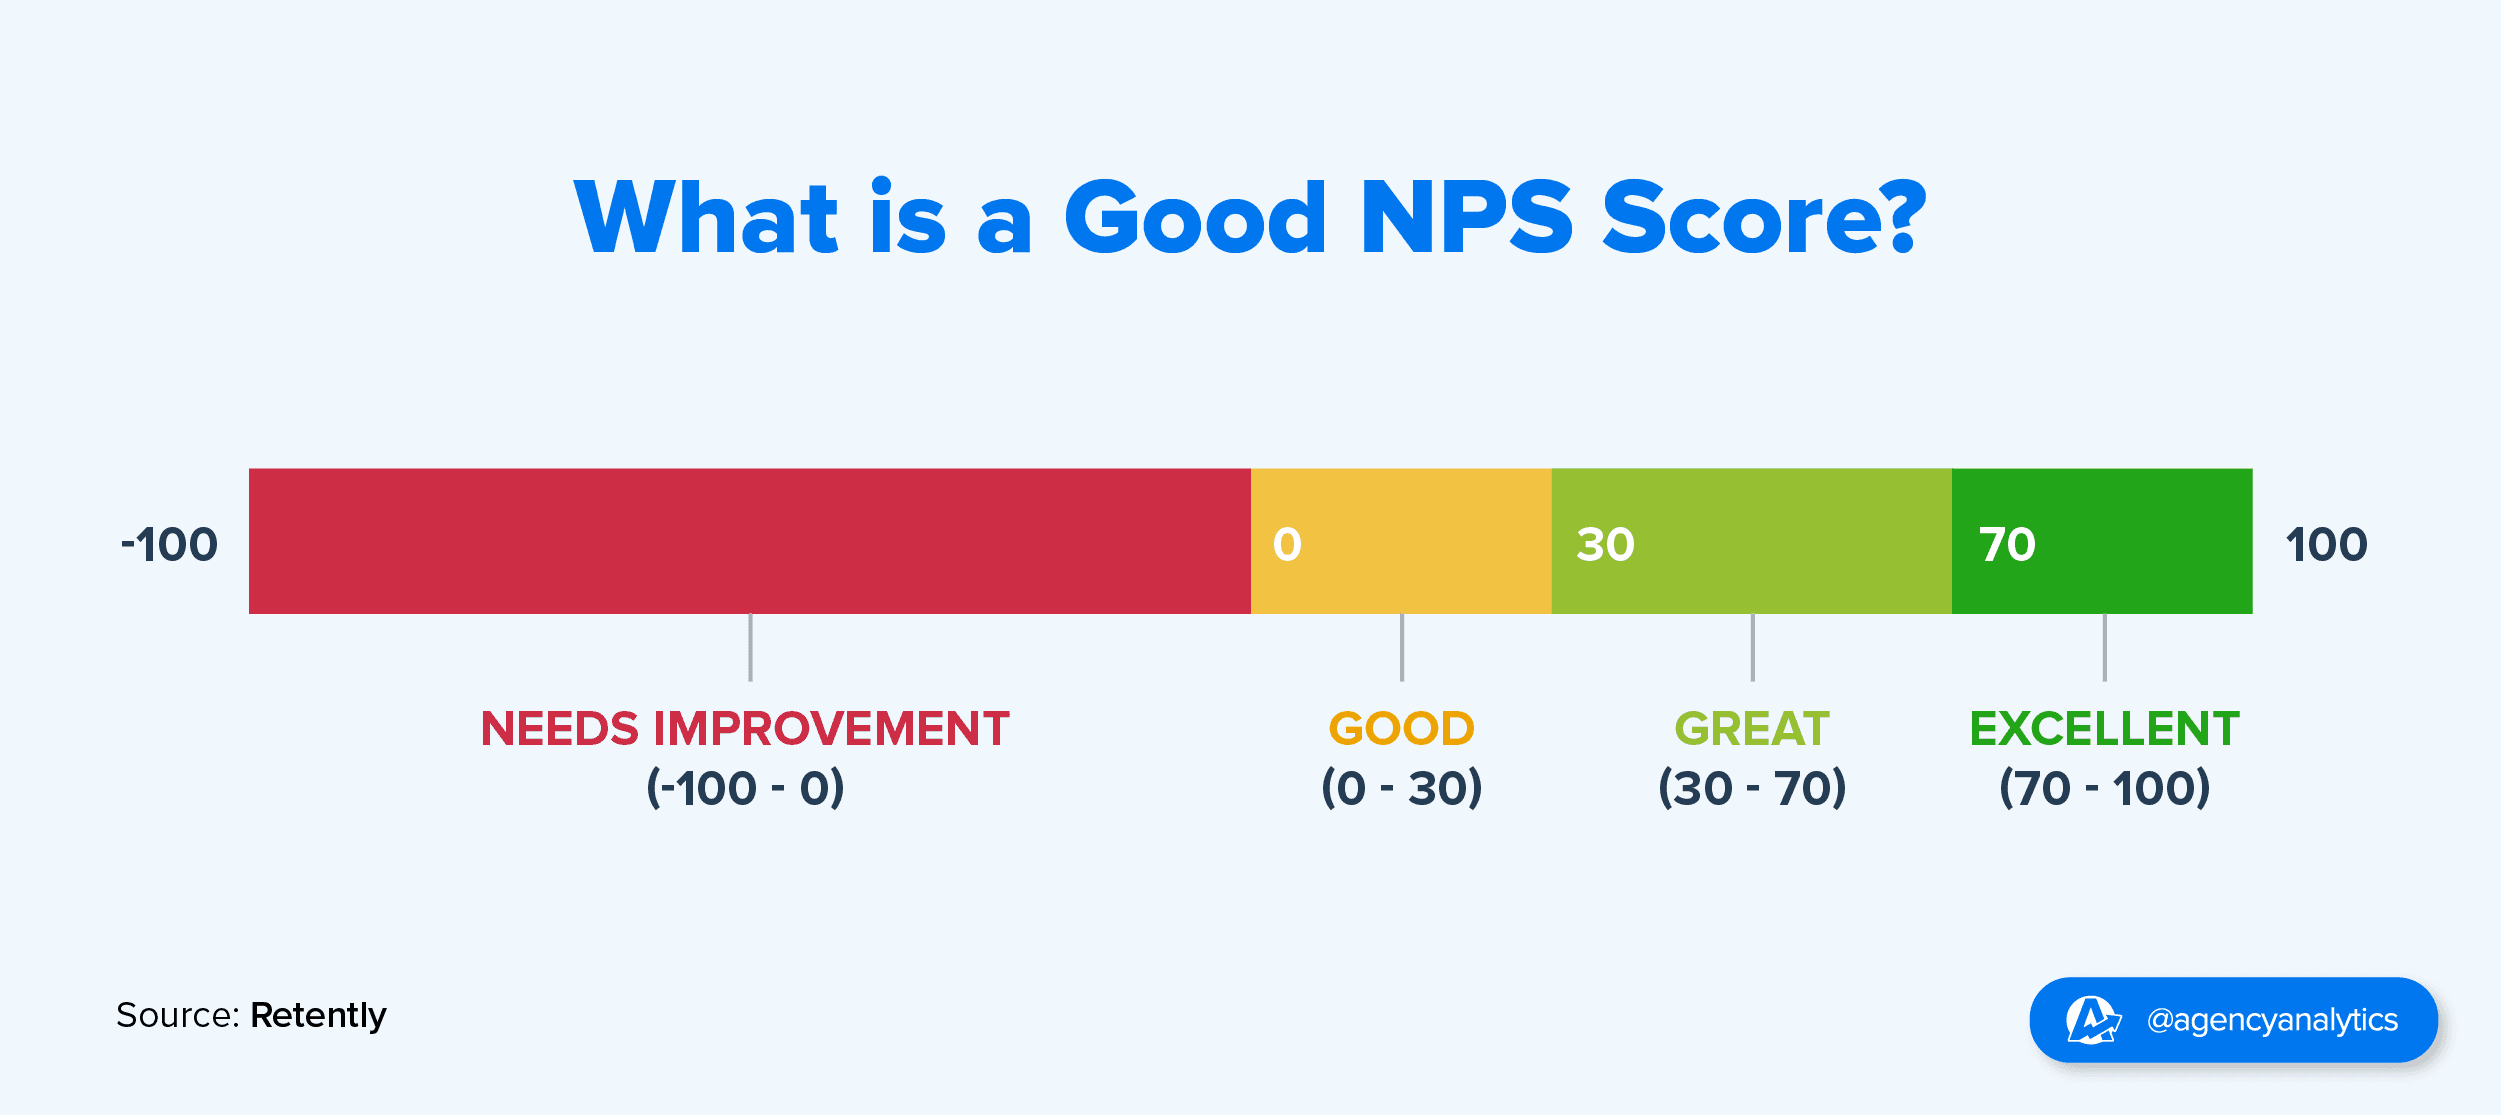
Net promoter score (NPS) gauges customer loyalty and overall satisfaction based on how likely the user is to recommend the client’s products or services, usually on a scale of 1 to 10.
Reviews are what sell new business. They are vital when customers are making a decision. Without reviews, prospects don't know whether they should trust you or not. Positive reviews make your potential customers feel "warm and fuzzy" about choosing your business out of the pack. Even professional responses to negative reviews can convince a prospect that your company is the one they want to work with.
Anya Curry, Owner, Ambidextrous Services
To Measure:
Net Promoter Score is calculated by subtracting the percentage of customers who are detractors (rating 0-6) from the percentage of promoters (rating 9-10). Those giving a score of 7-8 are considered passive and excluded from the calculation. This results in a score ranging from -100 to 100.
Virality
This measurement tells you if your client’s product has reached a point where users have started sharing their experience, causing the rate of adoption to increase significantly.
To Measure:
Determine the K-factor, which is the measure of how many existing customers refer to the product. Then, multiply that number by the conversion rate.
Network Effects
This is more of a phenomenon than a metric, but it can still be measured. It’s when a product’s value increases as adoption rate increases.
To Measure:
There isn’t one universal way of measuring the network effect, but some measurements will give you a better idea of where your client’s product stands. These include user growth rates, user engagement, conversion and retention rates, and market share dominance.
Trial-to-Paid Conversion Rate
This metric is used to gauge how many freemium or free trial users convert to paid subscriptions.
To Measure:
Simply track the number of users that converted from your client’s free option in a given period.
Integrating Product-Led Growth Strategy With Overall Marketing Metrics
Integrating a Product-Led Growth strategy ensures that all aspects of a client’s strategy–from product development to marketing efforts–work in harmony, driving consistent and sustainable growth. Aligning Product-Led Growth with traditional marketing metrics like SEO and PPC, leveraging synergies between product development and marketing, and building a unified brand message are all activities that are key to this process.
Aligning Product-Led Growth With SEO and PPC Metrics
SEO Metrics: Optimizing a Product-Led Growth strategy with SEO involves using organic search data to inform product development. It includes tracking keywords that potential users might use to find solutions that the product addresses. By aligning product features and content with user search intent, companies improve organic search visibility and attract more qualified users.
PPC Metrics: In a Product-Led Growth approach, PPC campaigns should focus on highlighting the unique aspects of the product. Conversion metrics from PPC provide insights into which product features resonate most with users, helping to refine the product and the targeting strategy for ads.
Synergies Between Product Development and Marketing Efforts
Feedback Loop: Integrating product development with marketing entails using customer feedback from marketing channels to inform product improvements. Marketing analytics reveal how users interact with the product, guiding development teams to enhance user experience.
Unified Strategy: Marketing teams use insights from product usage to tailor their strategies, ensuring that the marketing efforts are fully aligned with the product’s strengths and user preferences.
Building a Cohesive Brand Message Around the Product
Consistent Messaging: The brand message should be consistent across all platforms, reflecting the core values and unique selling propositions of the product. This consistency reinforces the product’s position in the market and in the minds of the consumers.
Product as the Centerpiece: In all marketing communications, the product should be positioned as the solution to the customer’s needs. This approach ensures that the product remains the focal point of all marketing efforts, strengthening the Product-Led Growth strategy.
Integrating Product-Led Growth strategy with overall marketing metrics creates a synergy that amplifies the impact of each component. By doing so, agencies ensure that their campaigns and strategies drive continuous growth and market relevance for PLG-led clients.
Tips for an Irresistible PLG Client Report
While metrics are an essential part of any report, they don’t give a full picture of client success on their own. Simply compiling a spreadsheet full of percentages won’t wow your clients–on the contrary, it might just put them to sleep.
There’s nothing worse than spending countless hours creating PLG marketing strategies, executing the creative, tracking success, compiling a report, and then realizing that your client hasn’t even taken the time to open it.
Enter AgencyAnalytics. Effortlessly compile data from more than 80 marketing platform integrations, create visually engaging graphs and charts to clearly demonstrate trends, grant custom user permissions, and track your client’s open rates–all with just a few clicks.
AgencyAnalytics’ intuitive annotations and goals feature allows agencies to add context to the metrics they’re tracking by including personalized notes and trackable goals that show progress, highlight wins, and create transparency.

By combining metrics in your client report, your agency will easily demonstrate how a specific marketing campaign, web page optimization, or content strategy directly led to increases in the key PLG metrics we’ve explored–like trials to conversions, Time to Value, and Daily, Weekly, or Monthly Users.
Mastering the Balance Between Marketing and Product-Led Growth Metrics
Mastering the balance between Product-Led Growth metrics and traditional acquisition metrics is more than just a strategy–it's an art.
The key takeaway is clear: To provide clients with a comprehensive picture of your agency’s efforts, it’s important to track and interpret the metrics and KPIs that bridge the gap between marketing and product growth. This dual focus allows for a holistic understanding of how the product and effective acquisition strategies contribute to sustainable growth and customer retention.
By embracing this integrated approach, agencies sharpen their competitive edge and empower their clients with deeper insights, leading to more informed decisions and effective strategies.
Sign up for a 14-day free trial and start creating top-tier customer reports for your PLG clients today.

Written by
Rita Poliakov is an experienced content writer with a knack for storytelling. As a former journalist, she's a skilled researcher, interviewer, and grammar nerd.
Read more posts by Rita PoliakovSee how 7,000+ marketing agencies help clients win
Free 14-day trial. No credit card required.


