Table of Contents
QUICK SUMMARY:
Marketing agency profitability, a measure of financial success, depends on generating revenue that surpasses operational costs. Essential for long-term viability in the competitive field, it involves efficient client management, effective campaigns, strategic planning, and cost control. This article delves into strategies to maximize agency profits, addressing profit margins, client relationships, and implementing effective profitability strategies.
Let's face it: running a marketing agency isn't for everyone. The high-pressure responsibilities you manage, combined with a significant investment of time and money, don't always guarantee a healthy bottom line—even with a higher cash flow.
Sometimes it takes years to get become a profitable business for you to step aside and take a breather. 🏝️🍹 Meanwhile, the proven strategies that help boost agency profits and maximize revenue are just waiting to be implemented.
In this article, we'll discuss key factors that determine agency profitability along with practical strategies to optimize your revenue to succeed in this competitive industry. What's your agency profitability number? How do you assess whether a client project you take on is worth it?
Read on to find out.
Benchmarking: How Much Profit Should An Agency Earn?
Everyone wants to have a profitable agency, but without a solid understanding of your financial health, you can’t know whether a new project you’re taking on is profitable or not. As Maryn Williams, COO of VIEWS Digital Marketing, notes, “the biggest challenge is balancing the needs of the client with the need to generate profit which is not always in sync.”
So how do you put a number to your success to quantify your profitability targets and achieve your goals? Enter the delivery margin. If you haven’t already, check out the article on marketing agency delivery margins where Parakeeto’s CEO Marcel Petitpas explains how to calculate that golden metric to unlock your agency’s profitability potential.👇
As a recap:
Delivery Margin = (AGI - Delivery Cost) / AGI
Agency Gross Income (AGI) is your revenue after subtracting any expenses for outsourcing work to external vendors. This includes costs like printing budgets, white label partners, or ad spend needed to satisfy client demands.
On a per-client project basis, your delivery margin should be between 60-70%. Meanwhile, agency-wide, a number between 50-60% is considered healthy. Keep in mind that these numbers apply more for mature agencies and may not always be possible for a new agency that’s working to attract its first clients and has not yet streamlined all of its processes.
Want to assess whether your current profit margins are up to par or make changes to your pricing? Use this calculator to help you make smarter decisions and integrate financial decisions into your client projects. Just make a copy of the Google spreadsheet below and plug in your numbers!
Revenue Maximization vs. Profit Maximization
While maximizing revenue and profit are both important goals for agencies, they are two sides of the same coin. Pun intended.
Revenue Maximization: All Take and No Give?
Revenue maximization (or sales maximization) is a business strategy that focuses on generating as much revenue as possible, regardless of the costs involved. This approach is often used by agencies that are looking to grow quickly and gain market share or by those that operate in highly competitive niches where profit margins may be thin.
You can increase your agency’s revenue by:
Increasing your agency pricing
Expanding into new markets
As your agency scales, it's only natural to focus on bringing in more revenue year after year. But with growth comes increased expenses–making it a real challenge to keep your profitability on track.
Sometimes, an agency might take on a less profitable client with the knowledge that they will bring in more revenue down the road:
Revenue can trump profit if the client has good upsell potential. If we choose this situation, our goal is to get a relationship going, build trust and proof of work, then the upsell potential for more services and better profit is there.
Greg Hoffman, Co-founder of Get Found Fast
Other areas where the desire to generate revenue may trump agency profitability include:
Entering a new niche where your agency has less experience
Expanding into a new geographic market, where marketing costs could be higher
Defending against new competitors in the market
Special projects to drive agency visibility
A new and aggressive growth target for the agency
A need to generate positive cash flow in the short term
For example, you may decide that you want to expand your agency into another city. To do so will require a higher initial investment, such as buying an existing agency, acquiring office space, marketing spending to promote your agency in that new location, local events, and more.
During that expansion period, revenue maximization could easily take priority over profit maximization, but that should only be short-term. As a result, many agencies opt for a more balanced approach that focuses on both revenue growth and cost management to maximize overall profitability. This brings us to our next point.
Profit Maximization: It's a Give and Take
Profit maximization considers both revenue and costs to generate the highest possible profit (including gross profit margin and net profit margin). The goal is to maximize the difference between revenue and expenses, aka, your bottom line.
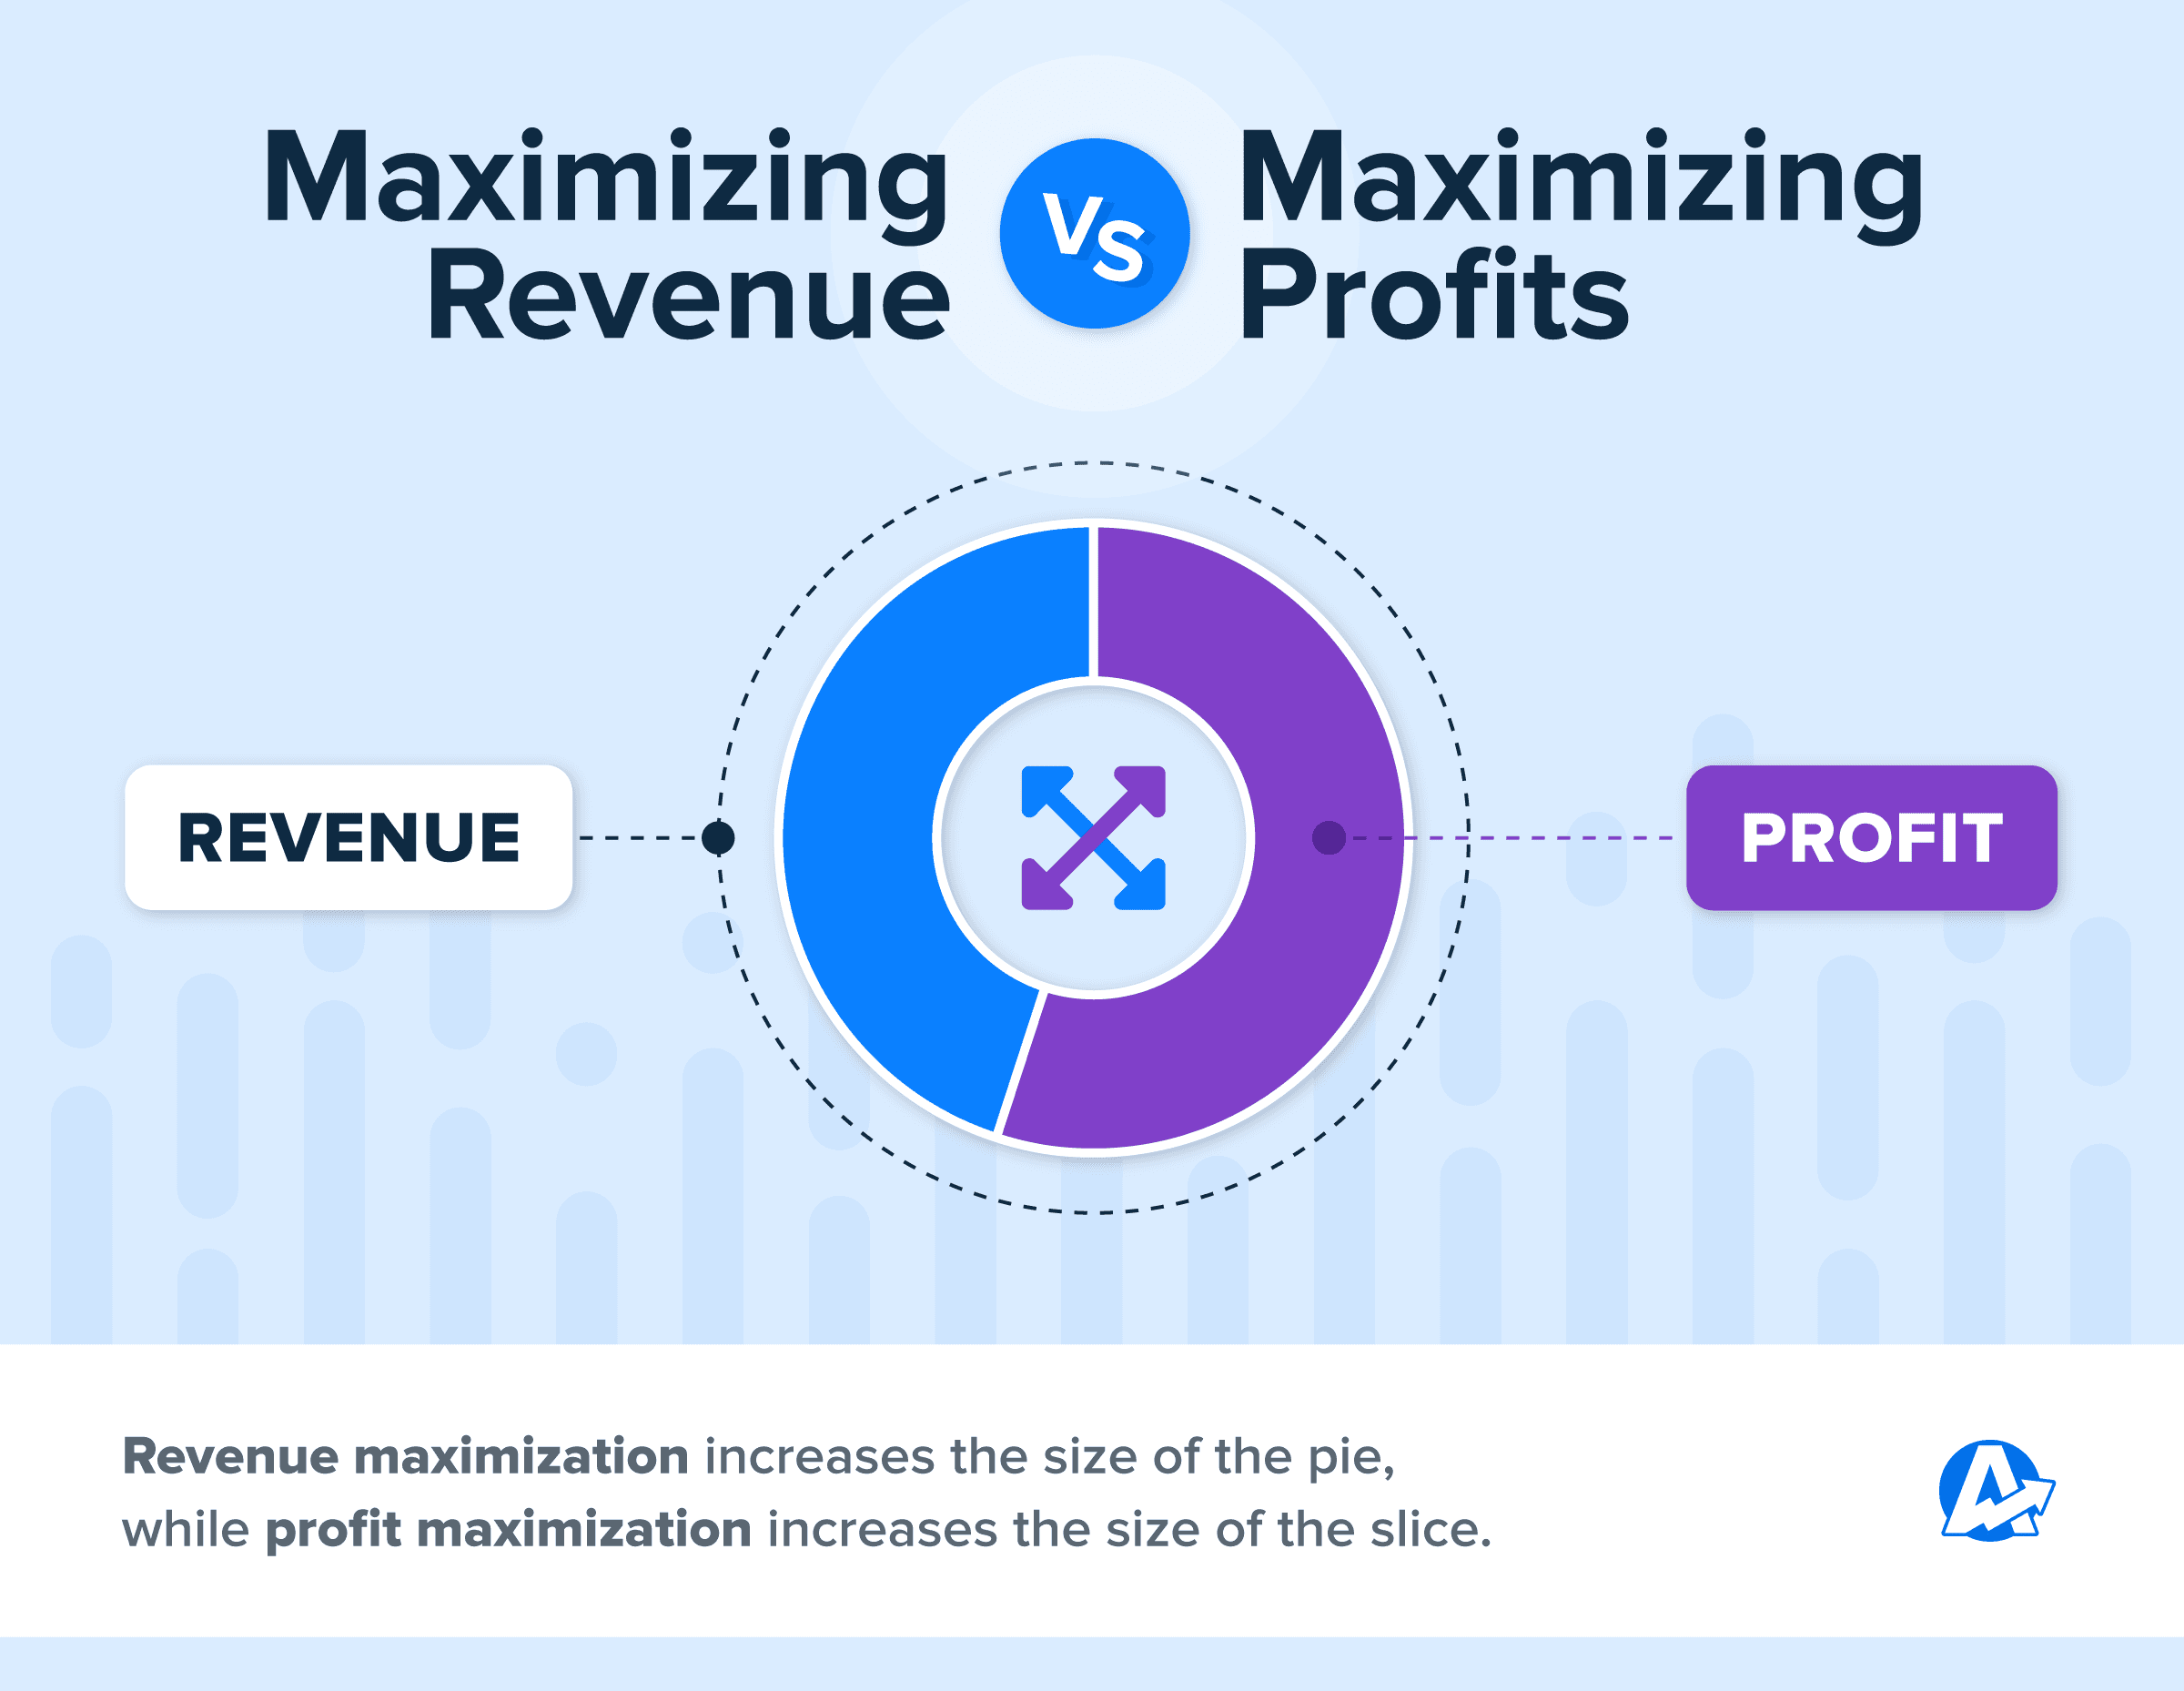
So while revenue maximization may lead to increased sales, it may not necessarily lead to increased profits if the costs of generating that revenue are too high. In essence, revenue maximization aims to increase the size of the pie, while profit maximization aims to increase the size of the slice.
Which is Better?
Maximizing your revenue and your agency’s profitability are both important goals. While revenue may take priority over profits for short bursts during an agency’s lifecycle, ultimately, profit maximization takes the cake. It’s the more sustainable and long-term approach, as it considers both revenue and expenses, ensuring that the agency is generating a healthy profit margin with fewer losses.
Let’s take a closer look at the pros and cons of each model.
Revenue Maximization Strategy Pros and Cons
Pros | Cons |
|---|---|
Easier to calculate | Doesn’t take into account expenses |
Maximized in the shorter term | Unsustainable over the long term |
Can be achieved faster | Increasing revenue doesn’t equate to more money in the bank |
Profit Maximization Strategy Pros and Cons
Pros | Cons |
|---|---|
Takes into account the bigger picture | Harder to calculate as profit can be ambiguous (i.e., are you calculating on gross profit, net profit, or profit before tax) |
More sustainable long-term approach | Takes longer to achieve |
Equates to more money in the bank | Doesn’t take risk into consideration (If an agency doesn’t take risks, it may never grow) |
There is a detriment to being a little bit too risk-averse, and maybe I needed more of a balance between making more investments into the company versus making sure we're cash positive.
Dan Delmain, Founder of :Delmain
As you can see, neither strategy is necessarily deemed better than the other. It’s about striking a balance between your long-term and short-term goals for your agency and depends on additional factors such as:
Your current agency margins
Stakeholders’ expectations
Running expenses and the structure of your agency
How efficient your agency processes are
How long has your agency been in business, and the stage you’re at in the agency life cycle
You cannot get profit without revenue, but the importance of one over the other depends on the growth stage of the agency. At first and in high growth periods, you may have to focus on revenue over profit to get to scale. But at some point, the focus has to shift to profit to stay viable.
Maryn Williams, COO of VIEWS Digital Marketing
11 Ways To Maximize Your Agency Revenue and Profits
Let’s explore how agencies can improve their profit margins by tackling their operations, boosting productivity, and reducing overhead costs.
1. Control Cost
If your goal is to grow your agency, you have to take risks and invest in your business. If you’re someone like me who has never seen a bad idea or like most founders who chase a shiny object when they see it, you’ll end up overspending before you know it.
Trevor Shirk, CEO & Founder of Terrayn Dispensary Marketing
Aside from keeping your CAC under control, “rising prices and increases to the cost of doing business combined with cutting deals and skittish business owners can be tough to juggle,” says Hoffman, Co-founder of Get Found Fast. Especially when you’re dealing with rising costs internally and the perceived slowing economy. This certainly makes managing client expectations challenging.
Add in the occasional crazy client requests which can put a drain on agency resources, and you’ve got a recipe for increasing your agency’s costs and putting your project’s profitability at risk.

So what do you do to maintain healthy profit margins? This takes some work from your account managers to navigate the situation and turn scope creep into upsell opportunities.
It can be tempting to simply bow to every demand, no matter how unreasonable it may be, just for the sake of keeping a client happy. However, this could lead to an unhealthy work environment for you and/or your employees—not to mention lost revenue. Striking that delicate balance between retaining clients while also protecting your business's values is often tricky but essential to success.
Michael Quinn, Founder of My Site Ranked
2. Assess and Reduce Operating Costs
While we're on the topic of saving money, let's briefly discuss the invisible costs that hurt your marketing productivity. When your teams are bouncing back and forth between many platforms, or your agency's internal communication isn't efficient and effective, you're wasting time. And those hourly costs really do add up.
That's why it’s important for agency owners to regularly assess their tech stack and invest in tools that automate agency processes, like automated reporting software, for instance. When you streamline repetitive tasks such as the data collection and entry required for client reporting, you end up saving administrative expenses and billable hours every month. Along with your agency's sanity.
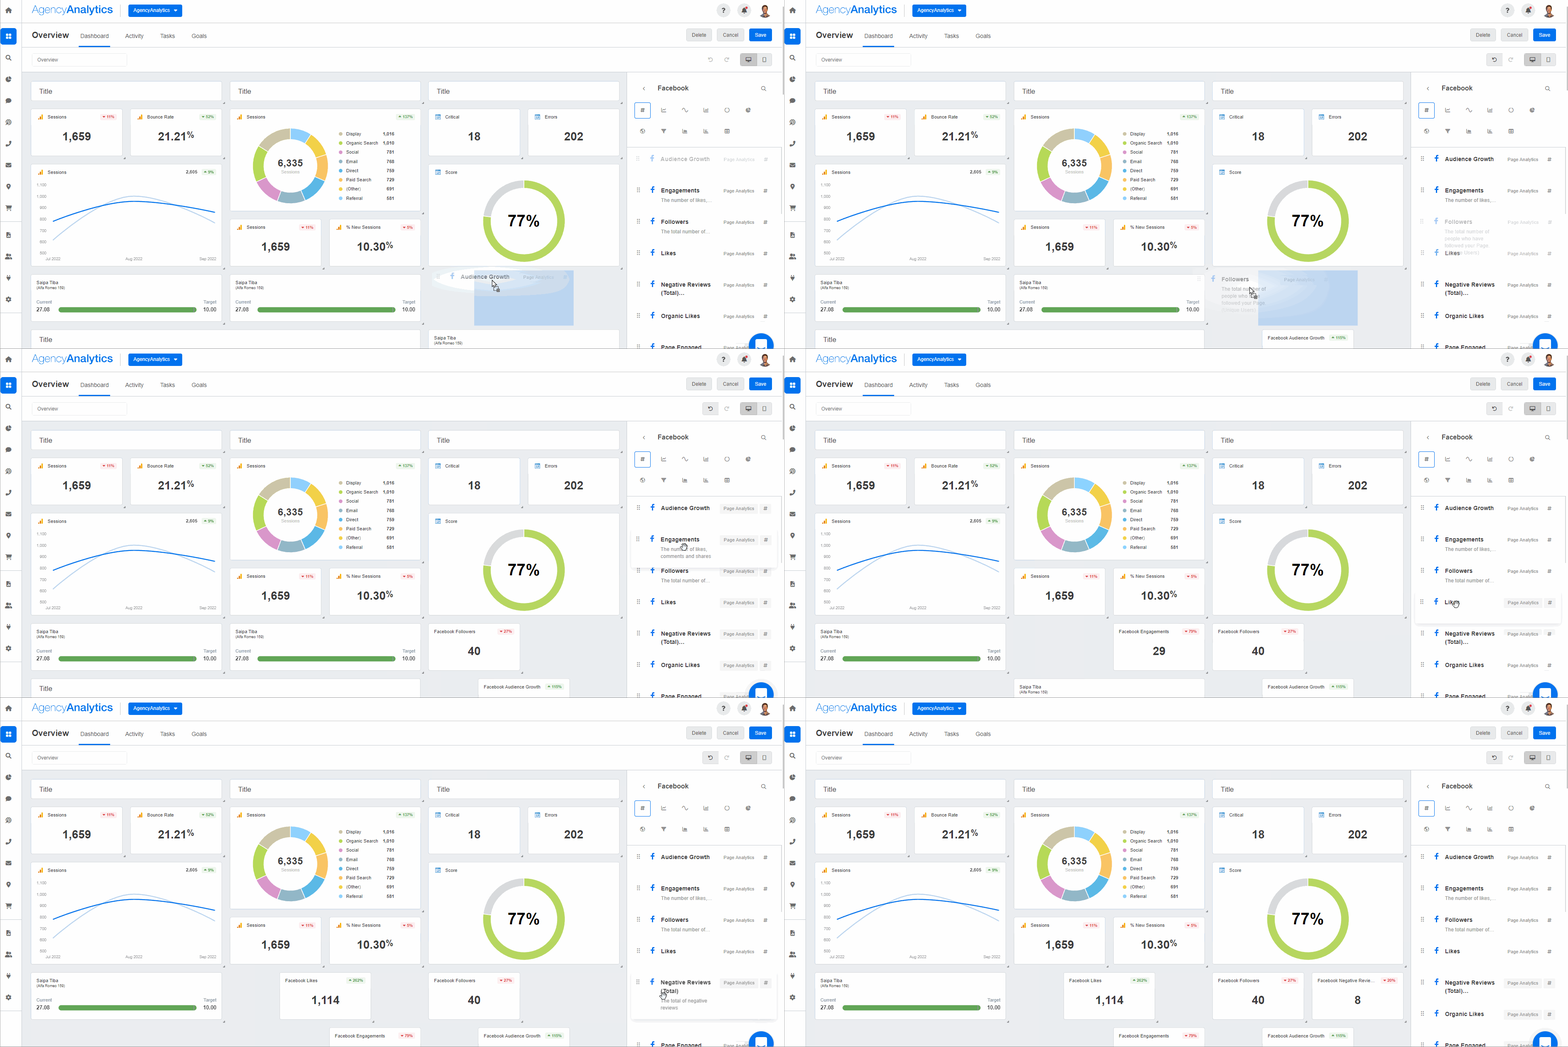
Win back billable hours by streamlining your client reporting. AgencyAnalytics integrates with 80+ marketing channels, pulling all your clients’ KPIs into one place. Try AgencyAnalytics free for 14 days!
3. Develop Scalable Processes and Services
Another productivity killer for a scaling agency is a lack of documented business processes. Ask three people in your agency how they go about completing a fairly standard task at your agency. If you get three different answers, you have a process issue. And, chances are, only one of the three will be the most efficient way to complete that task. Ineffective business processes increase delivery costs, which-in turn-reduce net profitability.
So tech stack aside, you need systems in place to not reinvent the wheel each time you get a new client. Here are some handy marketing SOPs & Checklists for agencies to easily onboard new teams or clients:
4. Improve Your Lead Conversion Rate
When you can keep a constant flow of leads coming into your organization, you can do amazing things. You can grow your team, you can increase revenue, you can achieve whatever goals you set.
Dan Delmain, Founder of :Delmain
One of the biggest challenges of growing a digital agency is getting new clients. But this is also one of the key ways to recession-proof your agency. After all, you cannot increase your revenue without a healthy number of varied clients in your portfolio.
The challenging bit is converting your leads into sales. To do that, you’ll need to reduce friction in the sales pipeline between the initial discovery phase and closing a deal.
We've invested a lot of time and money into figuring out which marketing channels attract the right type of clients at the lowest possible costs and at a predictable flow.
Dan Delmain, Founder of :Delmain
Here’s what to put into place:
A nurture stream that targets your highest-quality prospects with the right pain points
SOPs to create a streamlined sales process that is replicable
A powerful sales pitch deck to convince the potential client that your agency is their best bet for success
A follow-up process after your discovery meeting that builds upon your relationship with the prospect
A positive outcome is less about ticking boxes and more about setting the tone for the relationship going forward. If we've connected on a personal level with the client, shared our hopes and concerns around the project, and know what we both want from partnering together, we've done our job!
James Londesborough, Owner of Ignite Marketing
5. Simplify the Onboarding Process
Effective agency management and onboarding go hand in hand. Onboarding is an opportunity to build up a strong relationship, reduce friction, and bring everybody up to speed in less time.
Just as you onboard new employees to ensure smooth operations, it's important to onboard your clients as well since they are key external stakeholders.
Client Onboarding Tips
Create a standardized onboarding process that can be used for all clients. This will help to streamline the process and ensure that important steps are not missed.
Automate what you can, like emails walking them through the next steps to provide clear instructions on what information is needed from them and what steps they need to take during the onboarding process, and setting up their client reporting from day one.
Assign a dedicated onboarding team and communicate regularly. Having a team that specifically works with new clients during the onboarding process will ensure that clients have a single point of contact and that their questions and concerns are addressed promptly.
Use reporting templates to provide a consistent experience across multiple clients and significantly reduce the time required to set up a new client’s marketing reports.
Make client onboarding a breeze with AgencyAnalytics. Duplicate your favorite campaign settings to have all their marketing data in one visual dashboard. Try it free for 14 days!
6. Focus On Client Retention
It is 70% cheaper to keep an existing customer than it is to find a new one. While the ratio might be slightly different depending on the business model or vertical you’re involved in, the idea rings true in the agency world.
Jack Choros of Iron Monk
Client retention is key to saving agencies money in the long run. Besides, it’s a key indicator of client happiness. The longer a client stays, the better you’re doing your job.
Tracking client retention metrics and KPIs is crucial because it provides data-driven insights into customer behavior and loyalty, enabling businesses to make informed decisions to improve customer satisfaction scores, reduce churn, and ultimately increase profitability.
See how you can retain clients with clear communication via reports here in the webinar below. 👇
7. Hire the Right People
The biggest contributor to our growth is our people. We bring on smart, driven, and talented individuals who align with our north star of helping people feel proud, prosperous, and connected. We’ve grown from a small agency of 3 full-time staff to nearly 65 (and growing) while helping more than 600 clients with their marketing each month.
Jessica Weiss, Director of Marketing & Strategic Partnerships, One Firefly
It goes without saying that your agency’s services are only as strong as your team. And the “right people” help drive agency profitability as they stay on board and build upon their experience. Talent retention is key to your long-term success. Ensure you’re rewarding and recognizing high-performers at your agency with:
Growth Incentives
Profit Sharing
Commissions
Fixed Overrides
Another thing employees look for when joining a company is flexibility with the opportunity to work remotely, as well as growth potential within the organization. So be sure to attract and nurture entry-level talent to improve your agency culture as you scale.
As long as you iterate on your processes and gain teachable moments, you’re on the right track:
You’re going to make mistakes like hiring the wrong people or investing in the wrong tech, but that’s just part of the game.
Trevor Shirk, CEO & Founder of Terrayn Dispensary Marketing
8. Adjust Your Utilization Rate
Agency utilization rate goes hand-in-hand with marketing productivity. It’s the amount of time an employee spends focused on client-facing projects vs. their total contracted working hours.
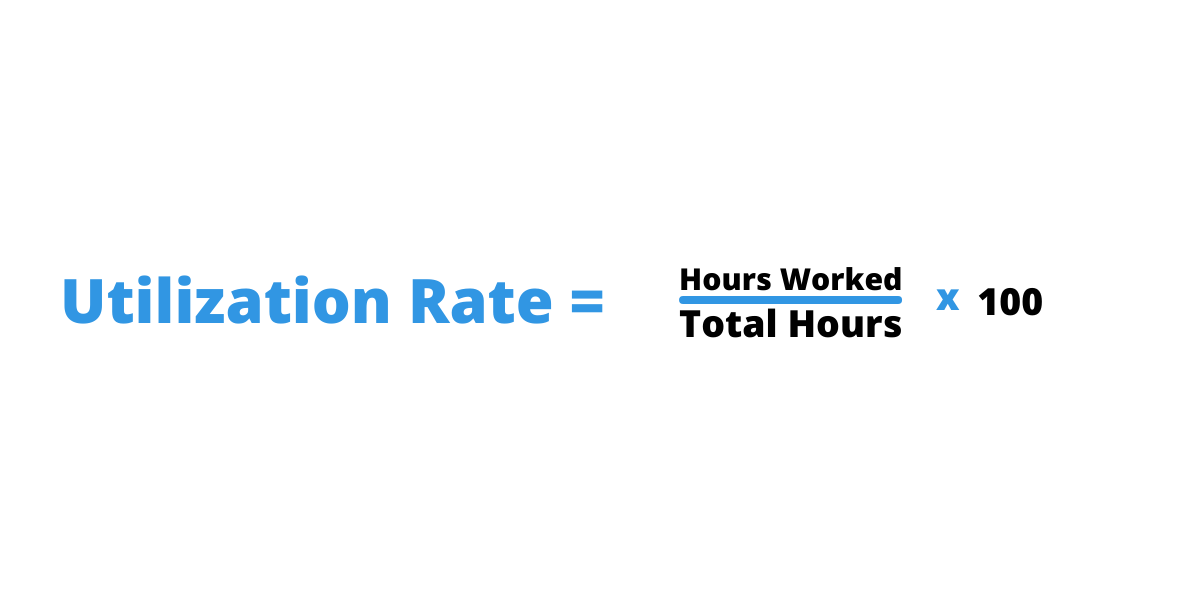
Ensure that your agency is productive but not too lean–too high utilization rates can cause burnout, so you’ll want to be in the 85%-90% range to leave some breathing room. Any less, and you'll need to check on your productivity.
9. Update Your Pricing
You need to know your costs before you set your price. If you can bundle services, you can price things to look more attractive, which encourages revenue. But in the end, each client needs to be profitable, in our opinion.
Greg Hoffman, Co-founder of Get Found Fast
The right pricing strategy can be one of the easiest ways to improve your agency’s profit margins. But sometimes, pricing can be a point of contention during the negotiation stages. “Maximizing revenue comes from asking a lot of questions to find out where the client is coming from,” says Greg Hoffman, Co-founder of Get Found Fast. “More answers to good questions gives us the insight to price it where we win the business.”
We maximize profits by aggressive cost control, having clearly established expectations of clients and employees, and increasing the sales of the most profitable products and services.
Maryn Williams, COO of VIEWS Digital Marketing
Meanwhile, you need to ensure that when you’re onboarding a client, you’re not underselling yourself or making promises you can’t deliver:
We point out that the arrangement has to be mutually beneficial and increase our prices to include the cash-chasing time, time answering low-trust queries, etc. Also, while we always try to under-promise and over-deliver, we take this to extremes once we pick up a client who is a 'toxic' type.
Daniel Noakes, Founder at UClimb
10. Focus on an Industry Niche
Digital marketing is a vast market. And finding the right niche for your agency is a surefire way to streamline your processes and become true experts in your field, offering higher pricing for better services.
Having a niche also increase your referrals, decreasing your CAC:
While digital agencies often think that they should be utilizing digital, we have found that when your market most needs your services, and you have developed a good reputation, you don't need to do a lot of marketing. This does not mean there isn't a place for it, but your number one lead source should be referrals. If it's not, you're doing something is wrong.
AudSEO
11. Launch New Revenue Streams
Effectively managing your revenue streams ties into all the points mentioned above. But when it comes to launching new ones, you’re faced with either opening up your service offering to reach more prospects or upselling your existing clients.
To do this, identify logical points where your agency’s services are needed and have a handle on your clients’ data to identify upsell opportunities. For instance, you might not necessarily manage their SEO, but sending clients automated Rank Tracking reports instantly identifies an area of need. And when your client reporting platform is robust, you can build a professional SEO proposal in minutes using a pre-built proposal template.
Takeaway: Make Smarter Decisions Through Data Analytics
Profit equals growth. 📈 As a marketing agency, you play a critical role in helping your clients succeed, but it's equally important to focus on your own business’ profitability.
The tricky part is knowing all your numbers to be able to make accurate calculations. When you have a clear picture of your numbers, you'll be well-equipped to drive your agency's growth and profitability.
Take the time to evaluate your business and make the necessary changes to ensure that your agency is operating at its fullest potential and allowing your clients’ businesses to thrive.
Know your numbers. Bake profit maximization into your operations to achieve long-term success.
Implement the right systems and strategies to streamline your processes to identify new revenue streams and reduce overhead costs.
Focus on quality over quantity. Retain your best talent with incentives and improve client retention with targeted communication.
And there you have it! Assess your agency’s stage and growth goals, and evaluate whether it’s right to do a revenue-first or profit-first approach.

Written by
Melody Sinclair-Brooks brings nearly a decade of experience in marketing in the tech industry. Specializing in B2B messaging for startups and SaaS, she crafts campaigns that cut through the noise, leveraging customer insights and multichannel strategies for tangible growth.
Read more posts by Melody Sinclair-BrooksSee how 7,000+ marketing agencies help clients win
Free 14-day trial. No credit card required.


