Table of Contents
QUICK SUMMARY:
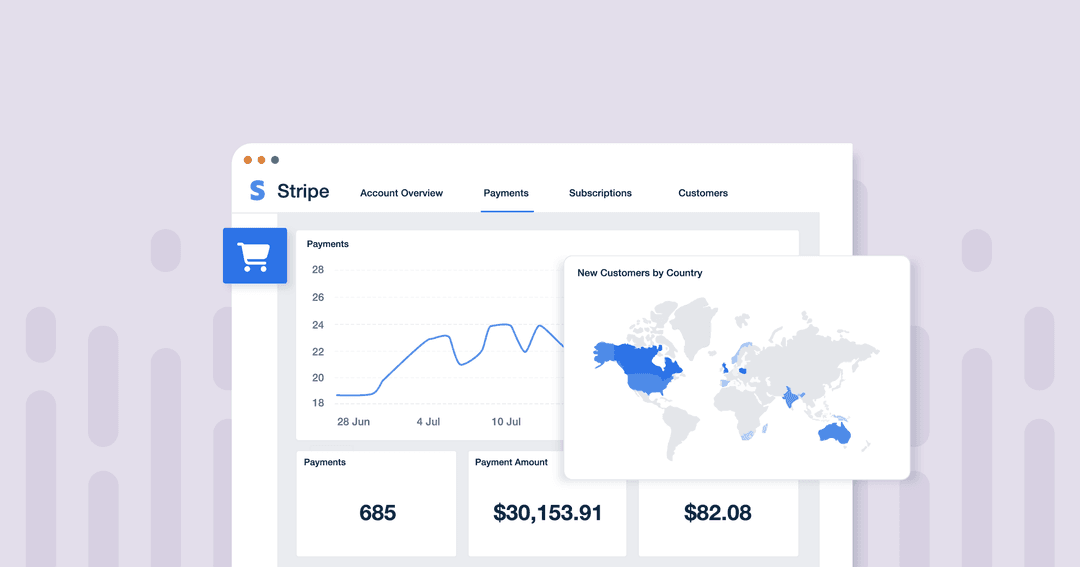
Stripe analytics offers valuable insights into ecommerce performance, tracking online sales, customer spending, and revenue growth. This guide explains how to create a Stripe analytics reporting dashboard, showcasing marketing ROI and optimizing client campaigns.
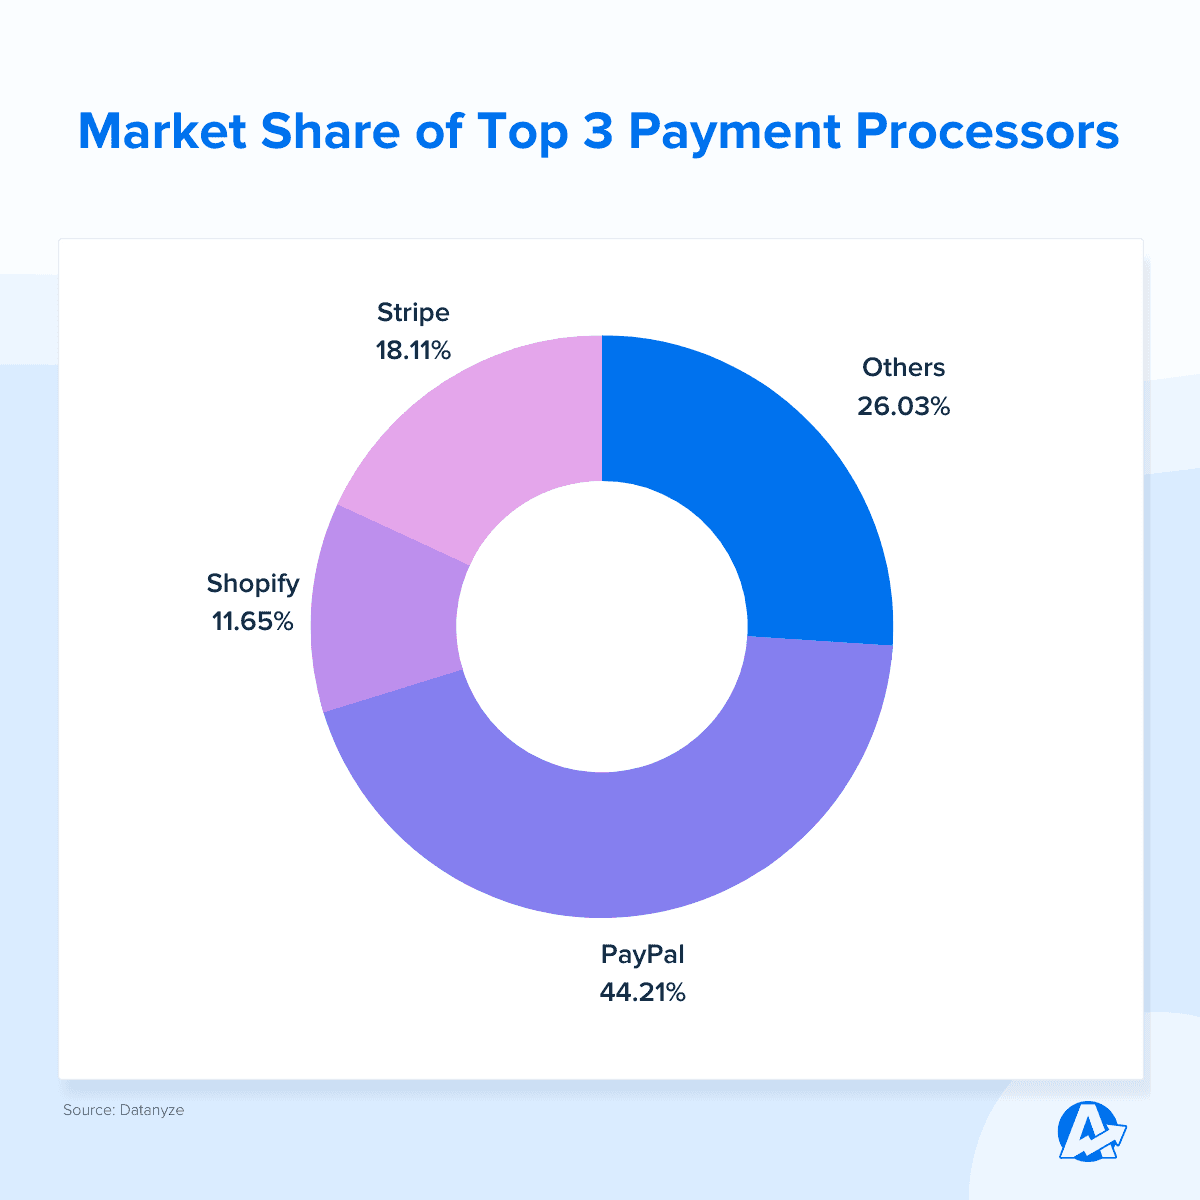
From small startups to Fortune 500 companies, there are currently 3.1 million businesses worldwide using Stripe’s payment processing service. With numbers that big, chances are at least some of your clients are among the user group.
While your client’s payment processor isn’t the most important factor in their eCommerce success, working with Stripe-connected clients does have a benefit to you as the agency: Stripe’s analytics capabilities allow you to pull data from online sales, and from there, draw parallels between revenue increases and your agency’s latest marketing efforts.
The AgencyAnalytics Stripe integration helps your agency create comprehensive, white labeled eCommerce marketing reports that paint the full picture of how your hard work has paid off.
Want to visually showcase how eCommerce sales are directly linked to your recent social media campaign? We’re on it.
Need to emphasize how a new pop-up ad on a client’s landing page has influenced conversions? Look no further.
Curious to learn more? This article is your go-to guide for creating user-friendly Stripe reports tailored to your eCommerce clients' needs.
Let's get started!
What Is Stripe?
Stripe is a popular payment processor used by eCommerce businesses. The software handles credit card payments, digital wallets, and other online payment methods. It’s also a great solution for your clients that have subscription businesses, as it has tools to manage recurring payments and the financial metrics that go along with that.
Types of Stripe Data
Digital marketing agencies use Stripe to research new ways to optimize their eCommerce clients’ businesses. For example, they’ll look at the Stripe payment gateway data and determine ways to improve the checkout process, such as reducing cart abandonment rates and increasing conversion metrics.
Customer spending habits directly influence your client's overall revenue growth. Use this information to help your agency develop data-driven marketing strategies and understand what is driving the business forward, like:
Making decisions about the actual value of new customers, including those with recurring revenue products
Adjusting acquisition campaigns by understanding how much customers are willing to spend on a product and how long they are likely to stay with your clients
Understanding which products are most popular with customers and determining whether or not to offer discounts on certain products
So, what types of Stripe data does the platform provide within their dashboards and reports? Let’s take a look.
1. Transaction Stripe Data
Transaction Volume: This includes the number of transactions processed over a specific time period.
Transaction Value: This is the total monetary value of transactions processed.
2. Revenue Insights
Revenue Breakdown: Detailed breakdown of revenue by product, service, or subscription plan.
Revenue Trends: Trends in revenue over time, including growth or fluctuations.
3. Customer Behavior
Customer Demographics: Insights into the demographics of paying customers, such as age, location, and gender (if available).
Customer Acquisition: Stripe Data on how customers are acquired (marketing channels, referrals, or other sources).
4. Subscription Metrics
Subscription Growth: Key metrics related to the growth of subscription-based services, including new subscribers, churn rate, and retention.
Subscription Revenue: Revenue generated from subscription plans and the breakdown by plan type.
5. Payment Method Data
Preferred Payment Methods: Information on the most commonly used payment methods among active customers, such as debit card transactions.
Payment Conversion Rates: Conversion rates for different payment methods, helping agencies improve checkout rates and overall eCommerce conversion rate optimization.
6. Geographic Insights
Regional Sales Data: Sales data broken down by geographic region or country.
Currency Analysis: Information on the currencies used for transactions and their impact on your clients’ average revenue.
7. Refund Data
Refund Rates: This Stripe data provides insights on refund requests and rates, helping identify product or service issues.
8. A/B Testing Insights
Checkout Optimization: This Stripe data is related to A/B testing of checkout processes, aiming to help improve conversion rates.
Stripe Reporting Shortcomings
Stripe offers dashboards and summaries for payment data in real time. The range of analytics helps clients to:
Identify recent activities that might require immediate action, such as unanswered disputes
Refund a payment or cancel a subscription
Manage the flow of money coming in and out under the Payments tab
Invite team members with different levels of access to manage the business

While Stripe analytics dashboards offer a wide range of data, they are also highly technical and difficult to add to your clients’ larger marketing reports. Reports can be downloaded in a CSV format, but within Stripe, you won’t be able to connect your clients’ eCommerce data to marketing data sources like their PPC campaigns, for example.
The most predominant metrics our clients look for are cost per lead and cost per acquisition (or cost per sale for eCommerce).
Ryan Kelly, CEO, Pear Analytics
Using AgencyAnalytics To Strengthen Stripe Data Insights
Consider this scenario. Your agency is running a paid advertising campaign to pump a specific product your client is selling. You’ll want to connect the dots between the increase in sales and the ads your team specifically created to get those targeted customers to take action.
Using the Stripe integration from AgencyAnalytics, custom dashboards are built to showcase exactly how the revenue generated during a specific time period interacts with your agency’s marketing activities. It’s easy to create custom white-labeled graphs that overlay Stripe payment info and PPC ad campaign data, for example.
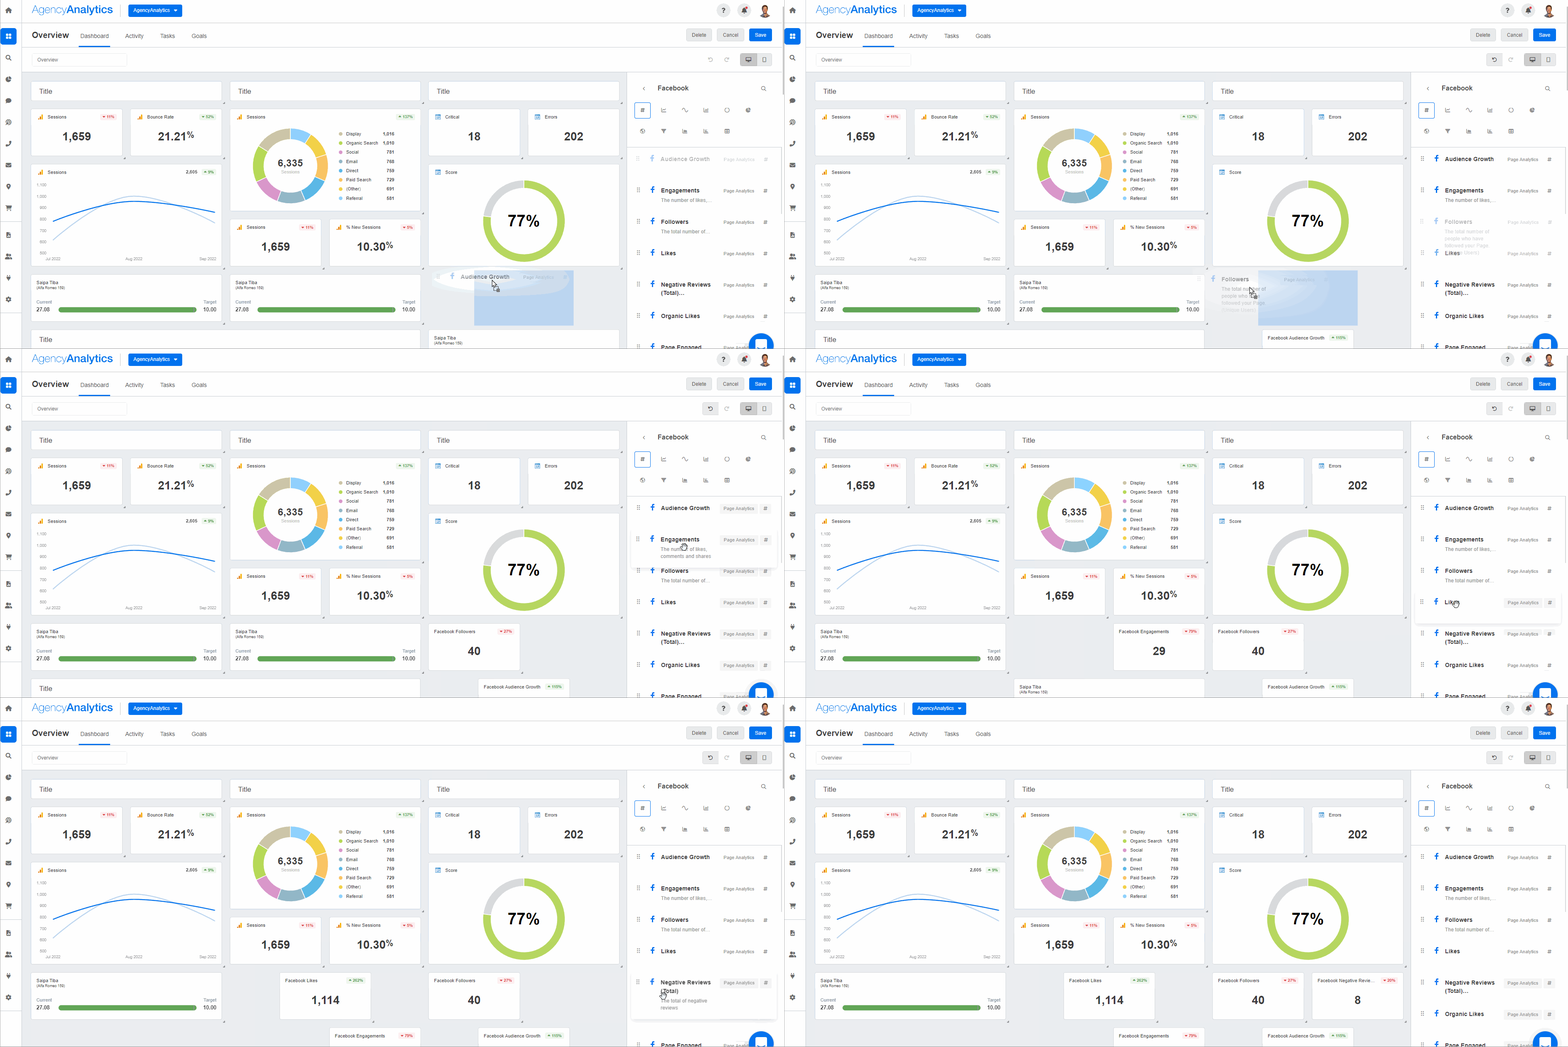
Use the drag-and-drop editor in AgencyAnalytics to combine your client’s payment data alongside over 80 other integrations of your choice to create complete and detailed dashboards.
It’s important to prioritize metrics based on the KPIs that are important to your company. For example, an e-commerce brand will be hyper-focused on CPP (cost per purchase) and ATC (add to carts) whereas a local restaurant that is just in the midst of launching may be looking for impressions and reach for awareness purposes. Always take a look at your business and what is the number one thing that will help move the needle forward based on its current standing.
JC Polonia, Founder, Digitality Marketing
Use custom metrics to compare revenue against total ad spend. By using a simple formula to combine the ad spend from every platform and compare it against the total payments received, your team understands what percent of revenue is being reinvested into marketing, quickly converting raw data into actionable insights.
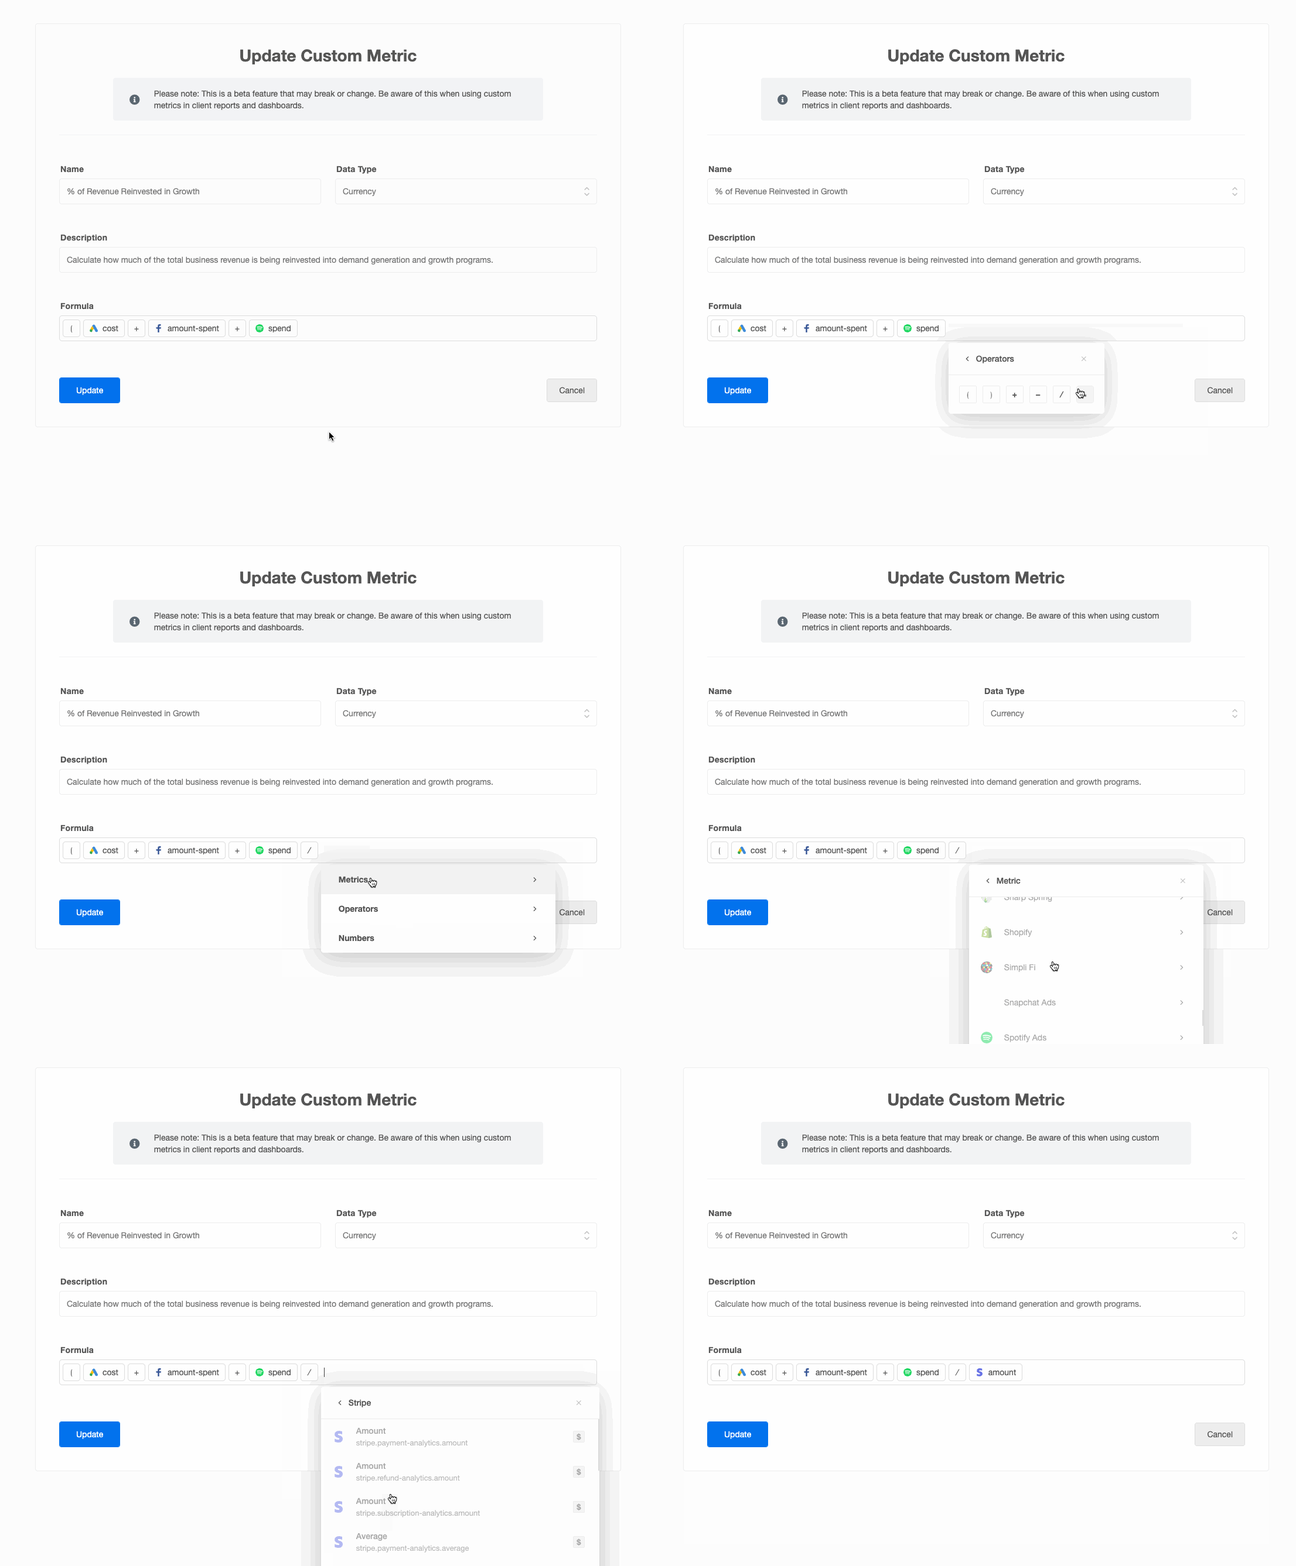
Or subtract refunds from total payments to automatically calculate net revenue. It's easy to create custom metrics based on various campaign data.
Once you've created a custom metric, add it like any other widget to your client’s custom dashboard or to reports.
Custom metrics offer flexibility for specific data points or projections, such as:
Combining Google Analytics customer acquisition data with Stripe MRR data to create a rough projection of Lifetime Value by Channel and showcase the total revenue potential of Paid Ads, Social Media, SEO, and more.
Comparing Drip Subscriber Counts to total Stripe revenue to estimate the average value of each contact in your client’s database. Use this to set a target CPL for new leads.
Similarly, using call tracking details from Call Rail, set an average value to the company for each phone call generated. Then, turn this data into CPA targets for Google Local Services Ads.
The monthly revenue figures from Stripe help allocate a percentage-based growth marketing budget, showing you how much to invest into Google Ads, Facebook Ads, and Spotify Ads–all without putting additional strain on your client’s finances.
Combining Stripe data with eCommerce data from Shopify spots trends in online vs. offline purchases.
The options are practically endless. Almost every data point within the AgencyAnalytics dashboard can be combined with your client’s Stripe metrics to create revenue estimates for key marketing activities, providing everything you need to make data-driven decisions.
What To Include in Your Stripe Dashboard
Aside from creating custom metrics, the AgencyAnalytics Stripe dashboard offers critical eCommerce analytics to measure the success of your agency’s strategies.
Here are four dedicated sections to include in your Stripe dashboard to ensure you’re meeting your client’s eCommerce goals:
1. Account Overview
The first tab in your Stripe analytics dashboard showcases insights into your client’s overall financial performance. This is where the total amount of payments and refunds processed and the current MRR for active subscriptions are shown.
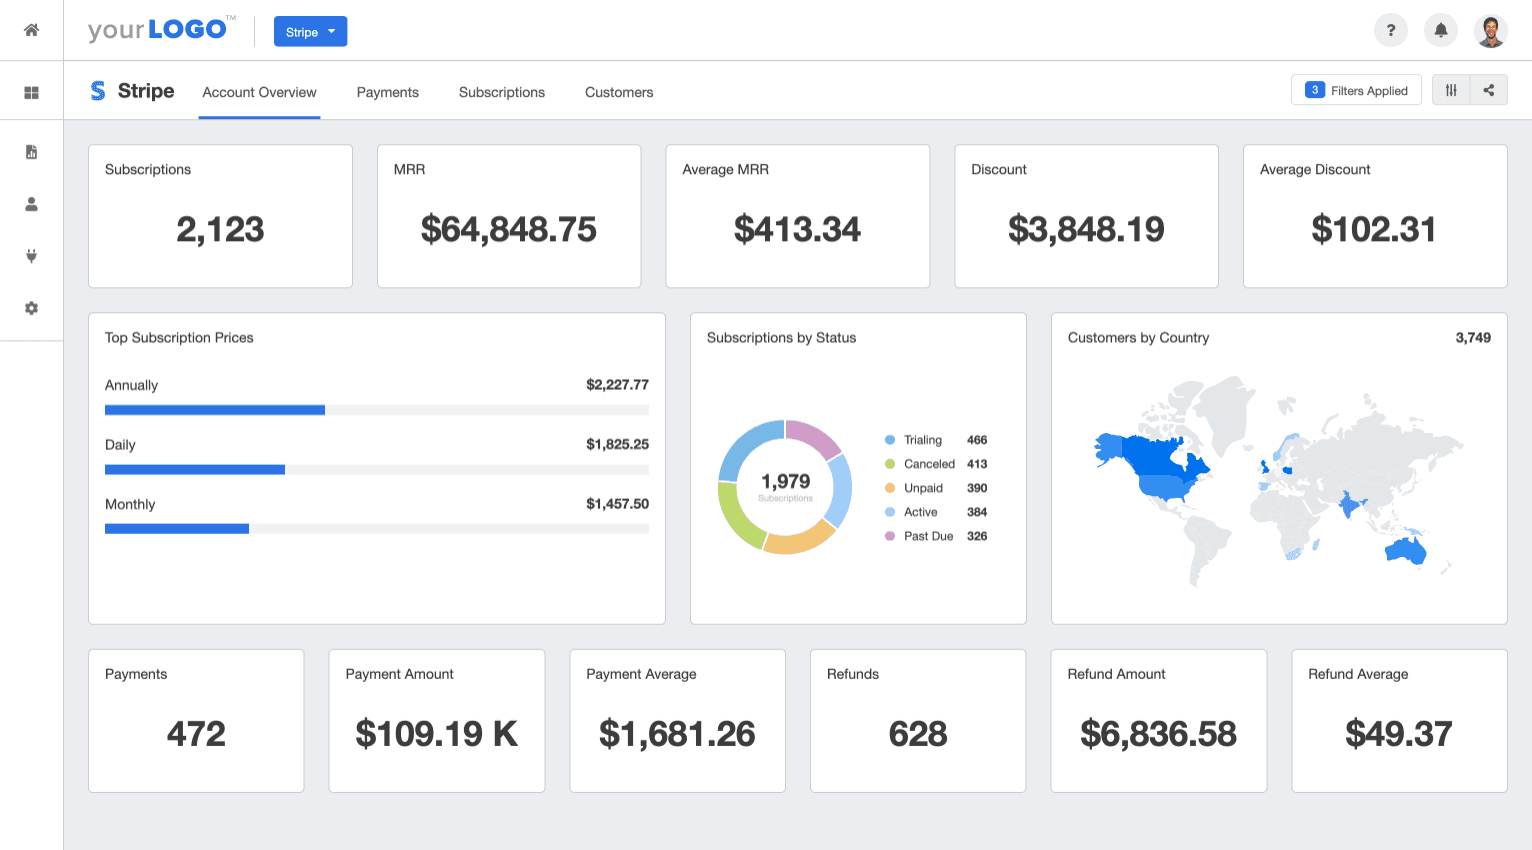
Widgets include both active and lifetime Stripe data to give you the complete picture. We recommend tracking the following metrics:
Active Subscriptions
Current MRR
Current Average MRR
Discounts Applied
Average Discount
Top Subscription Prices
All Subscription Statuses
Customers by Country
Total Payments Processed (Lifetime)
Total Payment Amount Received (Lifetime)
Average Payment Amount (Lifetime)
Total Number of Refunds Issued (Lifetime)
Total Amount of Refunds Issued (Lifetime)
Average Refund Amount (Lifetime)
2. Payments
Next, show how payments, refunds, and gross revenue retention have increased over time with easy-to-understand data visualization that helps marketing agencies and clients alike. For example, use line graphs to help your agency track and communicate the client’s business growth over a period of time.
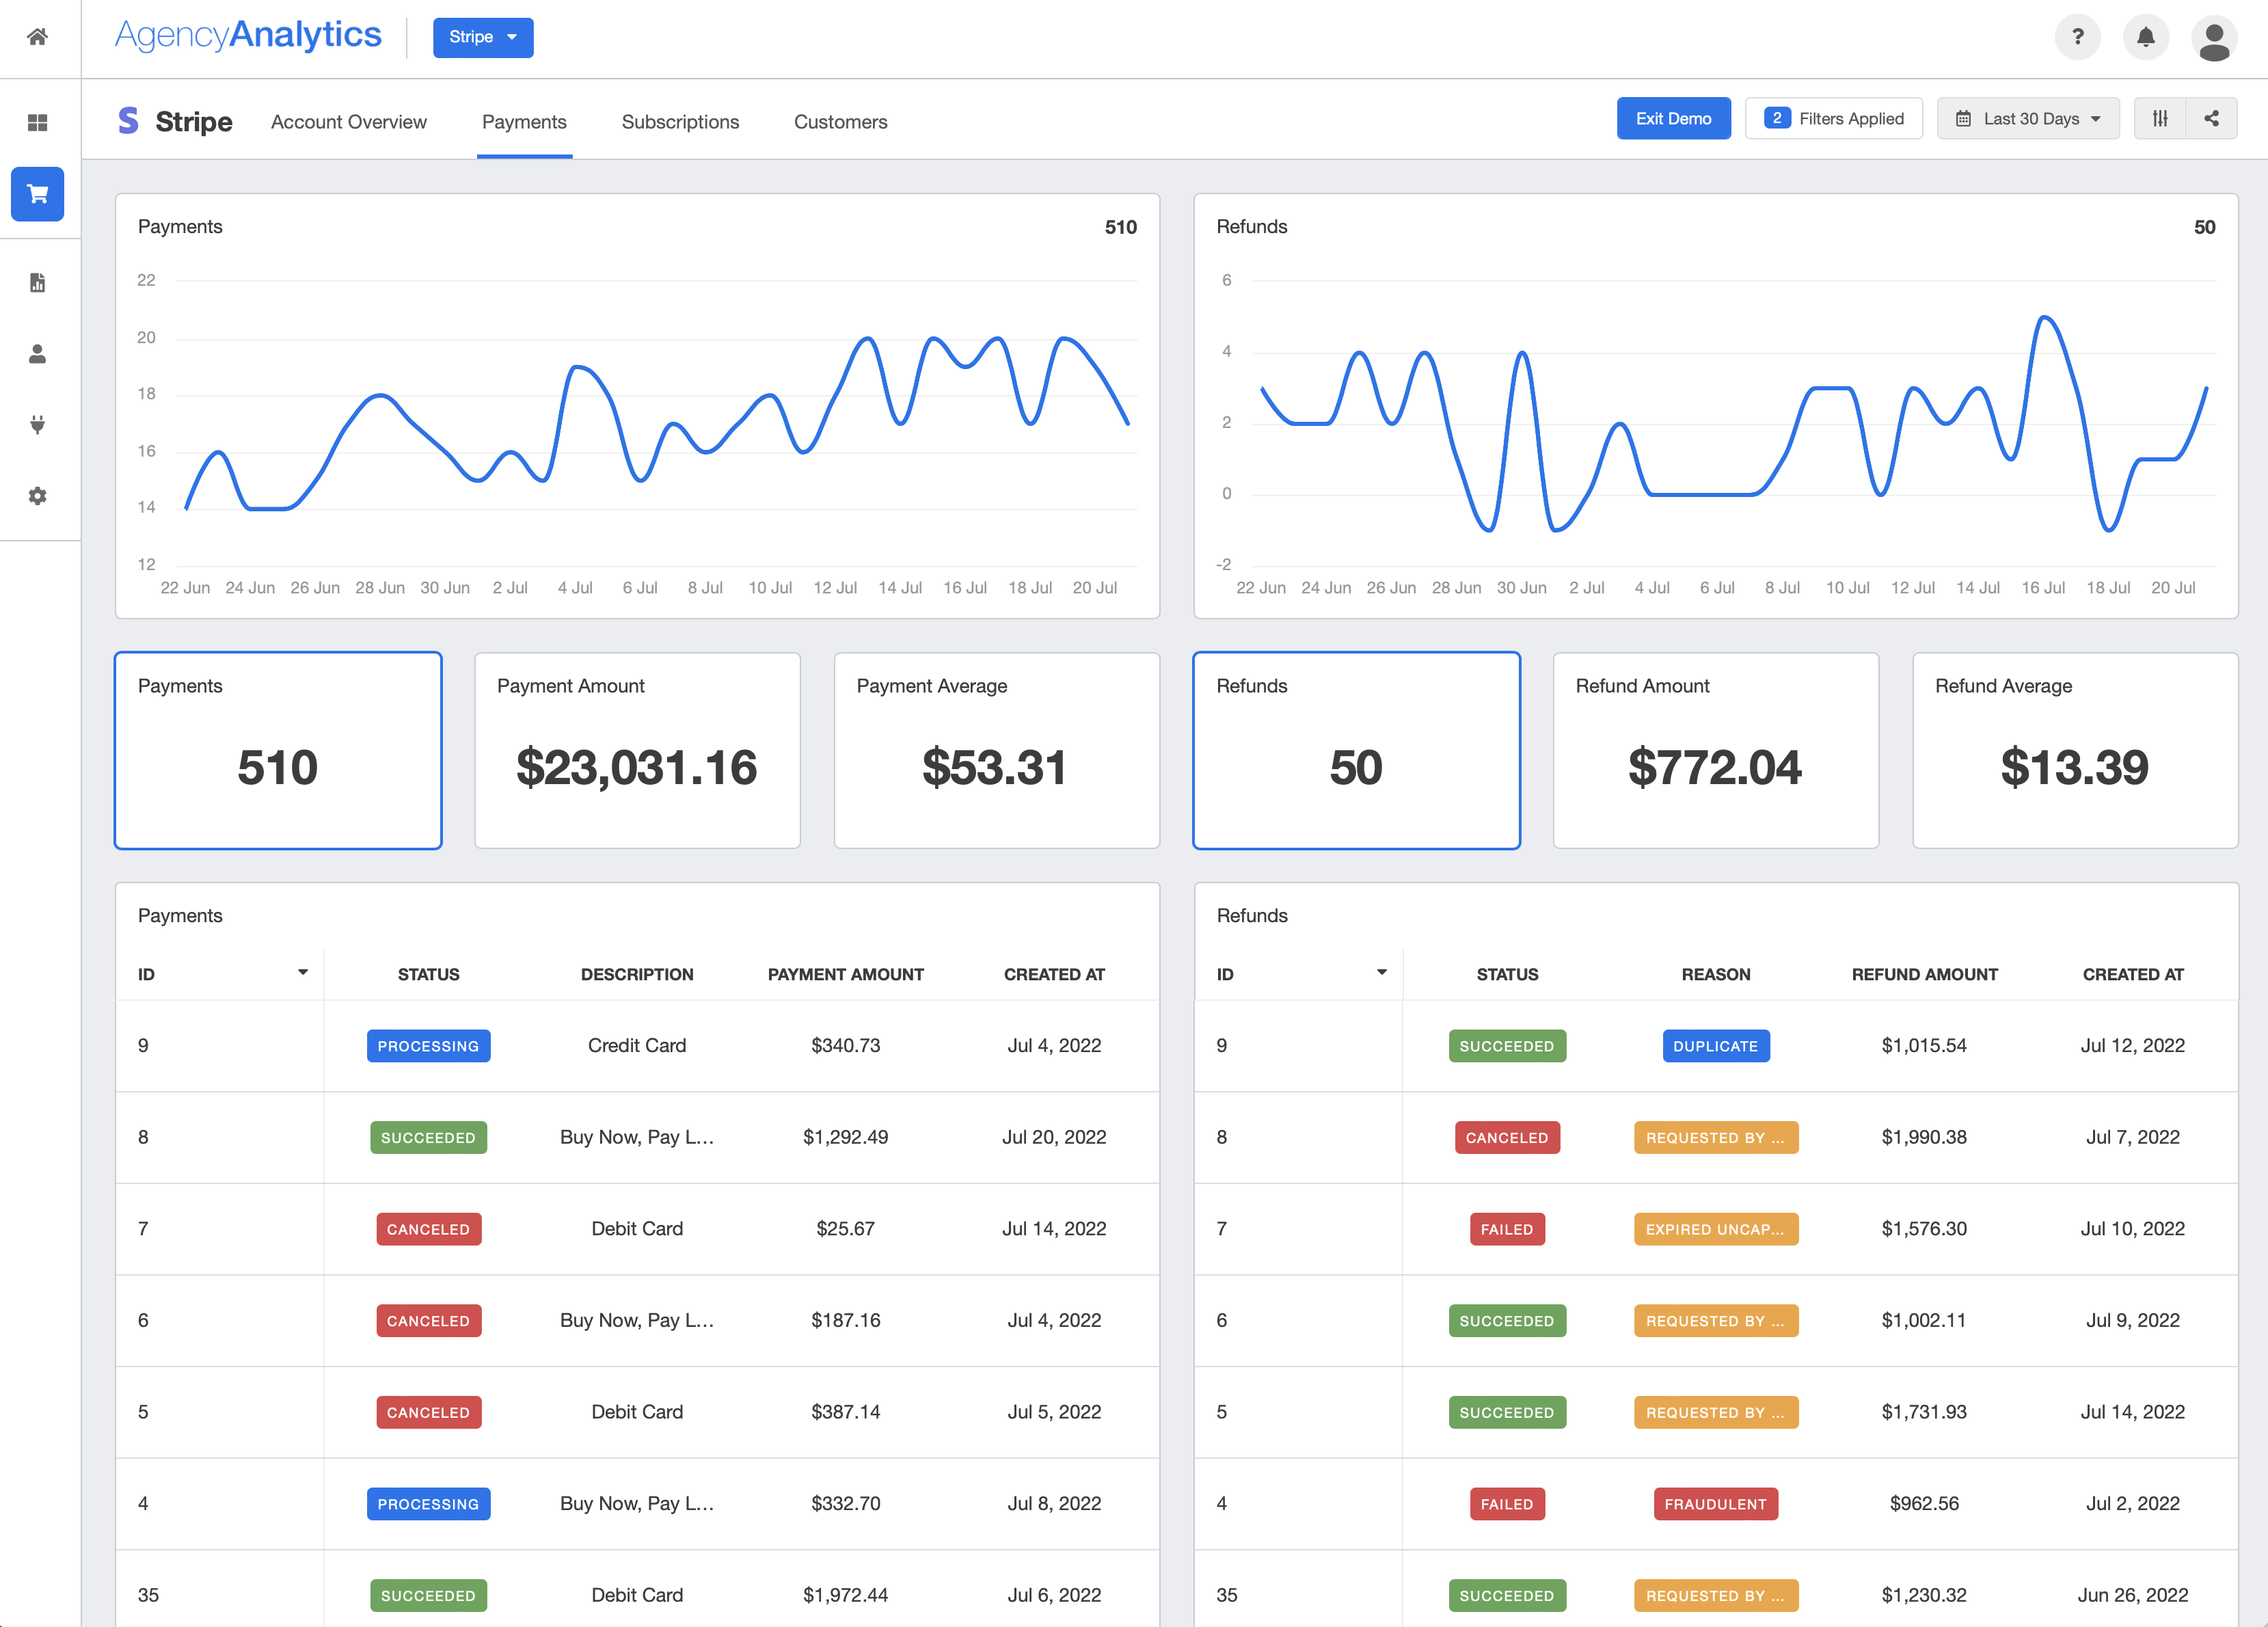
Set a specific date range, or use the compare feature to see how successful and failed payments have changed month-over-month or year-over-year. Include widgets such as:
Payments (Line Graph)
Refunds (Line Graph)
Total Payments
Total Payment Amount
Average Payment Amount
Total Refunds
Total Refund Amount Recent Payments
Recent Refunds
Payment Details (Table)
Refund Details (Table)
3. Subscriptions
The next tab in your client’s Stripe dashboard is all about subscriptions. Track subscription revenue by monitoring New, Active, and Canceled customers as well as PQLs who are currently on a trial. This is especially important if your clients are SaaS businesses, apps, or have an automated refill program in place.
When we onboard a new client with an eCommerce store, we ask the client what products or categories they make the most margin on. If it's a subscription business, we ask the client what is the average time length that the subscriber stays with them, that way we can understand the potential ROI from the campaign.
Anatoly Zadorozhnyy, CEO, Marketing1on1
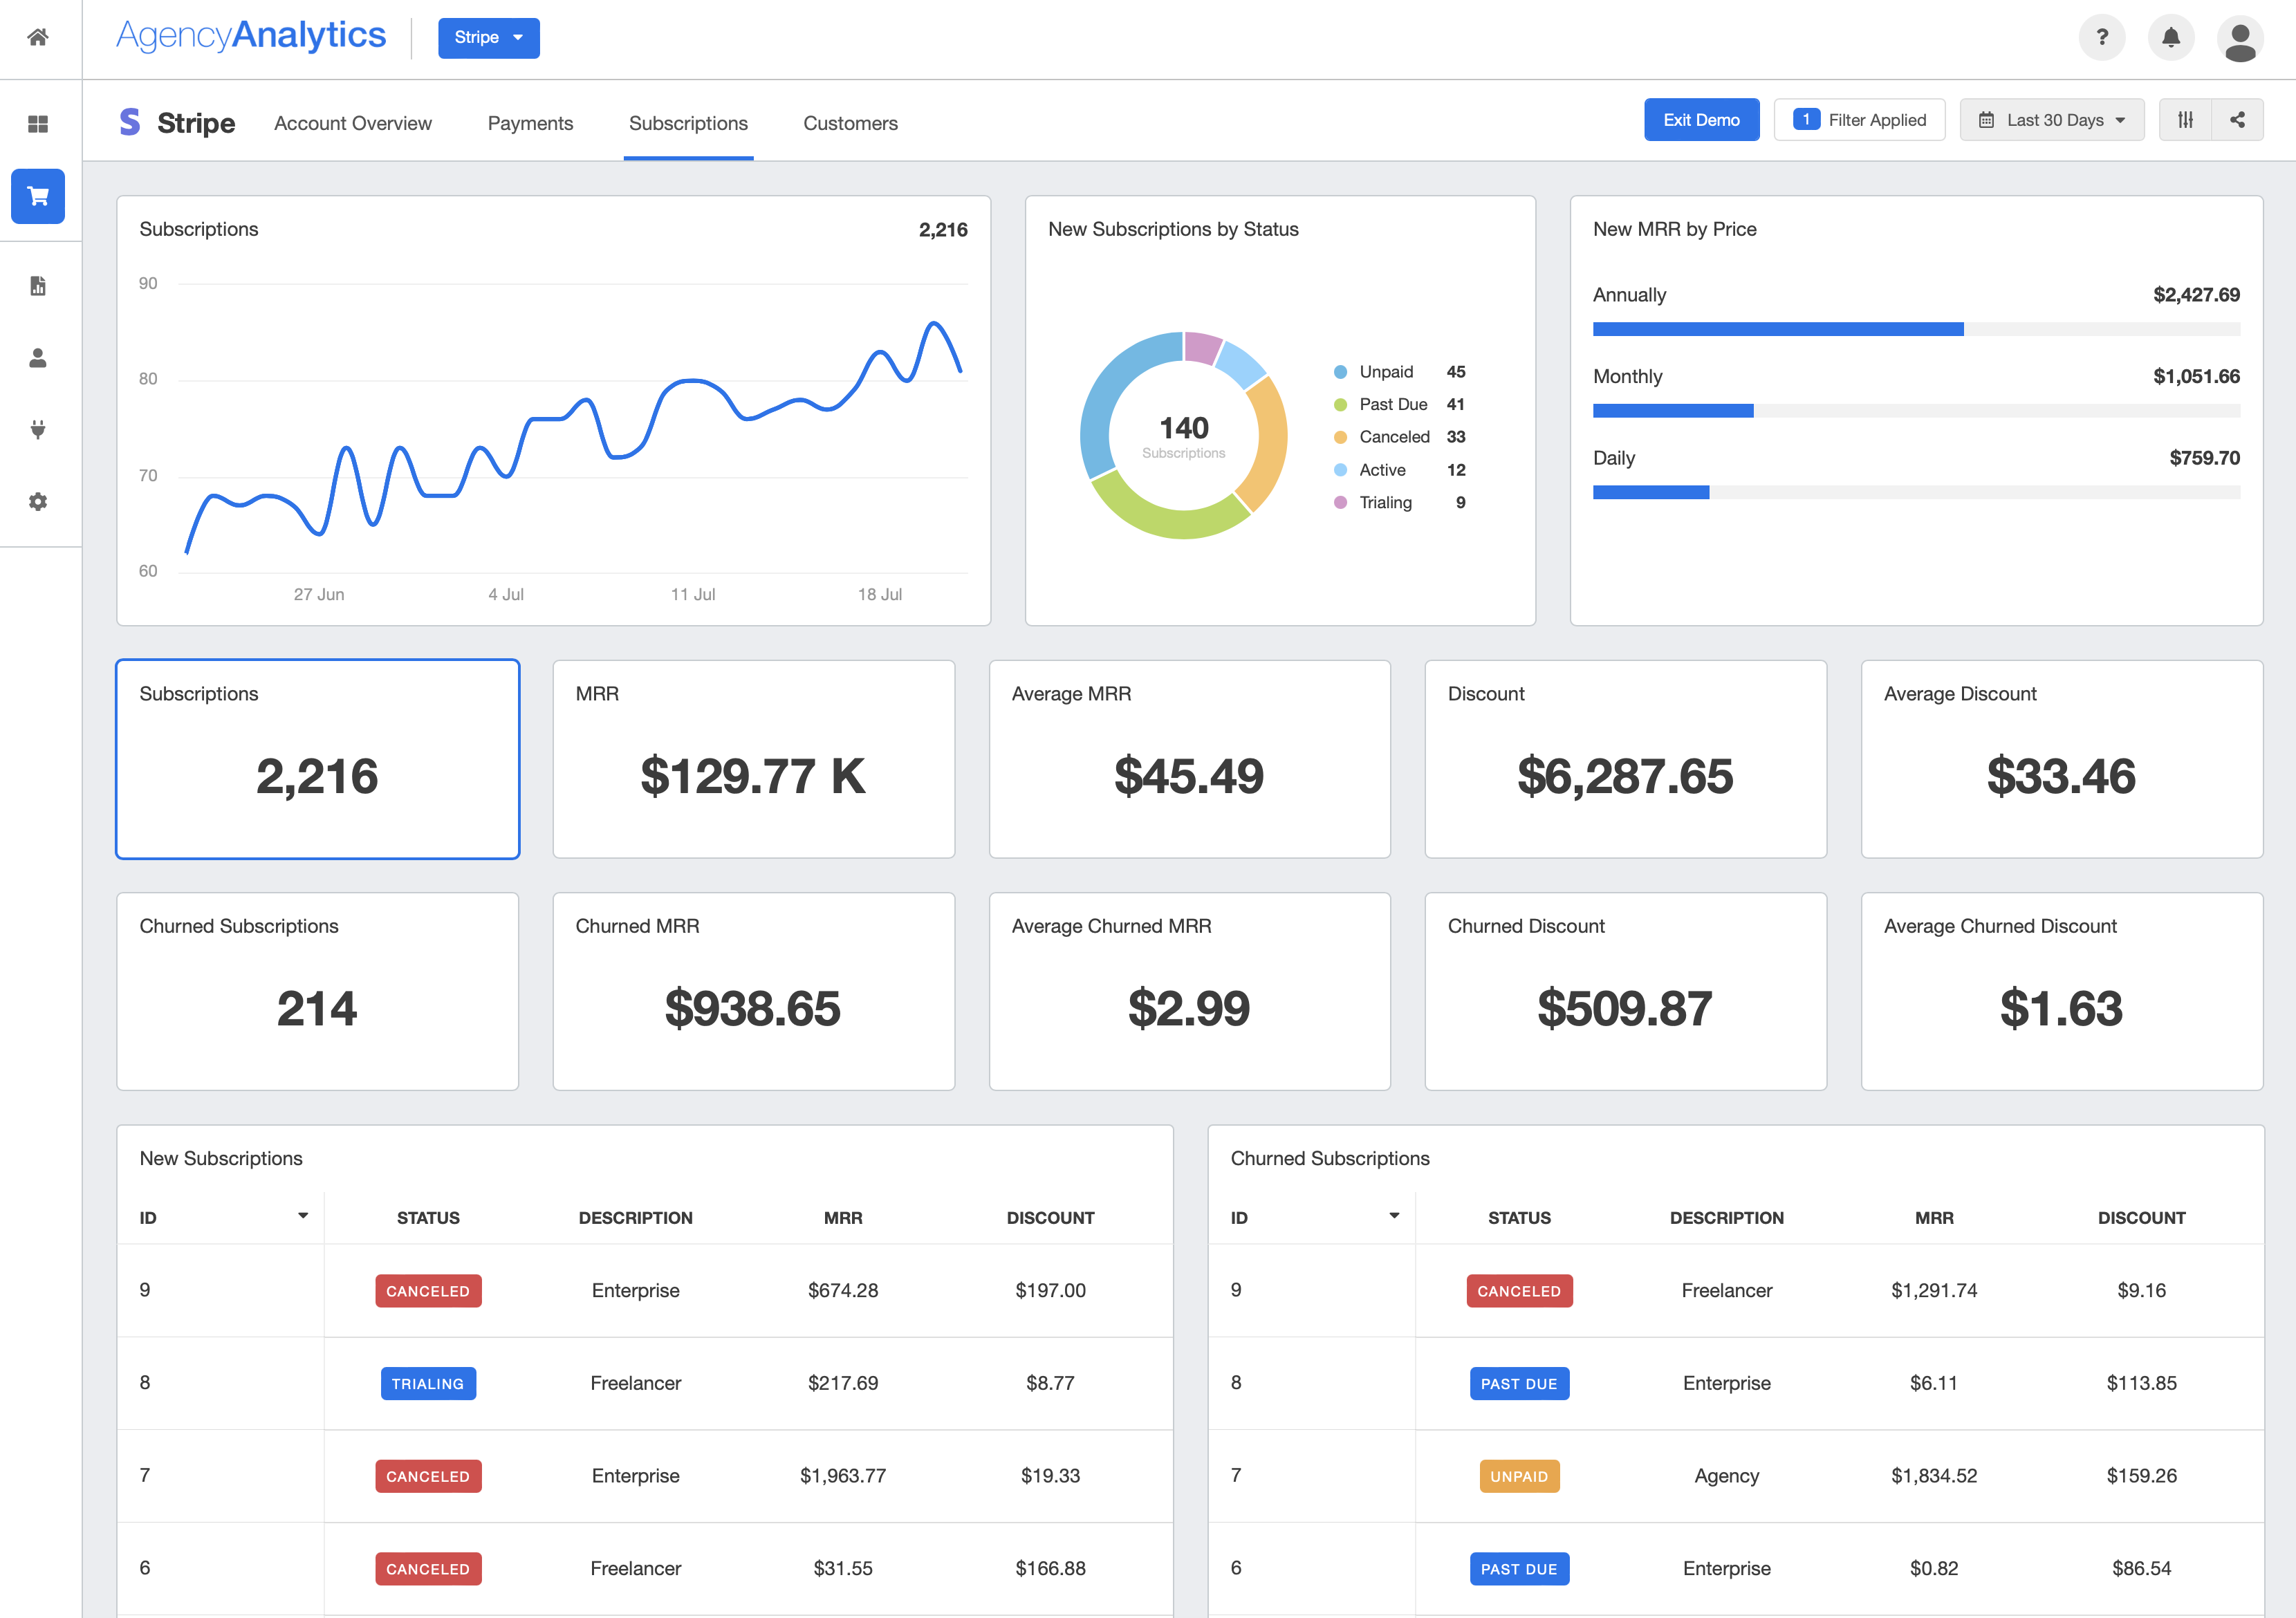
Widgets to include in this section:
Total Subscribers
New Subscribers by Status
New MRR by Price
Total Subscriptions
MRR during the set period
Average MRR
Discounts Applied
Average Discount
Churned subscriptions during the set period
Churned MRR
Average Churned MRR
Churned Discounts
Average Churned Discounts
New Subscription details
New Churned details
Investigating various causes of churn, including delinquent churn from past-due accounts, poor customer experience, and unmet needs, is essential to help clients safeguard their net revenue retention. Churn rate plays a pivotal role in shaping the growth rate, as lost customers can erode the financial progress made in previous months.
Agency Tip: The descriptions in the Stripe Dashboard are user-defined. Add descriptions to the Subscription types in your client’s Stripe account to create more intuitive, at-a-glance Stripe Dashboards and reports.
Incorporating goals and annotations in your client’s marketing dashboards also helps communicate how your agency is progressing toward subscription goals and other pre-determined KPIs or metrics.
We measure sales for eCommerce clients and for national brands, we measure exposure along with sales growth goals.
Kevin Heimlich, Founder, The Ad Firm
4. Customers
The last tab in your client’s Stripe dashboard should be dedicated to their customers. This section provides a quick overview of your client’s current customer base, allowing them to track its growth over time.
Use this part of your Stripe dashboard to offer user-friendly visualizations that pinpoint your client’s best geographic locations. Be sure to highlight active customers, paying customers, and any information on rich customer profiles to gain insights on how to engage with potential new customers.
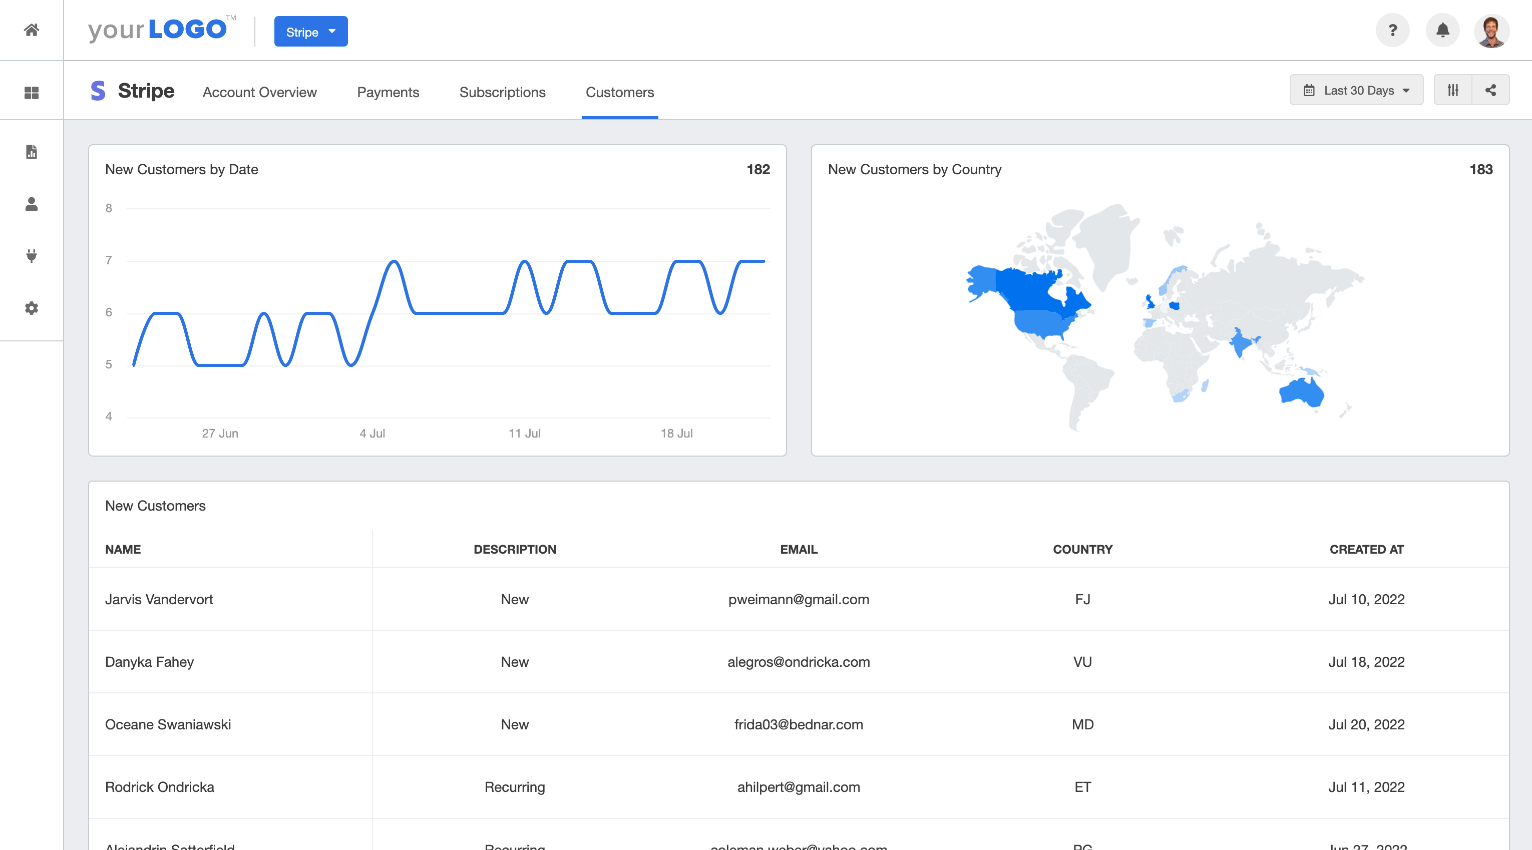
Widgets to include in this section:
New Customers During Set Period
New Customers by Country
New Customer Details (including name, description, email, country, and date)
Connect the Stripe Integration in 3 Easy Steps
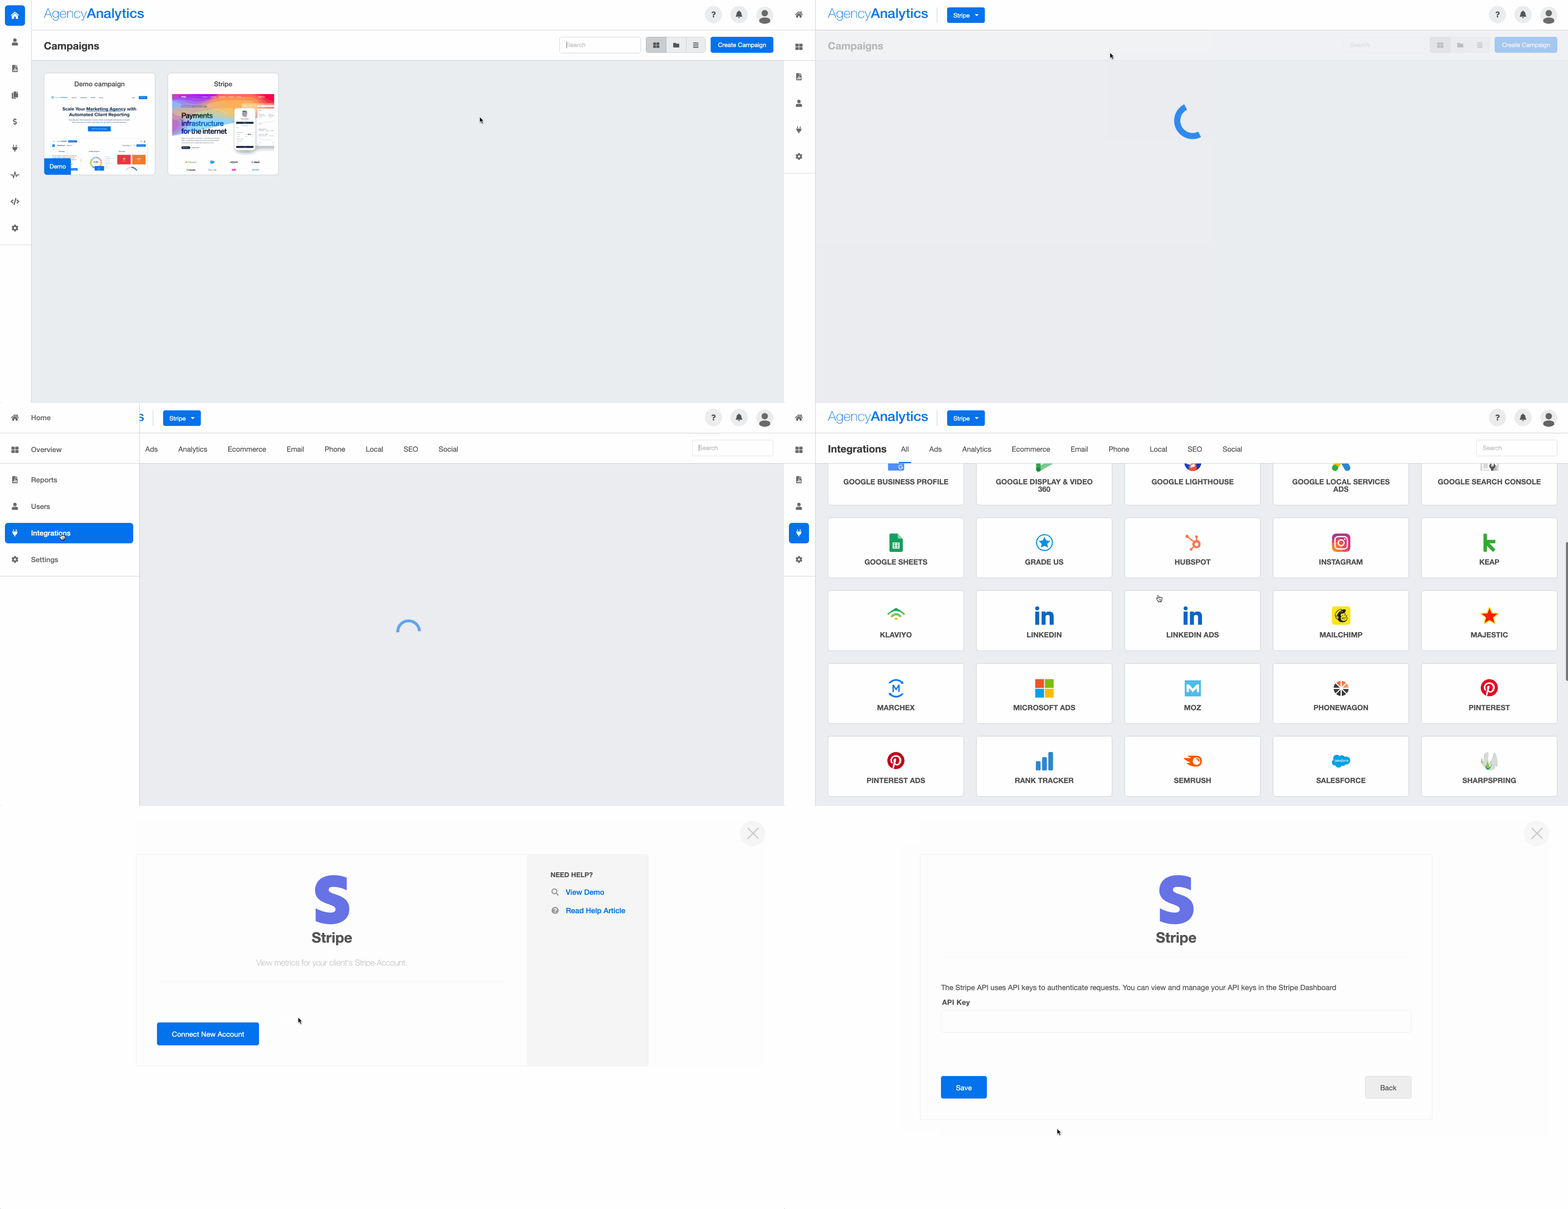
As you can see in the .gif below, setting up the Stripe integration for your eCommerce clients is easy. All you need to do is follow these three steps:
Step 1
Navigate to the campaign you want to connect to the Stripe integration.
Step 2
Click on Integrations from the menu bar, and then select Stripe from the list of integrations. You will first be prompted to connect a new account which requires entering your Stripe credentials.
Step 3
After you enter the login credentials, the integration is complete, and your client’s Stripe payments and subscription data will be imported and displayed within the dashboard.
Summary & Key Takeaways
Regardless of whether your clients are experienced in analyzing their Stripe analytics data or not, using a web analytics tool keeps them informed about their eCommerce performance and how it relates to the other marketing services they've trusted your team to execute. This promotes transparency in your relationship and highlights the connections between multiple data sources within your marketing efforts.
We primarily rely on Web Analytics & SEO reports for our clients. We merge this data with a custom template that tracks conversions and Stripe data to show that traffic growth - from SEO and PPC - does have an impact on the number of conversions and revenue (their bottom line).
Ruben Roel, President, Investigator Marketing
Connecting your clients’ Stripe data to their larger marketing campaigns tangibly showcases your agency’s value. Create a client-facing Stripe analytics dashboard to eliminate back-and-forth emails between reporting periods. AgencyAnalytics has multiple user permissions and automates the tedious Stripe data retrieval process for your eCommerce clients’ marketing reports.
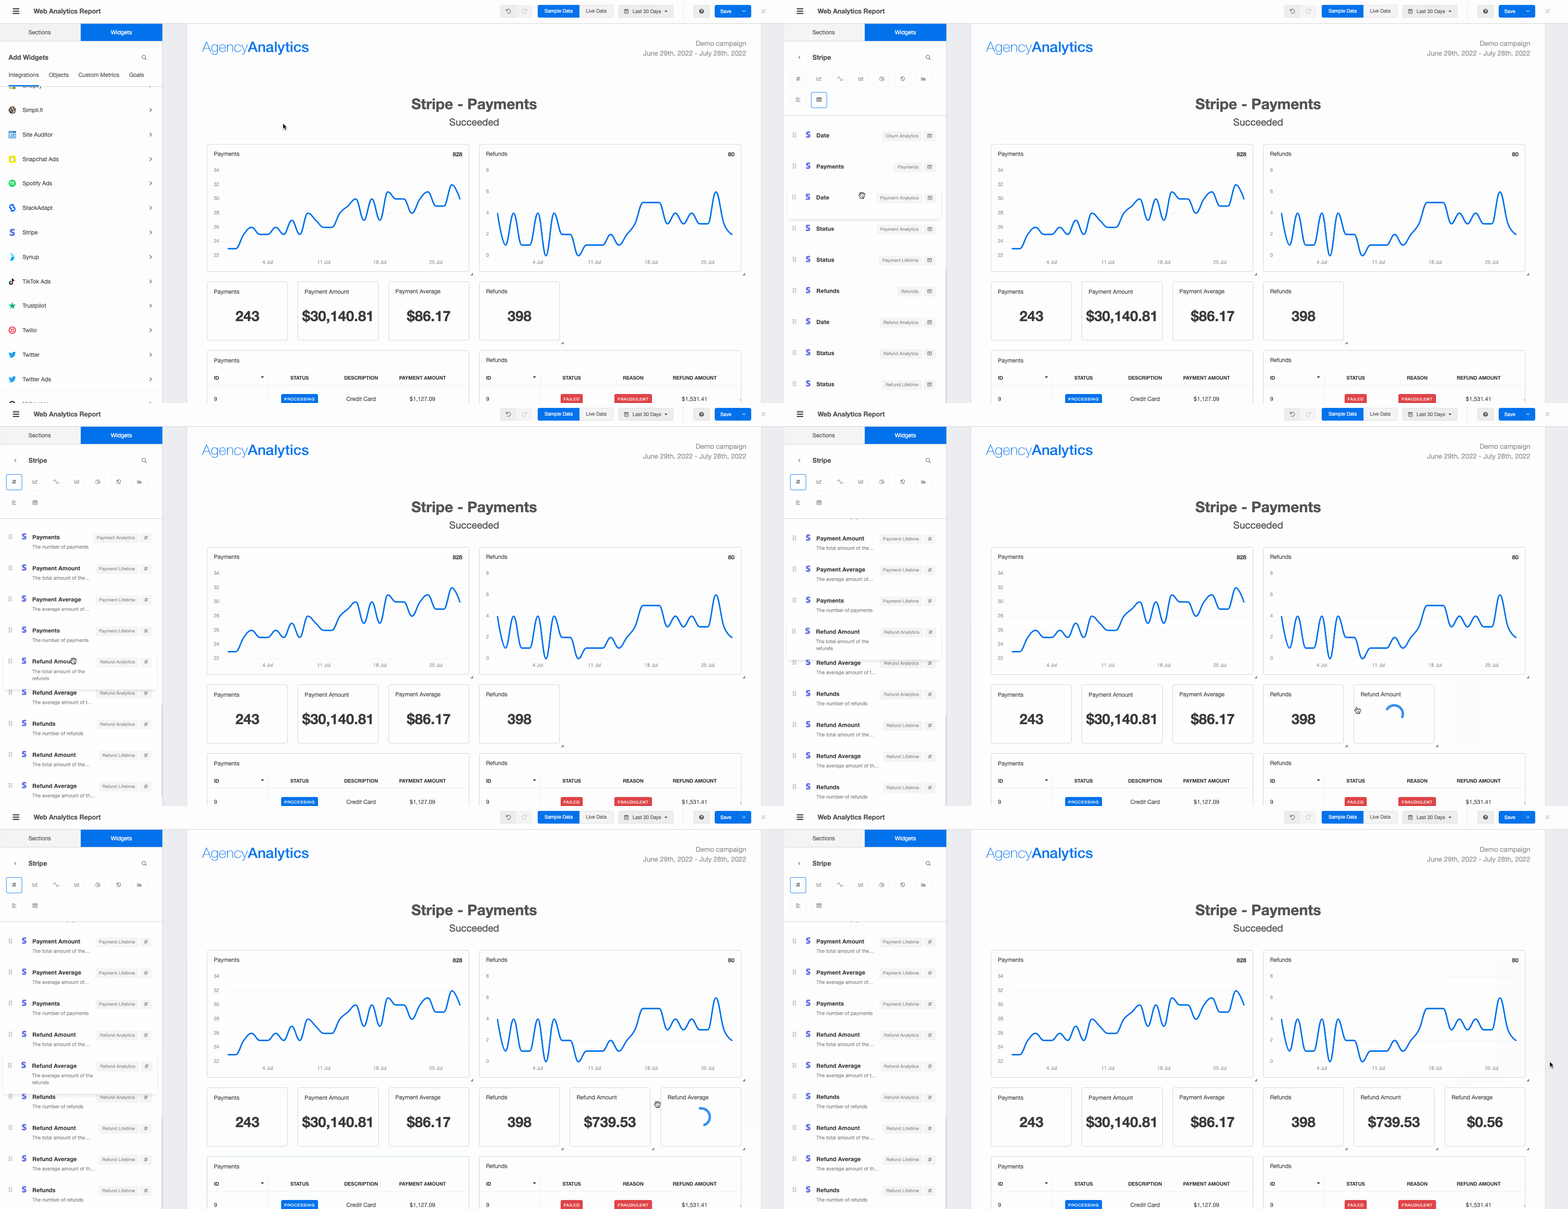
Focus on scaling your marketing agency and taking on more eCommerce clients using the Stripe integration. Start your free 14-day trial today to see how AgencyAnalytics simplifies your agency’s workflow.

Written by
Richelle Peace is a writer with a degree in Journalism who focuses on web content, blog posts, and social media. She enjoys learning about different topics and sharing that knowledge with others. When she isn’t writing, Richelle spends time teaching yoga, where she combines mindfulness, movement, and her passion for wellness.
Read more posts by Richelle PeaceSee how 7,000+ marketing agencies help clients win
Free 14-day trial. No credit card required.


