Table of Contents
QUICK SUMMARY:
Pinterest analytics provide in-depth insights that are essential for crafting effective Pinterest strategies. These analytics help answer critical questions about top-performing boards and Pins, audience engagement, follower growth, and revenue generated from Pinterest marketing. Explore the key Pinterest metrics and KPIs that guide how to effectively use Pinterest marketing strategies to drive growth.
Pinterest marketing is highly effective for capturing attention and creating a memorable brand.
While creativity and aesthetics are must-haves for all Pins, understanding Pinterest analytics is key to reaching success.
In Part I of our Agency Guide to Pinterest Marketing, we covered the ins and outs of this highly visual platform. From leveraging different Pin formats to creating easy-to-reference Pinterest boards, your clients have countless opportunities to stand out.
There’s just one crucial step left–tracking performance. In addition to understanding how to curate content on this platform, we’ll show you how to dive deep into Pinterest analytics and adopt a data storytelling approach to measuring success.
By using these insights to create comprehensive reports, you’ll be better equipped to give informed recommendations and show what your agency is capable of.
Why Is It Important to Track Pinterest Analytics?
When it comes to a visual platform like Pinterest, it isn’t enough to rely on surface-level insights that clients can see on their own.
Anyone can click on a Pin and look at the number of likes and comments. Solely relying on these insights isn’t a solid basis for creating a Pinterest strategy, simply because it doesn’t paint the full performance picture.
Tracking in-depth Pinterest analytics means being able to answer questions like:
How many website link clicks do we get from Pinterest?
What are the top boards on our Pinterest profile?
How do we recreate our top Pins?
Do we have an active and engaged audience?
What has our follower growth rate been for the past four months?
How much revenue is the Pinterest marketing strategy generating?
Should we overhaul our Pinterest strategy or even do an overall social media audit?
By monitoring the right insights, you’ll eliminate the guessing game. A data-driven approach puts you in a better position to give recommendations, set Pinterest KPIs, and help your clients meet their business goals using this visual-forward social media site.
A Key Performance Indicator (KPI) is a quantifiable measure used to evaluate the success of an organization in meeting specific goals. It also keeps transparency on the table and ensures that you and your client are on the same page about what’s expected.
KPIs are just an extension of us living out our core values. Reporting on KPIs keeps us accountable. KPIs provide the client transparency into what work we deliver, and, most importantly, KPIs demonstrate that we are on track and achieving mutually agreed-upon goals. This is our agency's true north: "results for clients."
David Krauter, SEO Strategist at Websites That Sell
How To Get Started With Pinterest Analytics
Before you hit the ground running, there are a few things to implement–let’s explore further.
1. Use Pinterest Business (Not a Personal Account)
To get access to Pinterest Analytics, you must first ensure your clients have business accounts. That means:
Creating a Pinterest Business account. That means simply going with the ‘Business’ option instead of ‘Personal’ during the initial account creation.
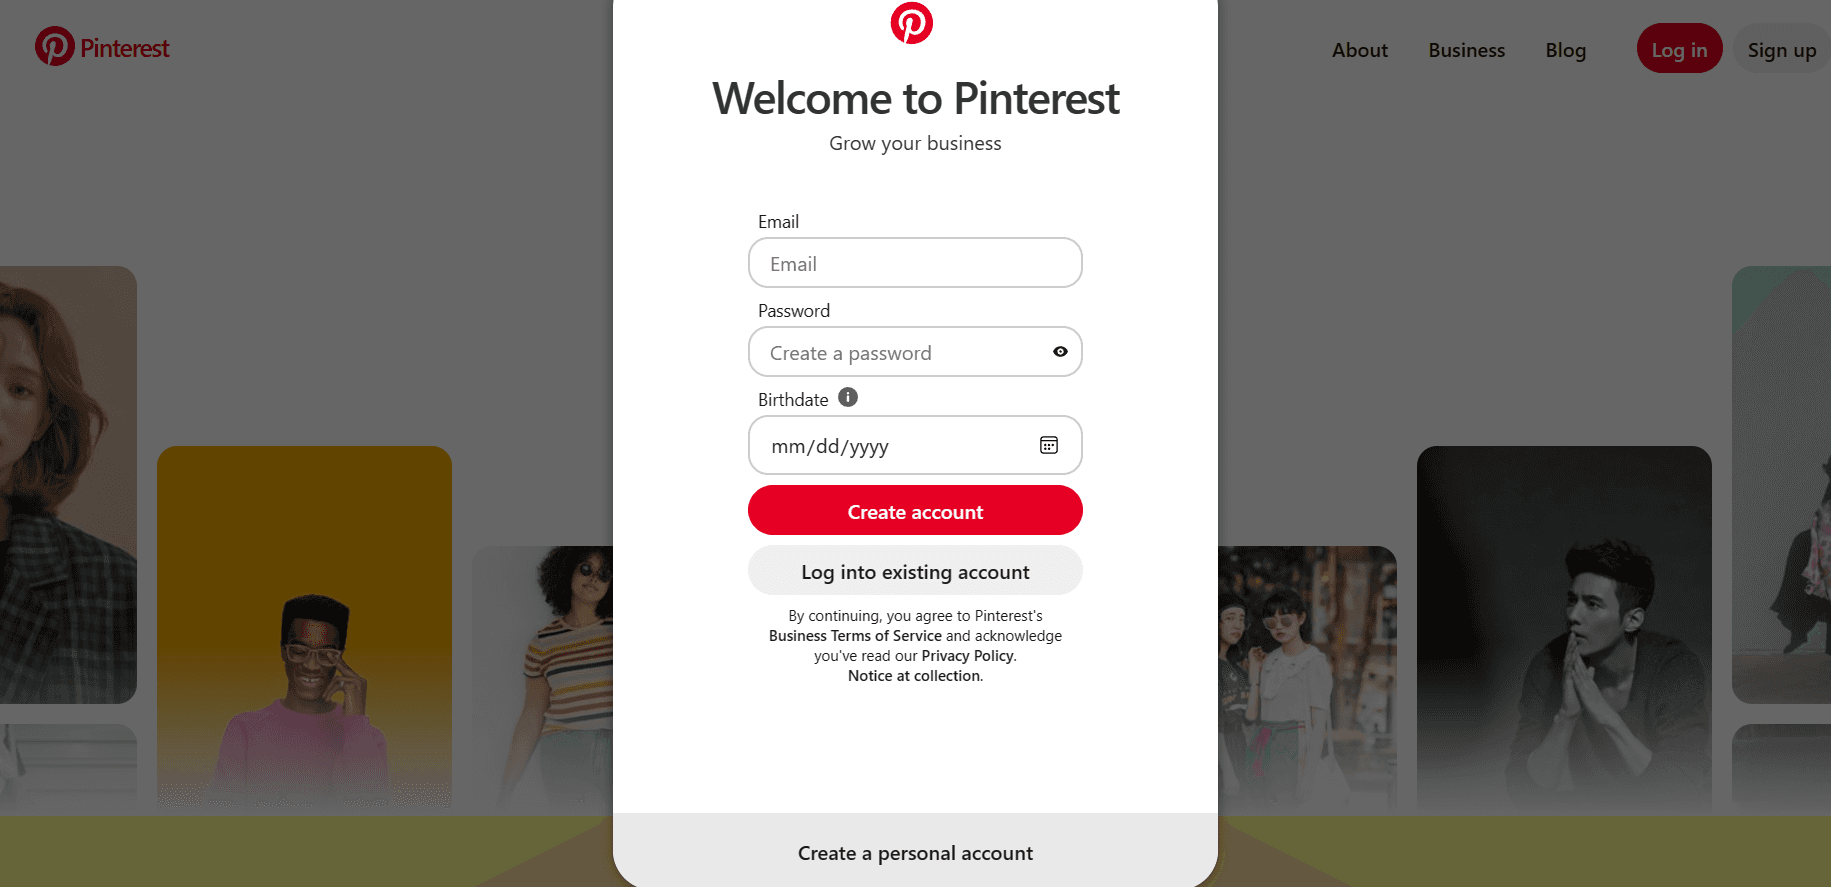
Alternatively, you may have to switch from a personal Pinterest account to a business account.
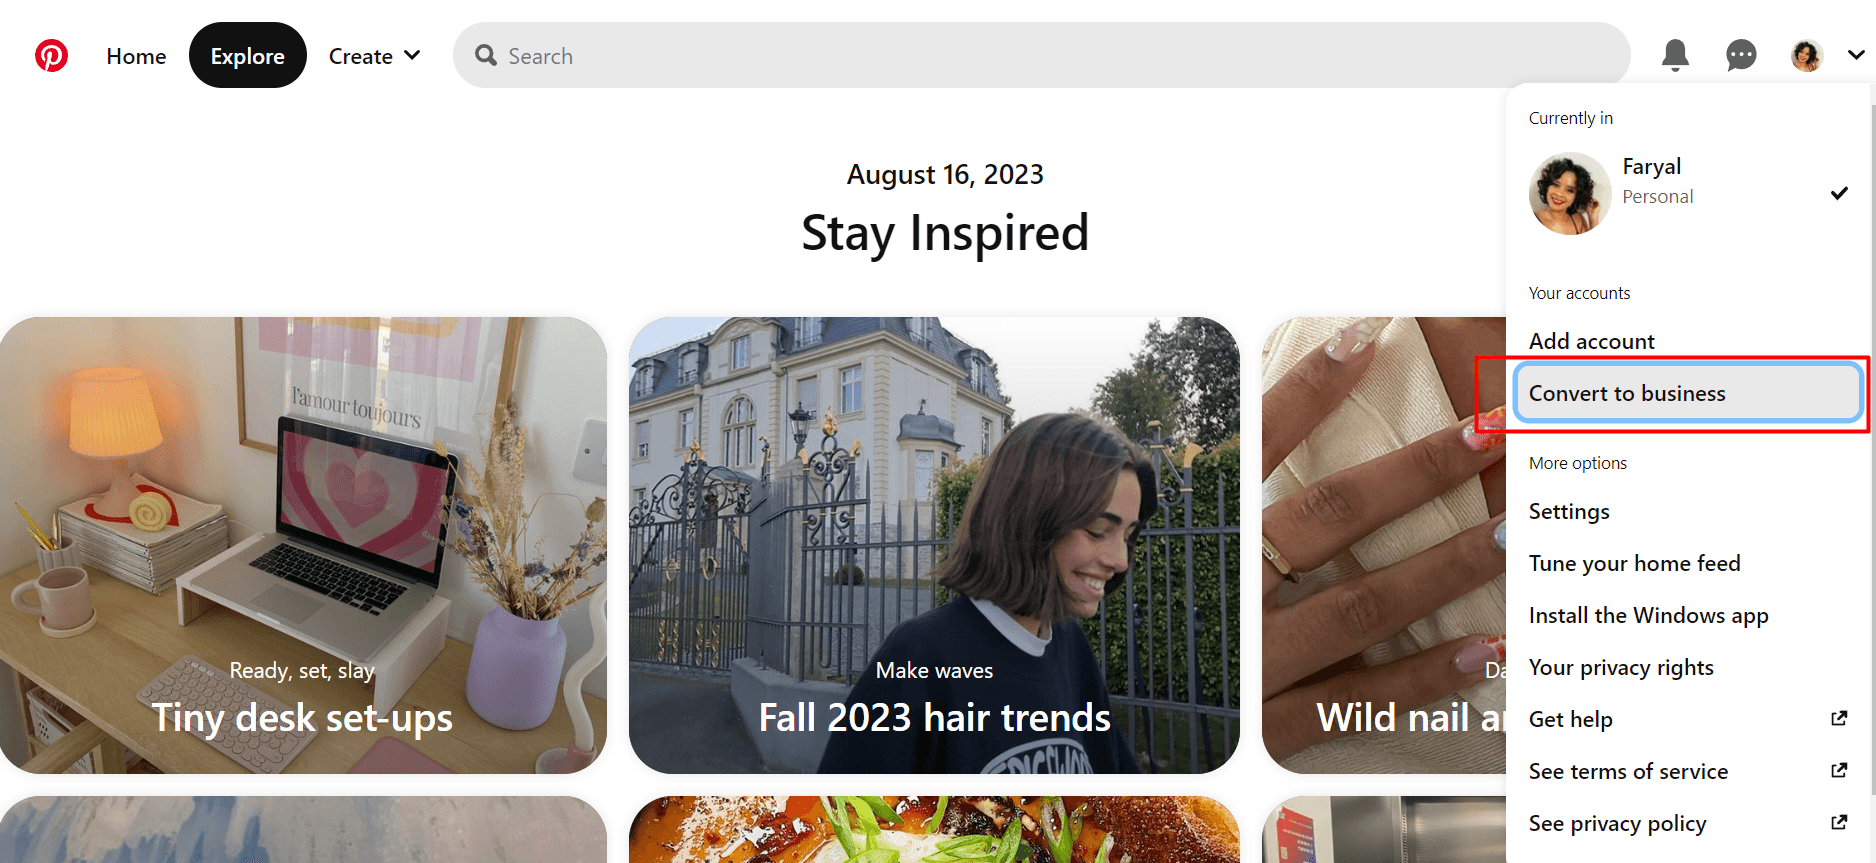
If you’re using a desktop browser, simply click on the client’s profile picture followed by ‘Convert to Business’ (as seen below).
If you’re using the Pinterest app, click on the client’s profile photo in the bottom-right corner. Then, go to Settings > Account Management > Convert to a business account.
From there, you’ll get access to Pinterest Analytics. To get the most out of this exercise, there are two additional steps to follow.
2. Claim Your Client’s Website
Users browsing the internet may come across your client’s website, see reference-worthy content, and save it directly to their Pinterest boards.
What if there was a way to track the most frequently pinned content on your client’s website? Luckily there is–all you have to do is claim your client’s website.
By following this step, you’ll go a step further than solely reporting on their most popular in-platform Pins for a claimed account. This golden data will help you replicate top-performing website content and understand search intent beyond Pinterest itself. In turn, you’ll demonstrate that you’re going above and beyond, considering all parts of the marketing picture.
To put this in place, you’ll have three options to choose from, which are:
Adding an HTML tag to your client’s website,
Uploading an HTML file to your client’s website, or
Including a TXT record in your client’s domain DNS settings.
Though it’s a technical process, a claimed website will ensure you get the most valuable Pinterest insights moving forward.
3. Use Google Analytics to Get Additional Pinterest Insights
Beyond Pinterest Analytics itself, you’ll need to understand just how much website traffic this social media network drives–that’s where Google Analytics comes in. It gives you a closer look at audience insights and more information to understand the full customer journey.
Using a data-blended approach will help you to understand the effectiveness of your client’s Pinterest efforts and whether they’re actively contributing to website goals (e.g., getting more page visits).
How To View Website Traffic From Pinterest on GA4
To access metrics like the number of visitors and engaged sessions from Pinterest, log into GA4 and head to Reports > Acquisition > Traffic Acquisition.
For a view of the future behavior of traffic first driven to a client’s website by Pinterest, use Reports > Acquisition > User Acquisition instead.
Under ‘Source,’ choose Pinterest to take a closer look at the numbers. If you’re not in the mood to follow this extensive process each time, use an automated GA4 reporting tool to do the data retrieval for you.
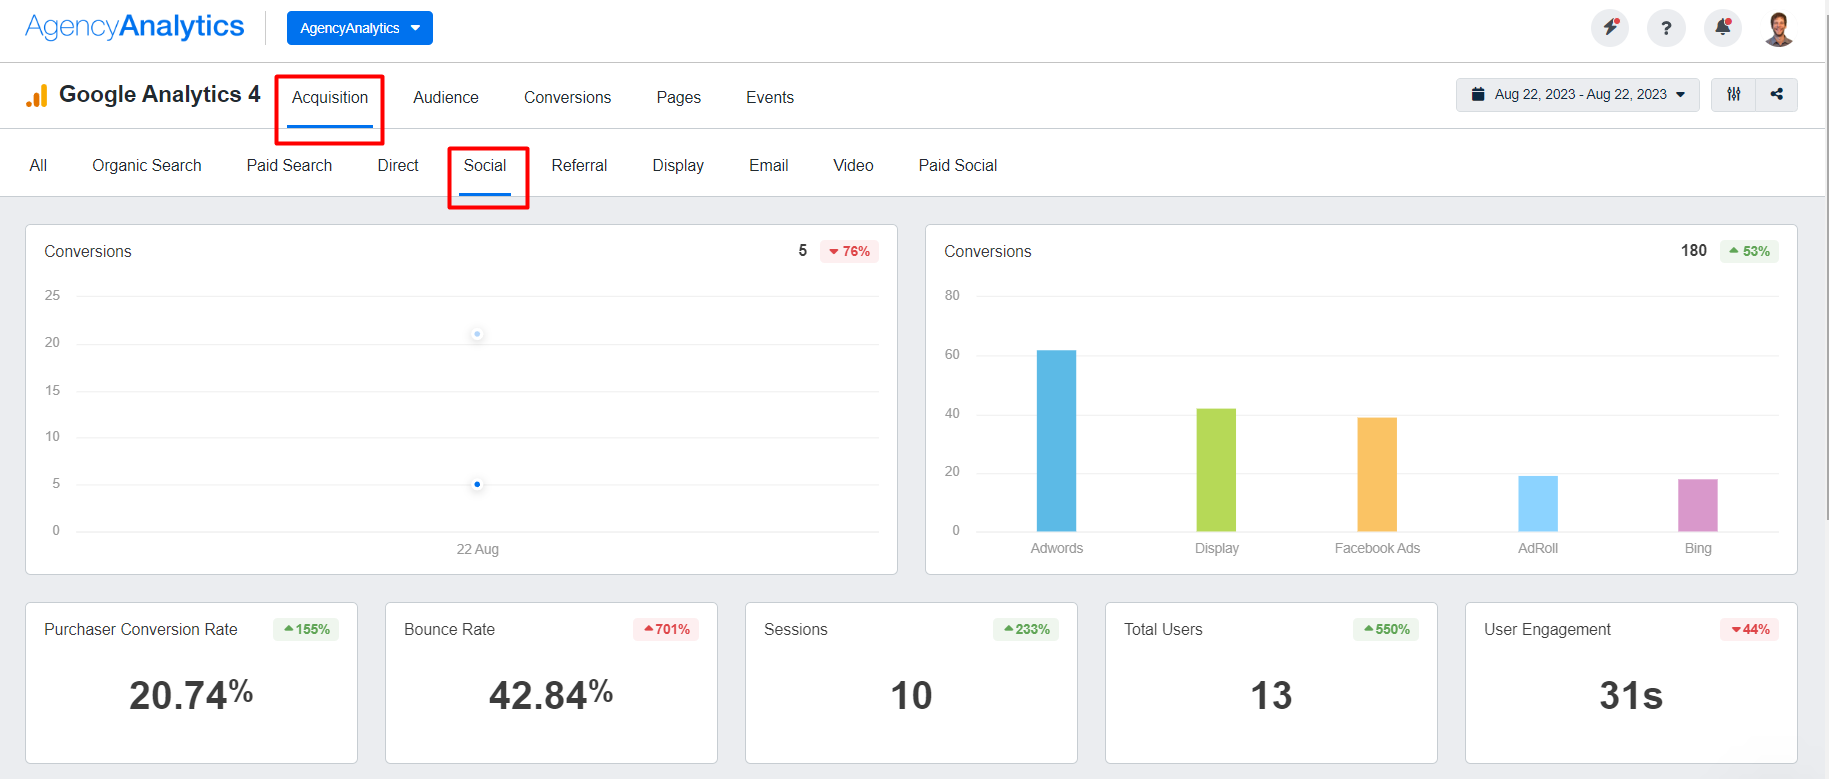
Use a Google Analytics dashboard to view referral traffic from Pinterest, analyze audience insights, and identify top-performing social media networks–start your free 14-day trial today.
8 Pinterest Metrics Your Agency Should Track
Now that you know how to access Pinterest analytics, let’s take a look at the top seven metrics to keep on your radar.
1. Pin Impressions
Pinterest impressions measure the total views of a Pin, offering key insights into content reach on this visual platform. Understanding impressions helps marketers analyze Pin performance and refine Pinterest strategies. After all, you don’t want to create Pins that aren’t seen by anyone!
Considering impressions on their own isn’t always a full indicator of performance, especially if your client is interested in more than visibility (like getting engagements, which we’ll cover next).
However, it’s still important to understand whether your client’s content is gaining traction or if any improvements are needed (e.g., using more compelling images or user-relevant keywords).
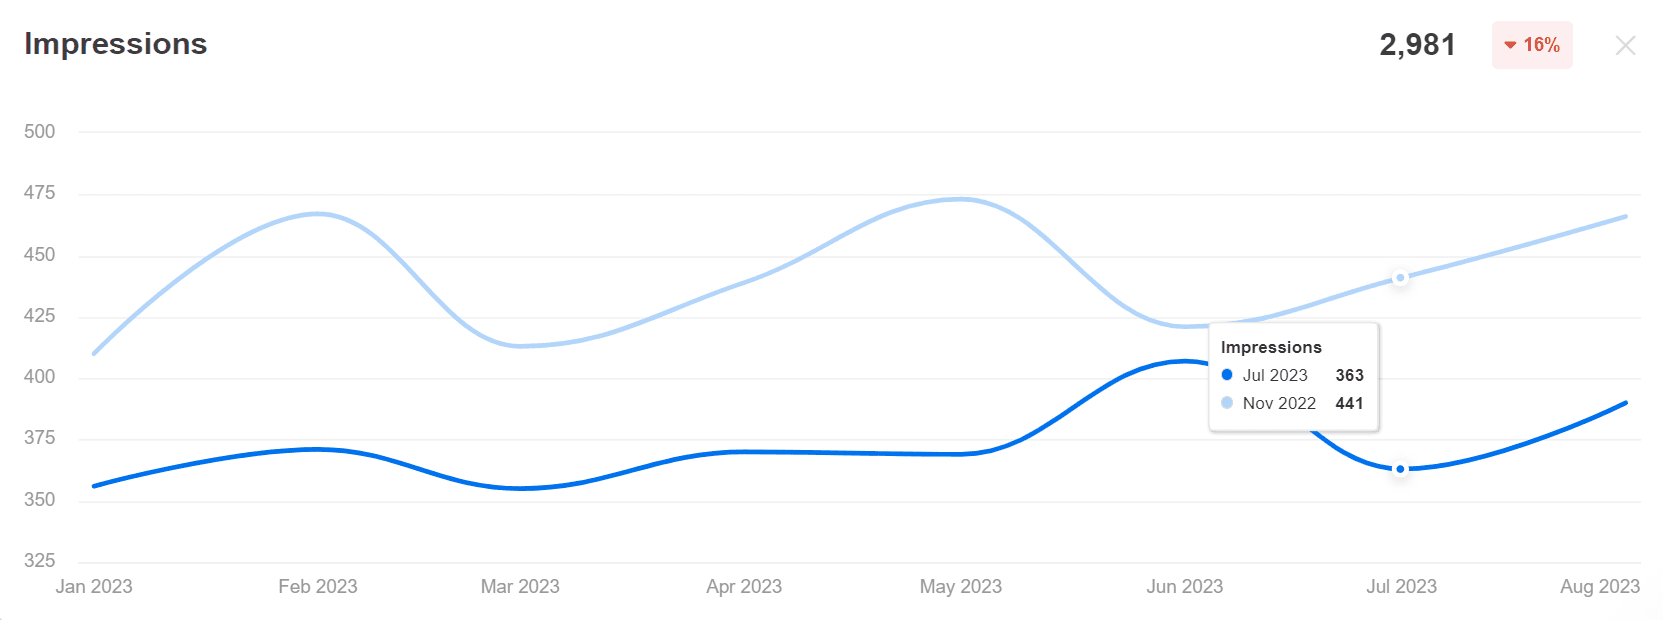
Track historical trends and use them to inform your client’s content strategy. Use Pinterest analytics to its full potential–stream data into visual dashboards and reports on AgencyAnalytics, free for 14 days.
On the other hand, Pinterest impressions may actually be the end goal for some clients. For example, newly launched brands may initially rely on boosting Pin visibility to build brand awareness. That’s why it’s important to define what Pinterest success looks like for each individual client.
When looking at metrics, it’s important to prioritize them based on the KPIs that are relevant to your client. For example, an e-commerce brand will be hyper-focused on conversions. In contrast, a local restaurant in the midst of launching may be looking for impressions and reach for awareness purposes. Always look at the number one thing that will help move the needle forward.
JC Polonia, Founder at Digitality Marketing
2. Engagements
To get a more granular understanding of how users interact with your client’s Pins, keep an eye on the Engagements metric. Identifying top Pins will help you to recreate that success for any future Pinterest strategy.
This metric includes the number of times Pinterest users have:
Saved or clicked on Pins
Visited outbound links from a call to action button
Swiped through images on carousels
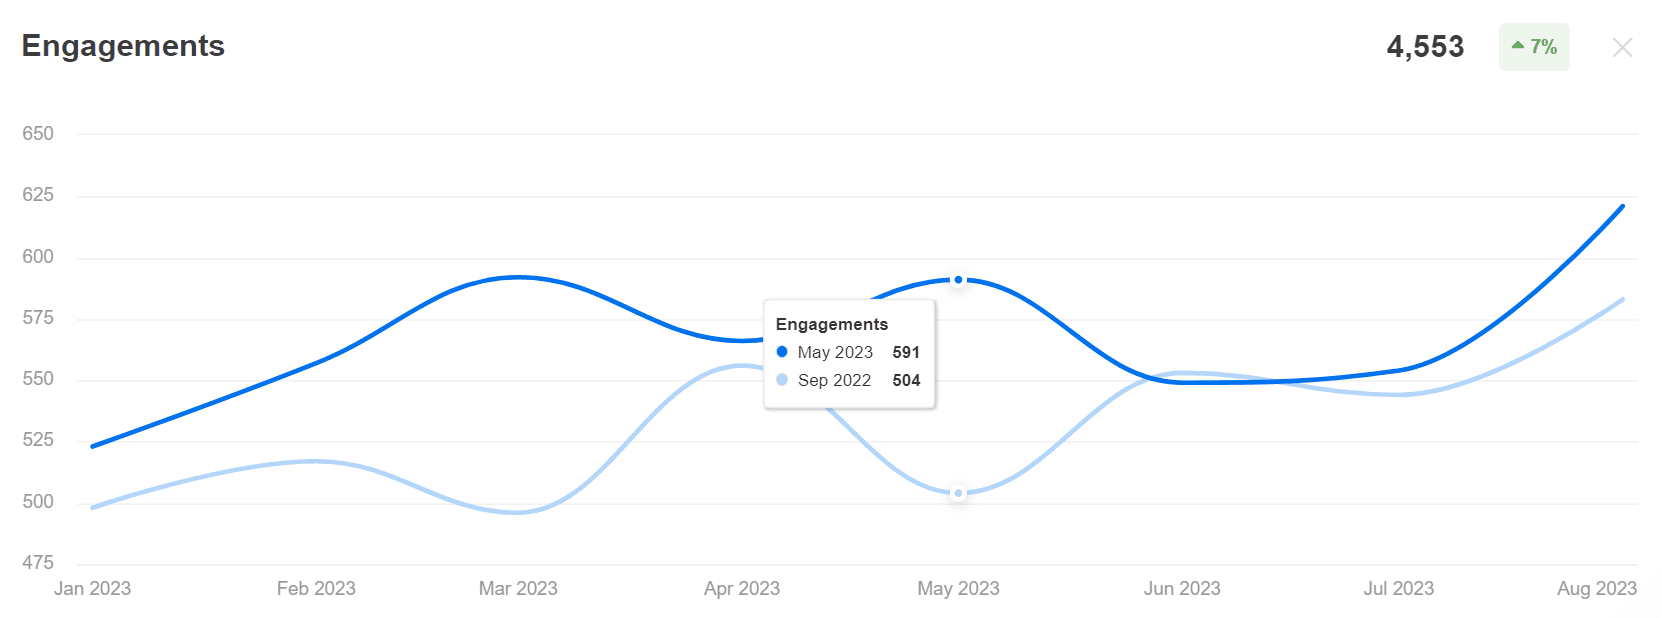
Lean on the numbers and use them to determine your clients’ top Pins. Filter Pinterest data into easy-to-understand data visualizations on AgencyAnalytics, free for 14 days.
Content with a high Pin engagement rate will also be prioritized by Pinterest’s algorithm and shown to relevant users. If you notice a low number of engagements, it may mean improvements are needed, such as:
Incorporating different photo angles
Refining Pin designs (e.g., using a more appealing text-to-visual ratio)
Using the optimal image sizes to get the most impressions and engagements possible
Creating more compelling and relevant headlines and descriptions
Remember–you want to keep Pinterest user attention for as long as possible. Ultimately, this will increase the chances of brand recognition, improve Pin performance, and move users further along the sales funnel.
If we're trying to sell a product, a good close-up of the product performs better. Also, if it's a "Lifestyle" type of ad, showing the use of the product, the more of the image we can show, the better of a story it tells, and the more engagement we get.
Nathan Hawkes, President of Arcane Marketing
3. Saves
Wondering how many people are adding your client’s Pins to their boards? Refer to the ‘Saves’ metric. If this number is steadily climbing, it means your client’s Pins are gaining momentum, so much so that Pinners want to view content later.
It’s also worth noting that Pinterest’s algorithm prioritizes saved content and shows it to users with similar interests. Racking up Saves means higher visibility, a growing engaged audience, and more popular Pins across multiple boards (woo-hoo!).
Plus, a high number of saved Pins validates that your client’s content is providing value (or at least sparking interest in some way).
4. Number of Followers
Use this metric to understand how many Pinterest users have followed your client’s brand or individual boards.
A steady increase in followers could:
Indicate that users find your client’s Pins, boards, or brand interesting
Serve as social proof that your client’s Pinterest account is reputable and worth following
Open the doors to partnerships (e.g., brand collaborations with influencers or industry-related peers)
Any dips in follower rate may mean a refresh is needed or perhaps creating Pins that are more relevant to your client’s audience.
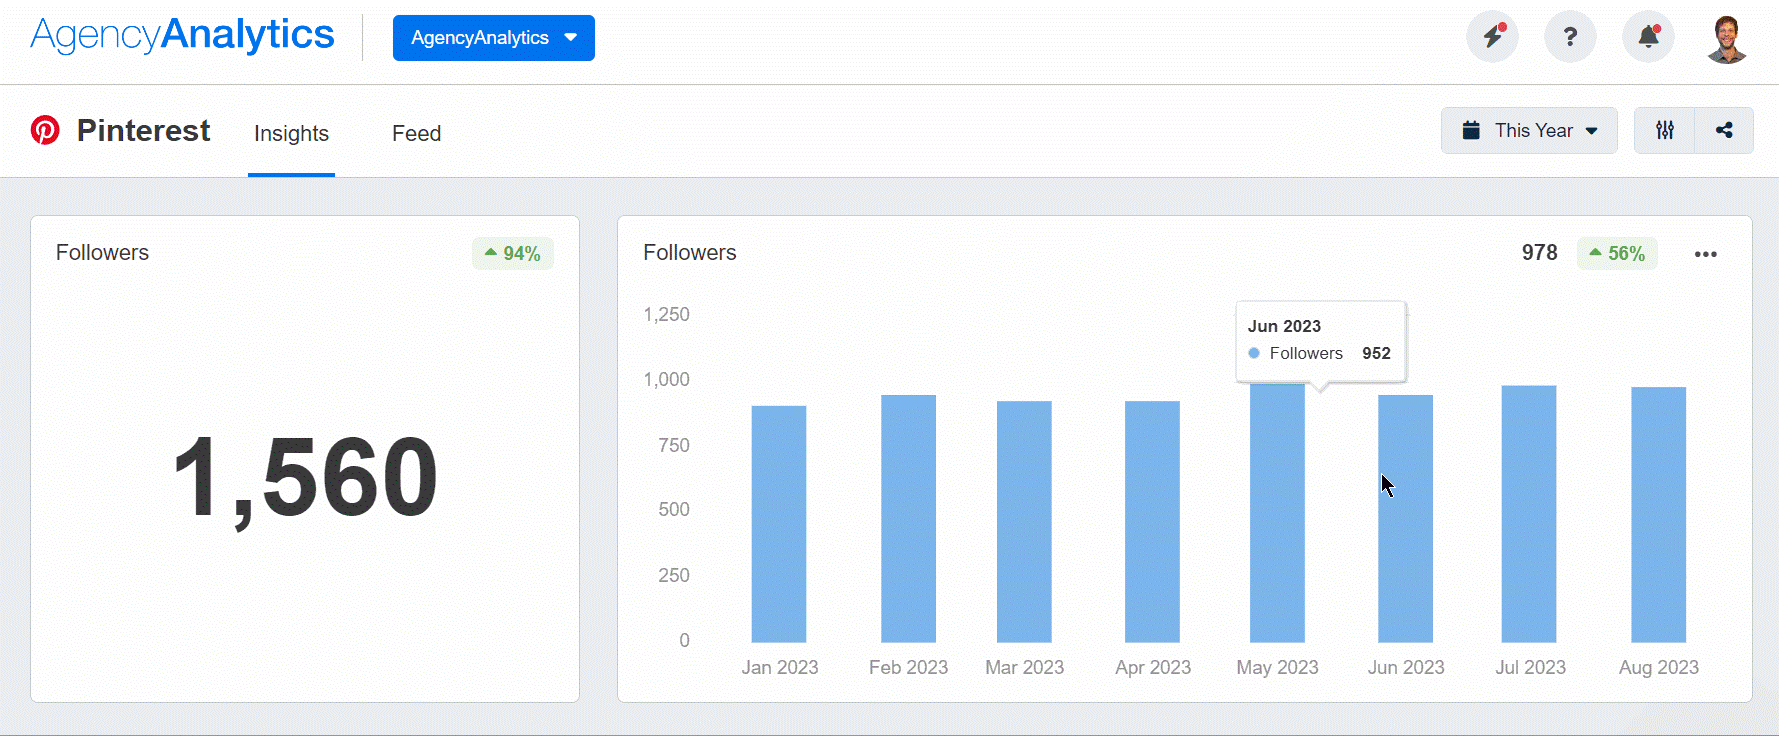
The numbers don’t lie. Keep tabs on follower growth rate to understand which Pins are making the most waves–monitor this insight and more on AgencyAnalytics, free for 14 days.
5. Pin Clicks
As the name suggests, this metric indicates how many users have taken action by clicking on one of your client’s Pins.
It doesn’t only refer to website link clicks. For example, Pin clicks may also include:
Viewing a static Pin more closely (e.g., zooming in on a recipe)
Clicking on a CTA button that goes to an outbound link (such as the ‘Read it’ button that goes to a related blog post)
Making an in-platform purchase (which is a feature you should take advantage of since Pinterest is a great social commerce avenue)
Even if you’ve got excellent traction and organic reach on Pinterest, sometimes a little oomph is needed. In that case, use Pinterest Ads to drive conversion rates, get more outbound clicks, and increase social media ROI.
Read more: A Complete Guide to Pinterest Ads for Digital Agencies
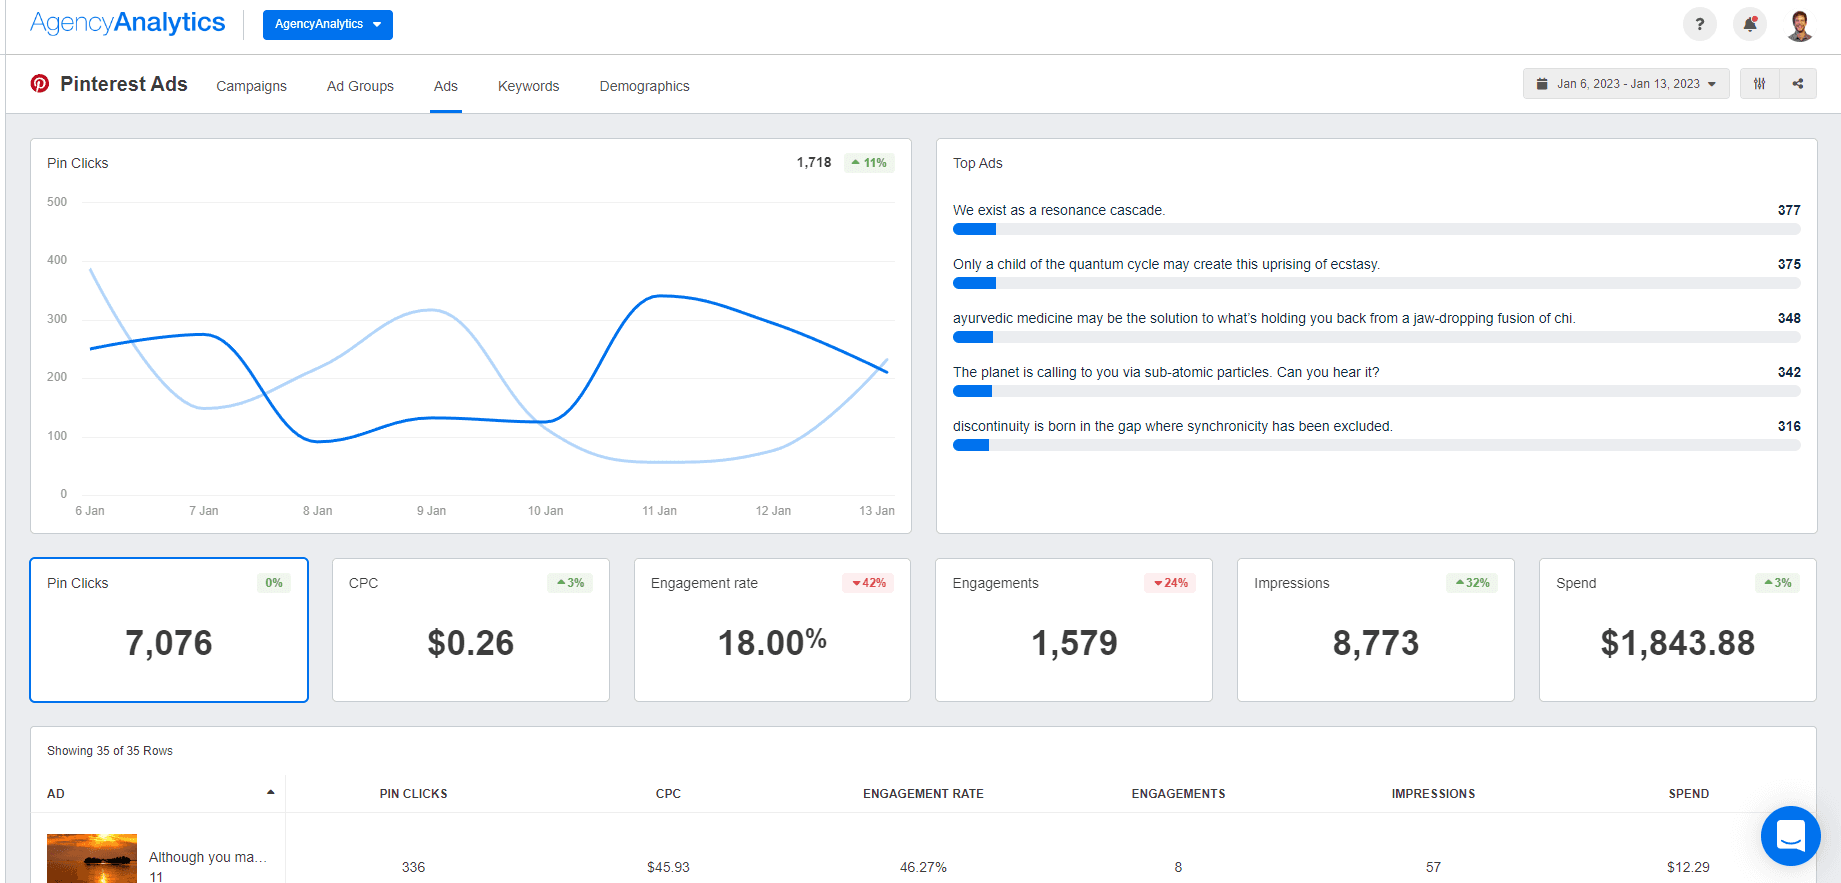
Need to understand the performance of promoted Pins? Monitor audience analytics, identify the top converting Pins, and ensure you’re reaching the right audience–try this exact Pinterest Ads dashboard on AgencyAnalytics, free for 14 days.
6. Video Views
This Pinterest metric collates how many views a video Pin got after being watched for 2 seconds or more, with at least half of the video on screen.
If you haven’t already, use Pinterest videos to present your client’s brand in an impactful way (and in the shortest time possible). Don’t take our word for it–consider that one billion videos are viewed on the platform daily, so these Pins are definitely worth the investment.
Video is the ultimate first impression of a product, brand, or concept! You can share information creatively in one short video, driving more engagement than any text or static visual. We're visual creatures–we absorb every element of a video in seconds to create a complete picture of a product, how it works, and whether it's what we're looking for.
Michelle van Blerck, Communications Manager at Digital Freak
7. Average Video Play Time
Average video play time measures how long users typically view your client’s videos.
Obviously, longer video play times are desirable. Longer video play times mean your client’s video content has captured user attention for a sustained period. If you notice a low number, keep in mind that:
Pinterest suggests video Pins between 6 - 15 seconds for maximum impact
Users may not always listen to audio, so include captions on these Pins where applicable
Storytelling and high-resolution imagery are a must
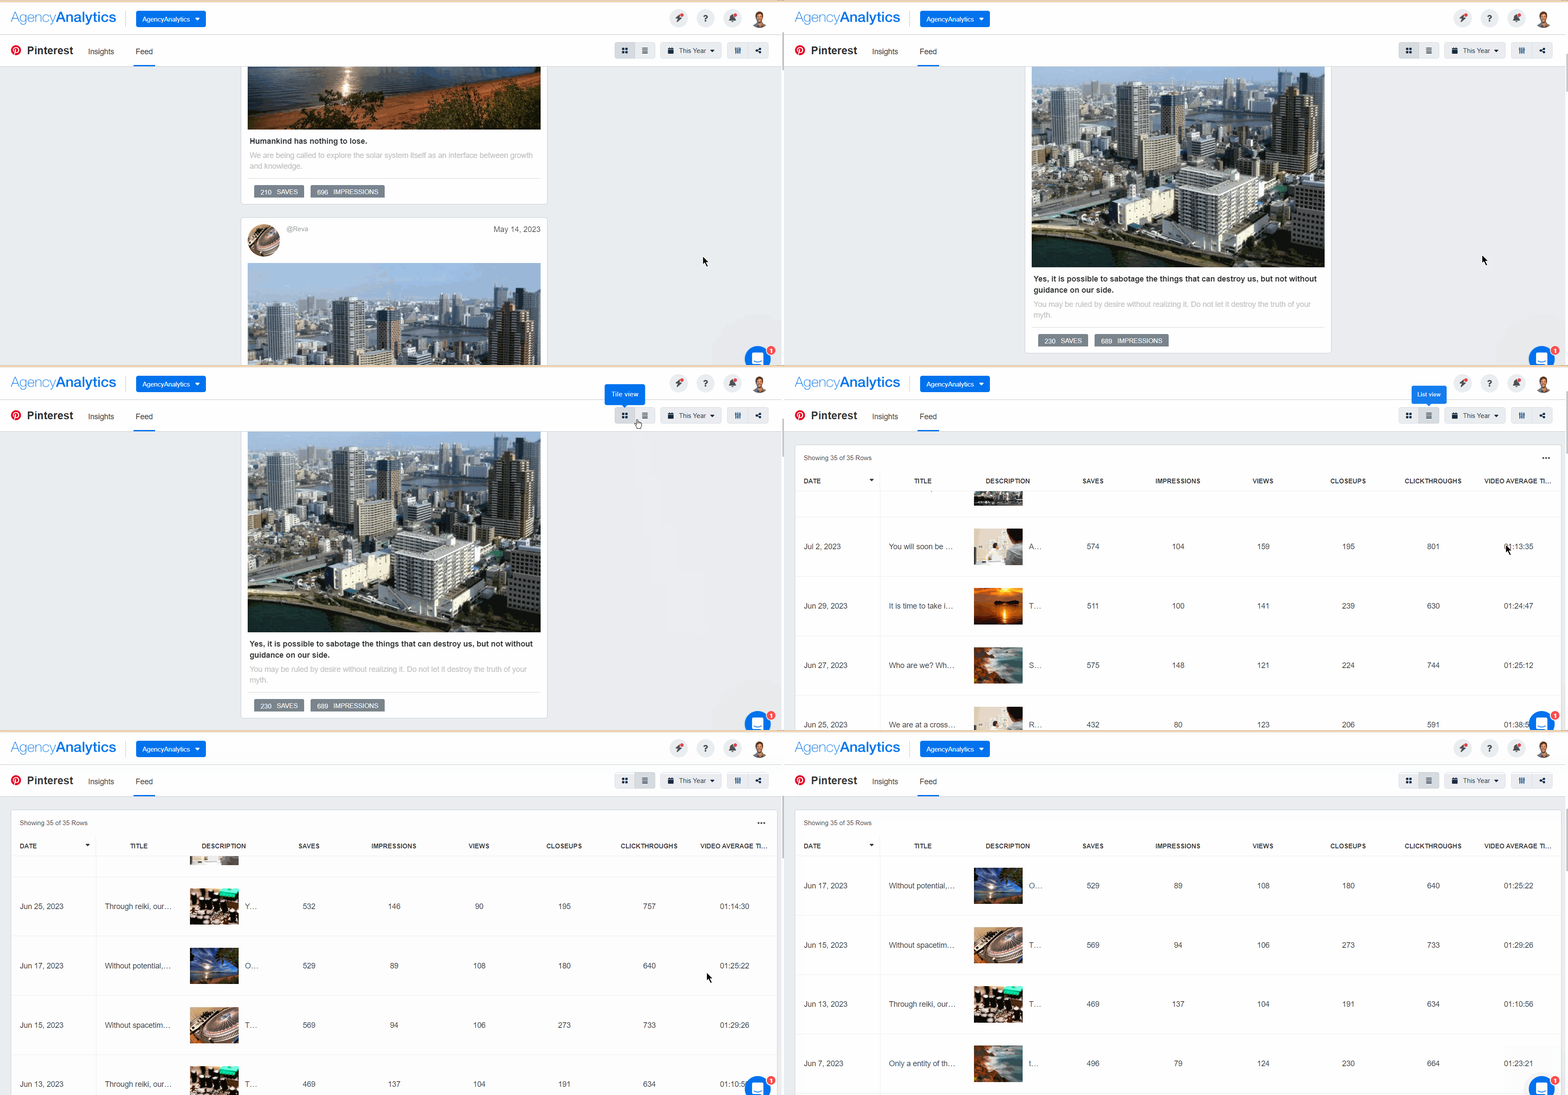
Quickly switch from your client’s live Pinterest feed to a more granular metric breakdown of individual Pins–it’s free for 14 days on AgencyAnalytics.
8. Conversions
If your clients are focused on generating user action from Pinterest, tracking conversion insights will be a top priority. That way, you’ll understand the effectiveness of your client’s Pinterest efforts and whether they’re resulting in significant ROI.
Keep in mind that this in-platform feature is currently in Beta, so there may be changes over time. To access conversion insights, you must have a Pinterest tag installed on your client’s website, in addition to a Pinterest Advertising account.
Want to view the number of website conversions across multiple social media sources (not just Pinterest)? Simply populate that data into a Google Analytics dashboard for a quick, easy-to-understand data visualization.
The Types of Conversion Metrics on Pinterest
Once you’ve put all these steps in place, you’ll have access to conversion insights for organic and paid Pins. To get started, go to the drop-down menu under ‘Performance over time’ and review metrics like:
Revenue: How much revenue your client’s Pins generated
Page Visits: The number of times users visit your client’s website after interacting with their Pinterest content
Add to Cart: The number of times your client’s products were added to a shopping cart as a result of Pinterest
Checkouts: The number of times a checkout happened as a result of Pinterest interaction
Average Order Value: The average amount a customer spends on a Pinterest-influenced transaction
If you’re noticing a healthy number of clicks from Pinterest but marginal conversion metrics, it may mean that website optimization is needed (e.g., fixing a slow page loading time). It could also suggest that you should improve website copy or even make the checkout process faster.
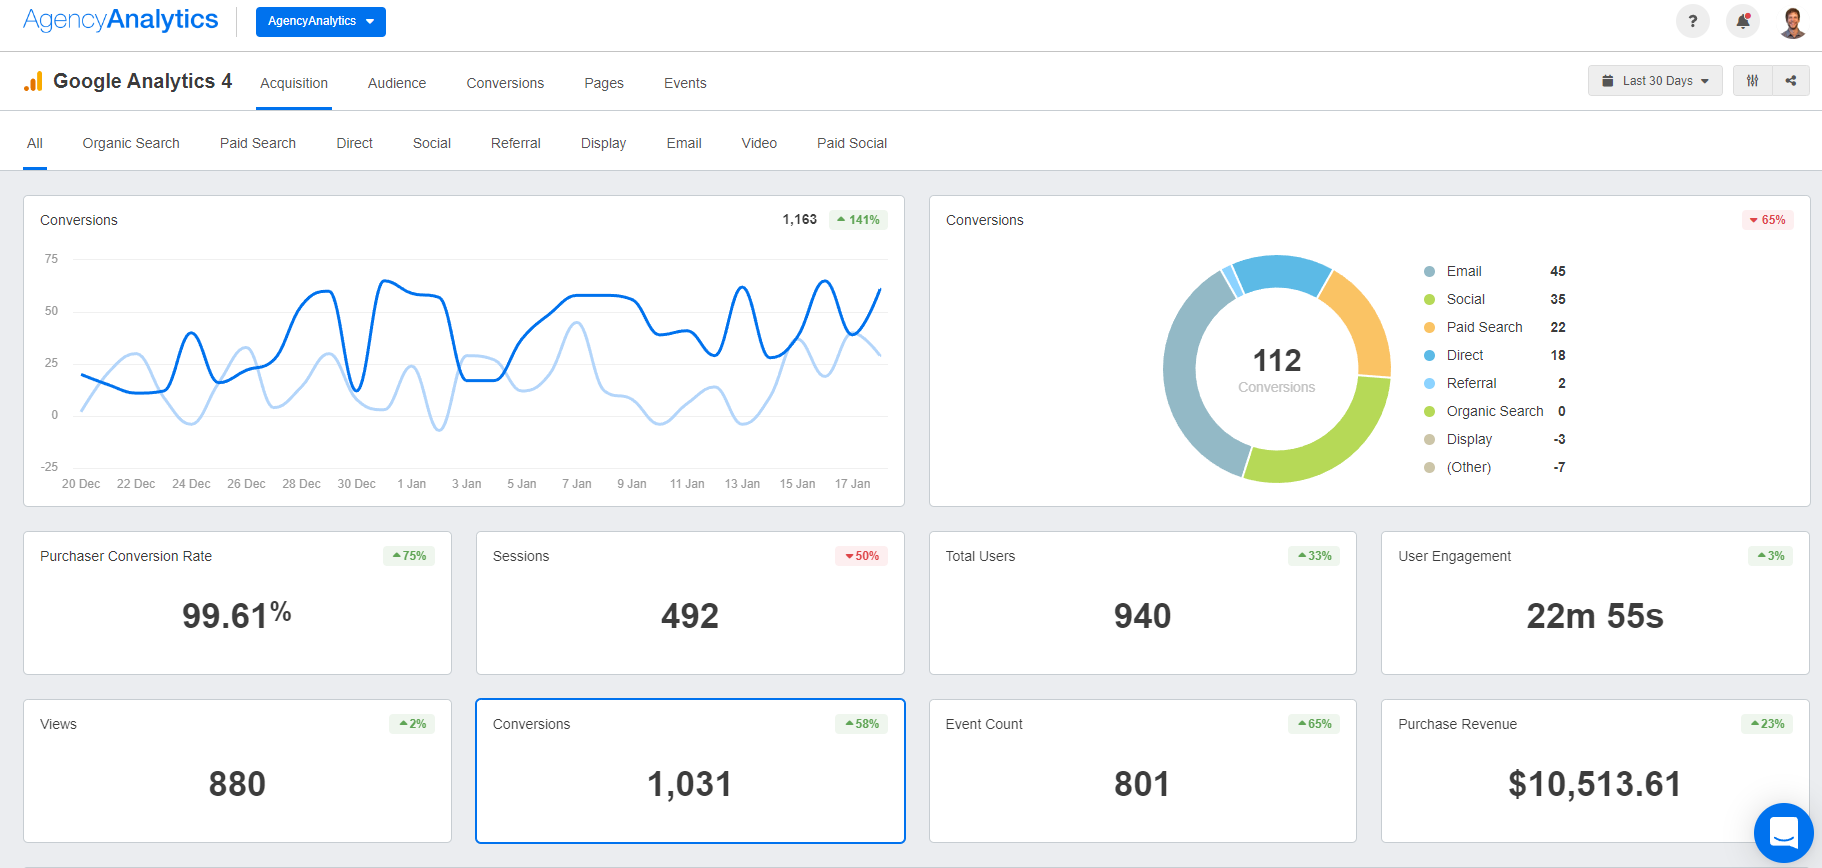
Connect the Google Analytics 4 reporting integration to include traffic, engagement, and conversion metrics for all of your Pinterest clients. Try AgencyAnalytics free for 14 days!
Go Beyond Tracking In-Platform Pinterest Analytics
While you can access in-platform Pinterest analytics, it isn’t the most time-efficient solution when juggling multiple clients with multiple social media analytics to track.
When the end of the month rolls around, you don’t want to scramble or rely on outdated manual reporting methods (like copying and pasting into an Excel spreadsheet).
Luckily, you don’t have to–just use Pinterest analytics tools to pull your clients’ data into a centralized reporting hub and monitor those insights in one place.
How To Pull Pinterest Data and Create a Customized Report on AgencyAnalytics
Using an automated client reporting tool like AgencyAnalytics will help you to produce professional, white-labeled reports quickly. Because it includes marketing integrations from over 80 platforms, you’ll get a comprehensive reporting solution that covers all the bases (not just Pinterest).
If you’re ready to take that leap, here’s how to get started with creating a report.
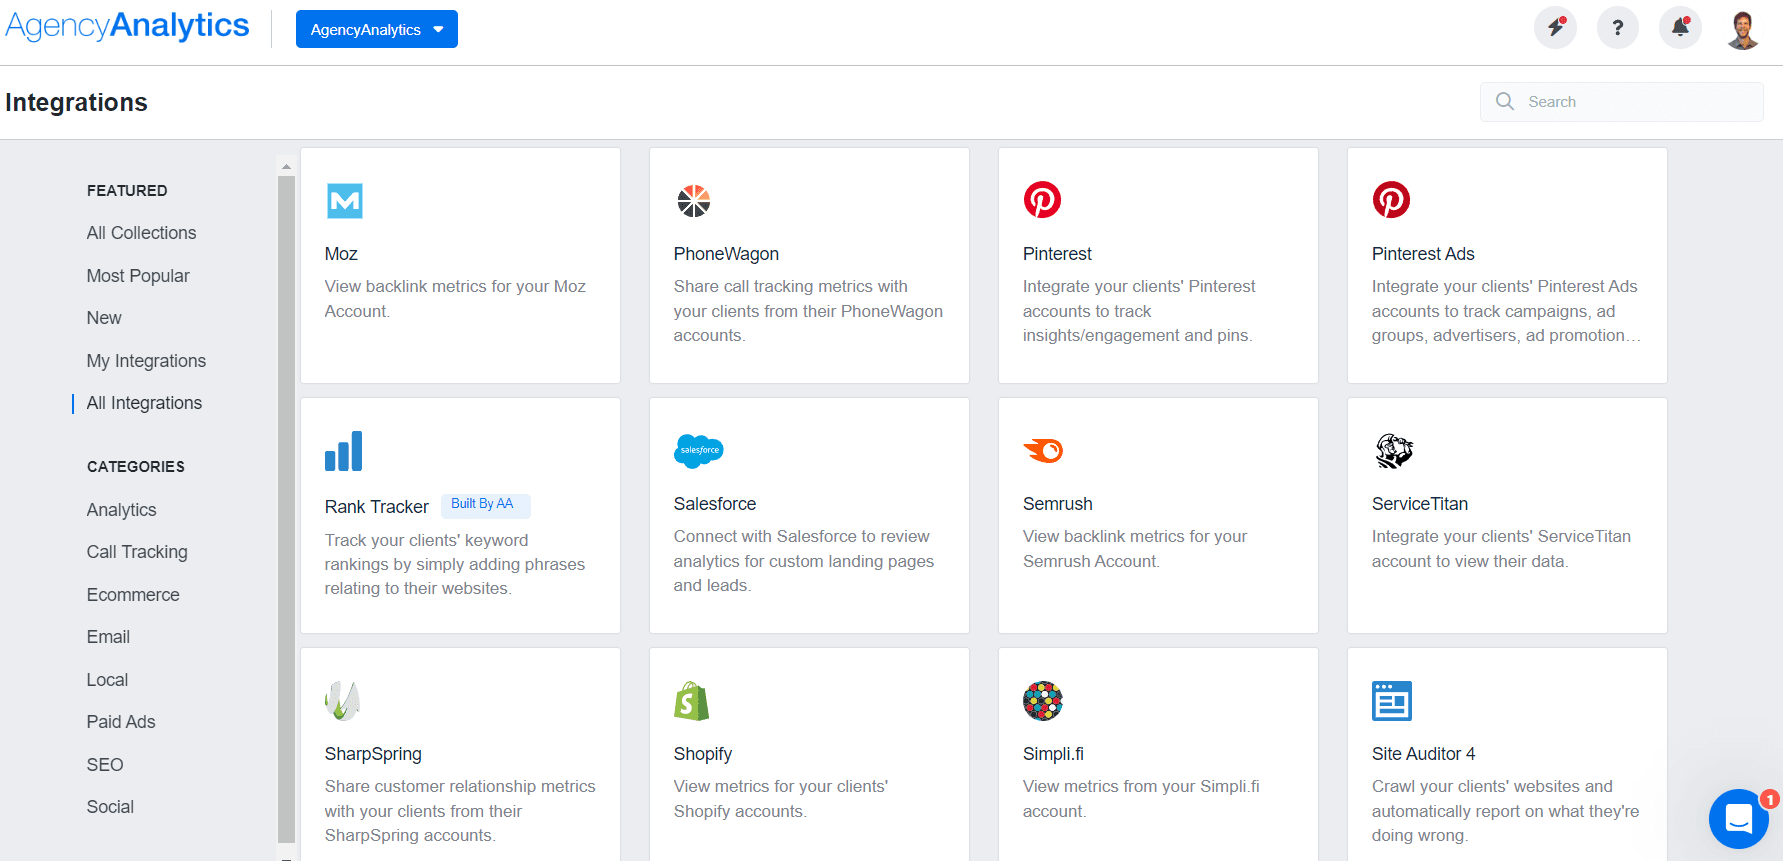
1. Link Pinterest to Your AgencyAnalytics Account
After signing into your AgencyAnalytics account:
Head to ‘Integrations’ from the left-hand menu
Find Pinterest under ‘All Integrations’ or ‘Social’
Click on ‘Connect’
2. Populate Data Into a Dashboard or Report Template
After successfully connecting the integration, it’s time for the fun stuff–populating your client’s Pinterest data into a dashboard or report.
Going with a dashboard is helpful if you want to monitor changes internally and make any ongoing campaign changes (e.g., improving the visual for a marginally performing Pin). You may also want to keep clients in the loop by granting 24/7 login access to their real-time dashboard data.
In this scenario, you’ve got a few options, such as:
Choosing a pre-built Pinterest Analytics dashboard
Using a more general dashboard if you’re reporting on marketing campaigns from other platforms (e.g., an all-in-one social media dashboard)
Building your own custom dashboard that’s a blend of different metric types. It’s as simple as:
Dragging and dropping widgets for greater visual clarity (e.g., sharing website analytics alongside Pinterest insights)
Adding annotations for more context (e.g., pointing out high-performing Pins that led to increased website traffic)
Using custom metrics that reflect your clients’ goals (e.g., calculating total website views generated from Pinterest and other social media sources)
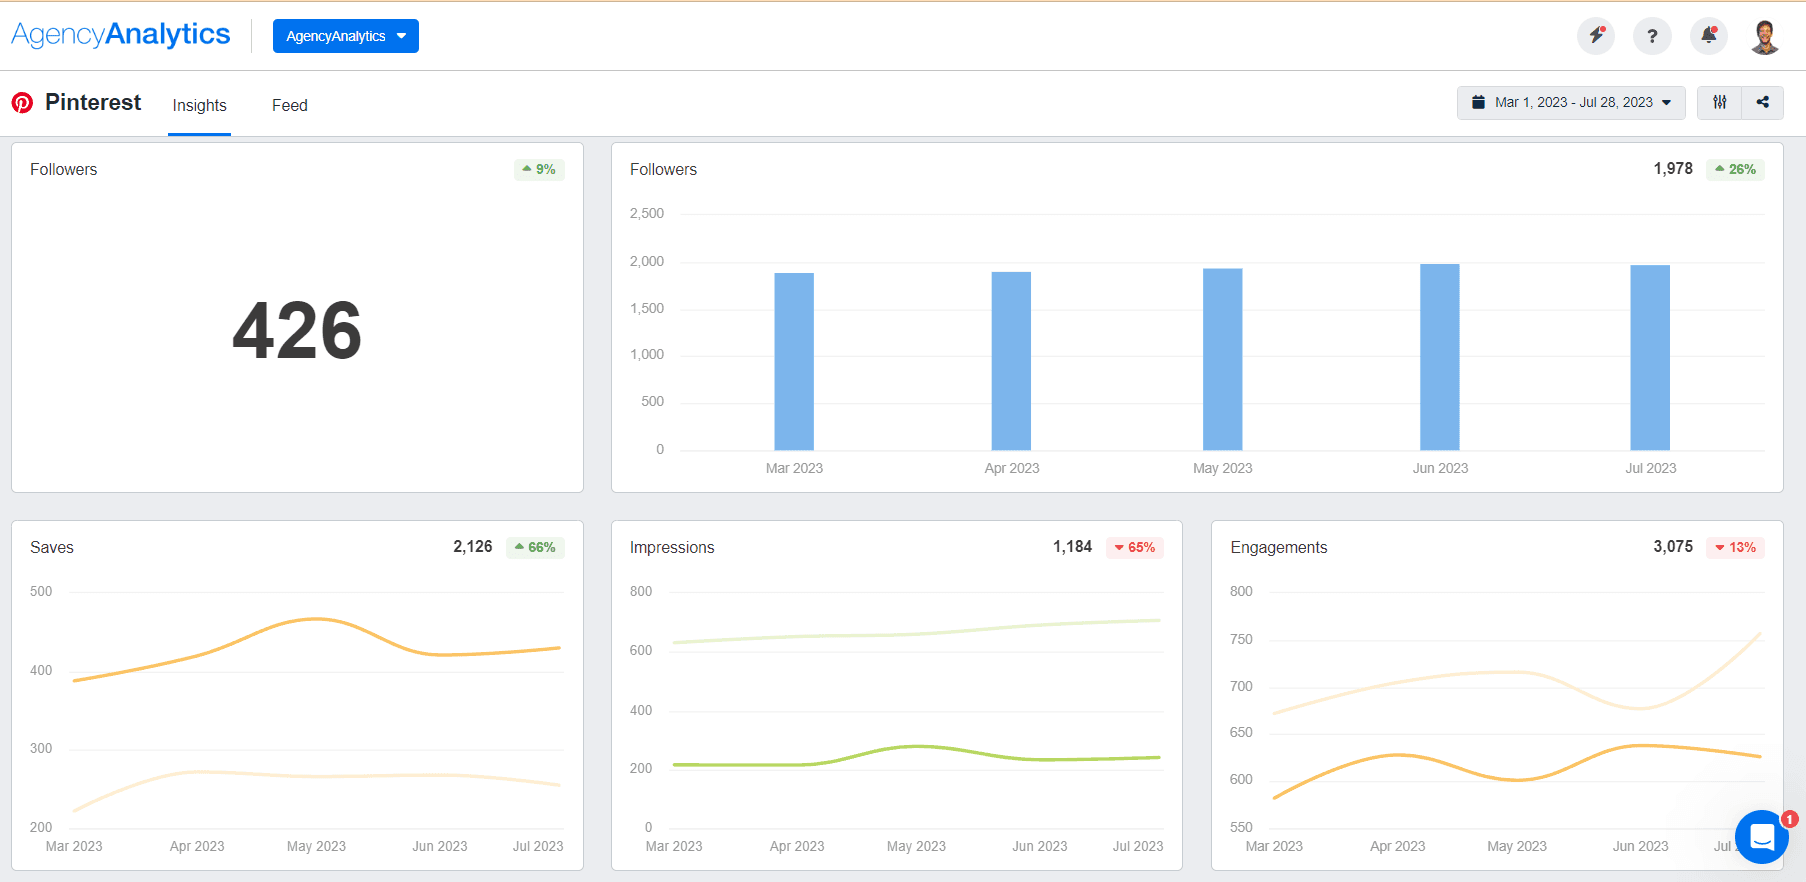
Use Pinterest data to fine-tune your clients’ marketing strategies and give informed recommendations–start your free 14-day trial of AgencyAnalytics today.
3. Flip a Dashboard Into a Report in Seconds
What if you’ve got a dashboard and want to create a report out of it? No need to worry–you don’t have to choose sides in the dashboard vs. report debate.
With AgencyAnalytics, it’s as simple as clicking on the ‘Share’ icon at the top right-hand corner of your dashboard. From there, you’ll be able to:
Download your dashboard as a PDF document,
Send your dashboard as a report via email, or
Create a shareable link with a report (which also comes with a customizable date range and an option to download)
A readymade marketing report template makes it easy to pull all the data you need in just a few clicks. No matter what format your clients prefer, you’ve got options!
Go Beyond the Surface by Tracking Pinterest Analytics
Pinterest is a vibrant visual platform that bolsters brand awareness, presents your client’s brand aesthetically, and enhances the overall brand discovery experience.
To get the most out of this platform, your agency must go the extra mile to provide a Pinterest analytics overview and share tangible results with clients. From increasing outbound clicks to monitoring top boards, you must understand Pinterest analytics to really move the needle.
Instead of wasting billable time logging into Pinterest Analytics each time you’re running a campaign, streamline your entire client reporting process. With AgencyAnalytics, you won’t have to worry about creating dashboards and reports manually or even fetching data by hand–we’ll do the heavy lifting for you.
Demonstrate your value by monitoring in-depth Pinterest analytics, streaming data into a professional format, and providing the context your clients need to make informed decisions.
Easily integrate data from over 80 marketing platforms into visual dashboards and reports. Invest in the client reporting tool made for agencies like you, free for 14 days.

Written by
Faryal Khan is a multidisciplinary creative with 10+ years of experience in marketing and communications. Drawing on her background in statistics and psychology, she fuses storytelling with data to craft narratives that both inform and inspire.
Read more posts by Faryal KhanSee how 7,000+ marketing agencies help clients win
Free 14-day trial. No credit card required.


