Table of Contents
QUICK SUMMARY:
Social media reporting shouldn’t be a hassle. In this essential guide, we’ll show you exactly what a comprehensive social media marketing report should include. Plus, we’ve included free, ready-to-use templates to start tracking crucial social media KPIs right away and make your reporting process smoother, faster, and more reliable.
Ever feel like social media reports are eating up your week? There’s a better, smarter way to streamline the process—without losing your weekends or your sanity.
Report templates don’t just save time—they ensure your social media reports highlight the metrics that matter most to clients while surfacing actionable insights you might have otherwise missed.
No more second-guessing what to include or scrambling to remember what goes where—templates keep things clear, concise, and easy for clients to understand. A solid template keeps reporting consistent, client-friendly, and tuned into what matters most—especially when navigating complex social media analytics.
At the end of the day, templates remove the guesswork from reporting and help your marketing team focus on optimization opportunities.
Say goodbye to the old report-building hassles and say hello to the power of social media reporting templates. Your clients (and your sanity) will thank you for it.
Ready to simplify social media reporting? Let’s explore how to build client-friendly social media reports that save time and make your agency shine.
What is a social media reporting?
Social media reporting is the process of collecting, analyzing, and presenting data from social media platforms to evaluate performance, track KPIs, and communicate results to stakeholders. It’s how agencies and marketing teams translate raw platform data into insights that guide strategy and prove ROI.
A social media performance report is kind of like a victory lap for a client's social media campaigns. It helps agencies and businesses understand what’s working across their social media channels—and where there’s room to improve. Whether it’s tracking clicks, impressions, or engagement metrics, it’s all about turning data into action.
Why does an agency need to send digital marketing reports to clients?
While platforms like Instagram and LinkedIn offer a flood of metrics, a strong social media reporting process distills those numbers into a clear narrative. The goal is to communicate value without overwhelming clients—by focusing on the metrics that matter to their business.
A good template should display key metrics that matter most to a client’s business goals. Whether it's meant for brand awareness, website traffic, or lead generation, the report should highlight the social media data points that demonstrate progress toward social media objectives.
Done right, social media reporting helps clients see where they’ve been, how they’re performing now, and what steps will drive better results moving forward.
Key metrics to include in custom social media reporting
Social media reporting works best when it’s grounded in accurate data. But with so many metrics available across platforms, it’s important to zero in on what actually matters. The following metrics help agencies track social media performance, uncover actionable insights, and show clients how their investment is paying off.
1. Followers and subscriber growth — A growing, engaged audience
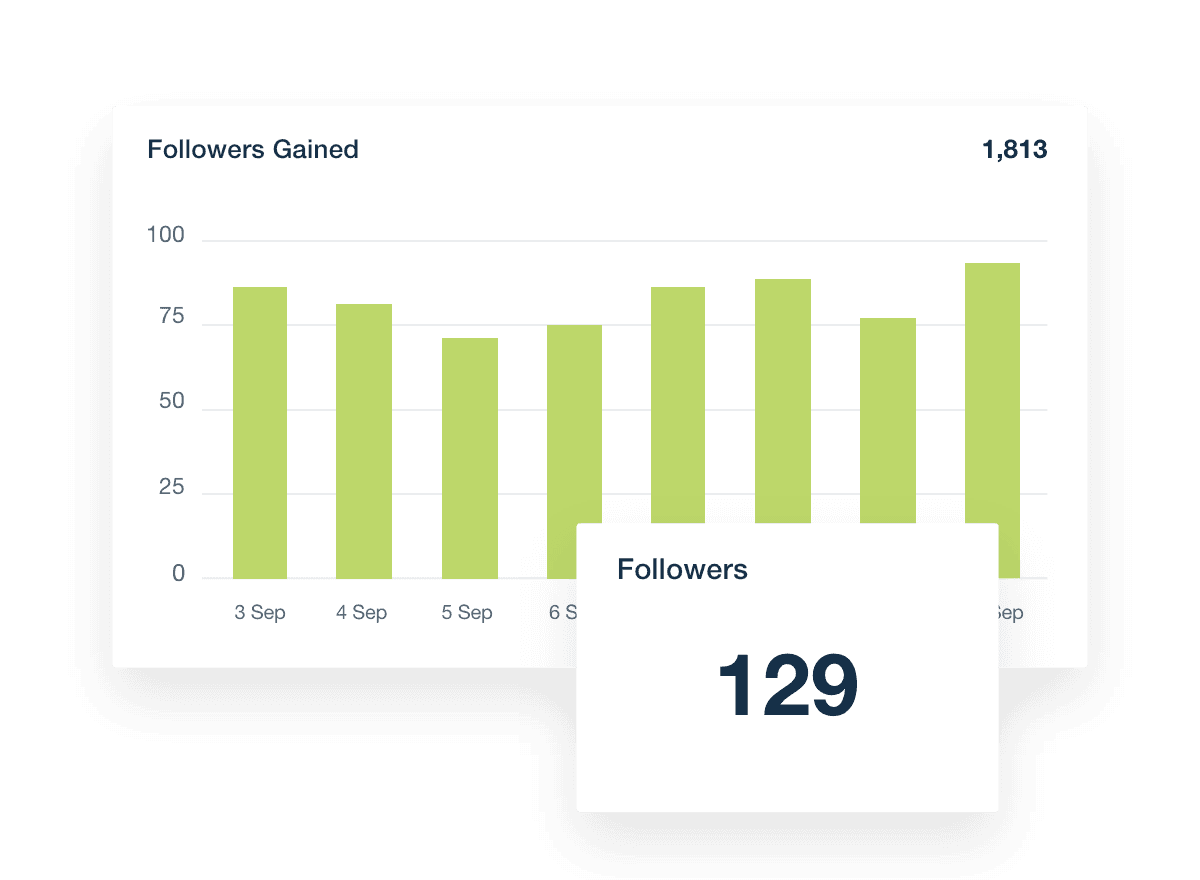
While often labeled a vanity metric, tracking follower growth still plays an important role in evaluating reach and audience expansion—especially across fast-moving social media platforms like Instagram or TikTok.
The key is not the number alone, but the trend over time and how it correlates with social media posts and campaign efforts.
2. Conversions from social media — Proof your strategy is working
If your client’s goal is ROI, you’ll want to highlight how social media efforts drive conversions. Use tools like Google Analytics to track actions such as purchases, form fills, or signups that originate from social media channels. This shows clients real value—and gives your team actionable insights to optimize future campaigns.
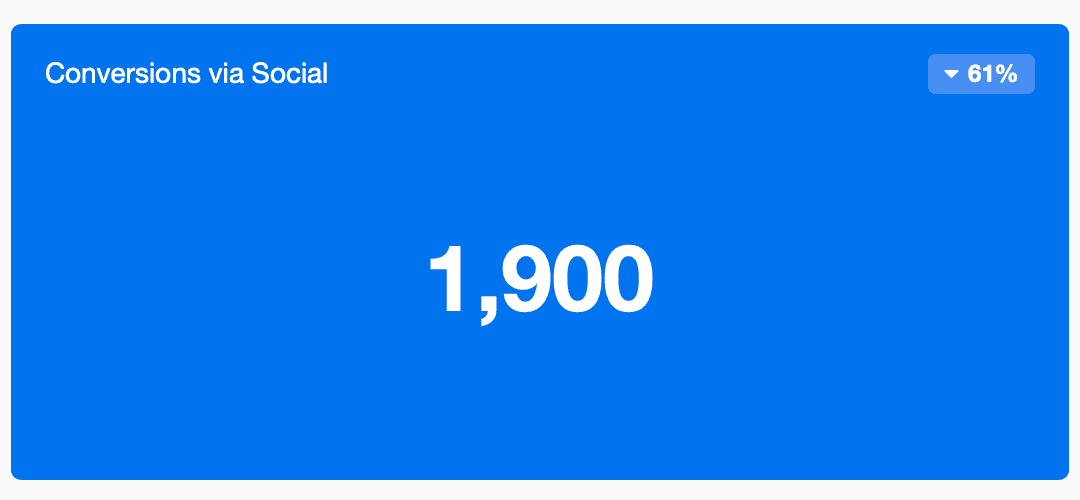
3. Website traffic from social channels — How users are moving from scroll to site
Tracking how much website traffic comes from platforms like Facebook, LinkedIn, or X (formerly Twitter) helps measure whether your social media strategy is driving clicks—and if your CTAs are landing. Combine this with conversion data to connect social interactions with business outcomes.
As you may know, a portion of social traffic in Google Analytics will come from people clicking on the link in your client’s bio, although the majority often comes from each post’s CTA telling people where to go next.

4. Comments and post-level feedback — Direct signals of engagement and interest
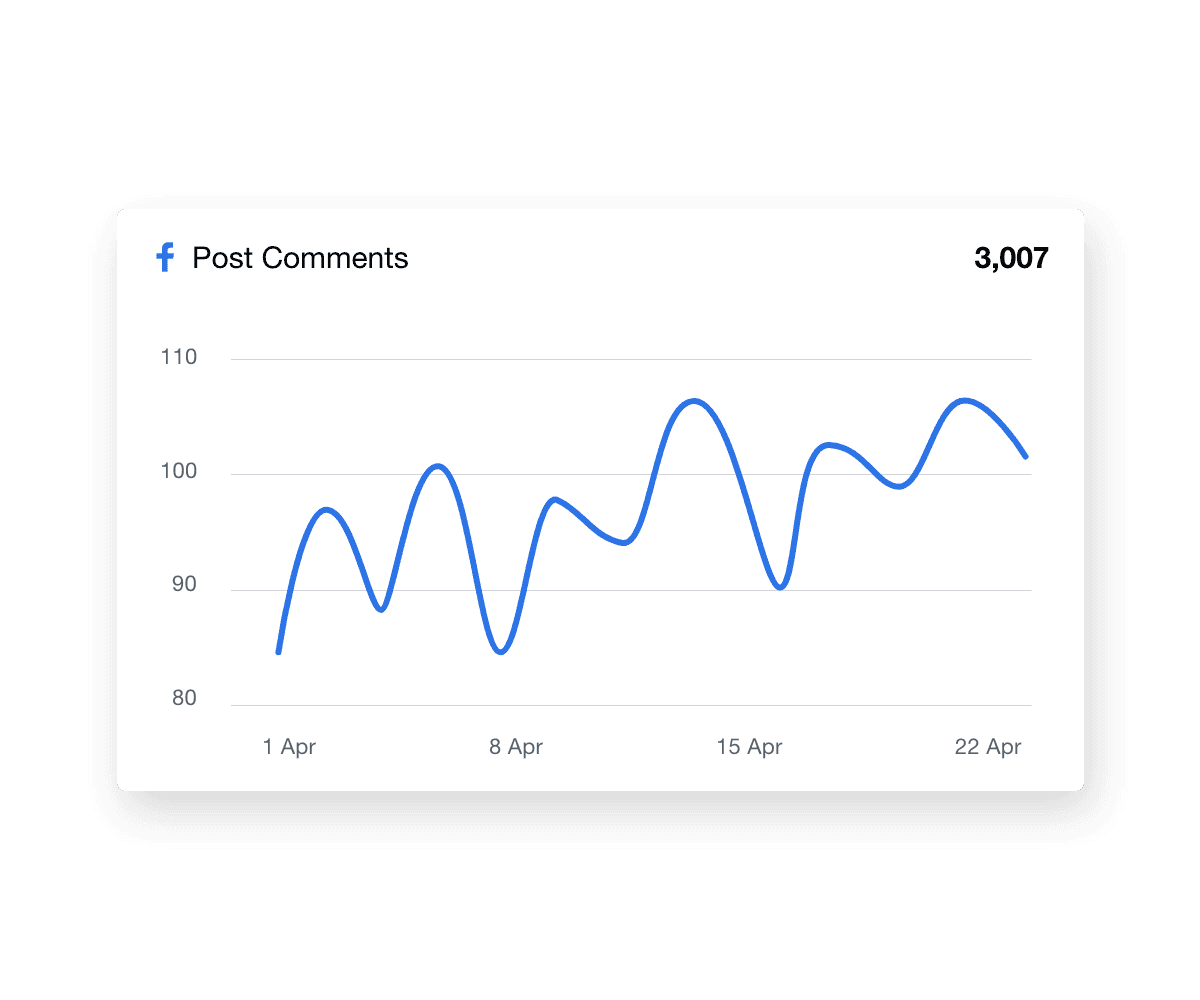
Comments offer context beyond numbers—they show how your audience is engaging with your message. This is especially helpful when reviewing performing posts and identifying trends in audience behavior. Use this data to fine-tune tone, content types, or timing for stronger future results.
5. Likes and reactions — Quick feedback on what’s resonating
While likes aren’t the most strategic metric on their own, they’re a quick pulse check for engagement. If likes drop on certain types of content, it may be time to revisit your content strategy or refresh your visual approach.

6. Post and video publishing volume — Visibility into output and consistency
Tracking the number of published social media posts or videos helps demonstrate consistency and deliverable fulfillment—especially for agencies managing posting cadence under retainer. It’s a quick way to prove you’re executing on schedule.
7. Feed preview of published content — Visual overview of what’s gone live
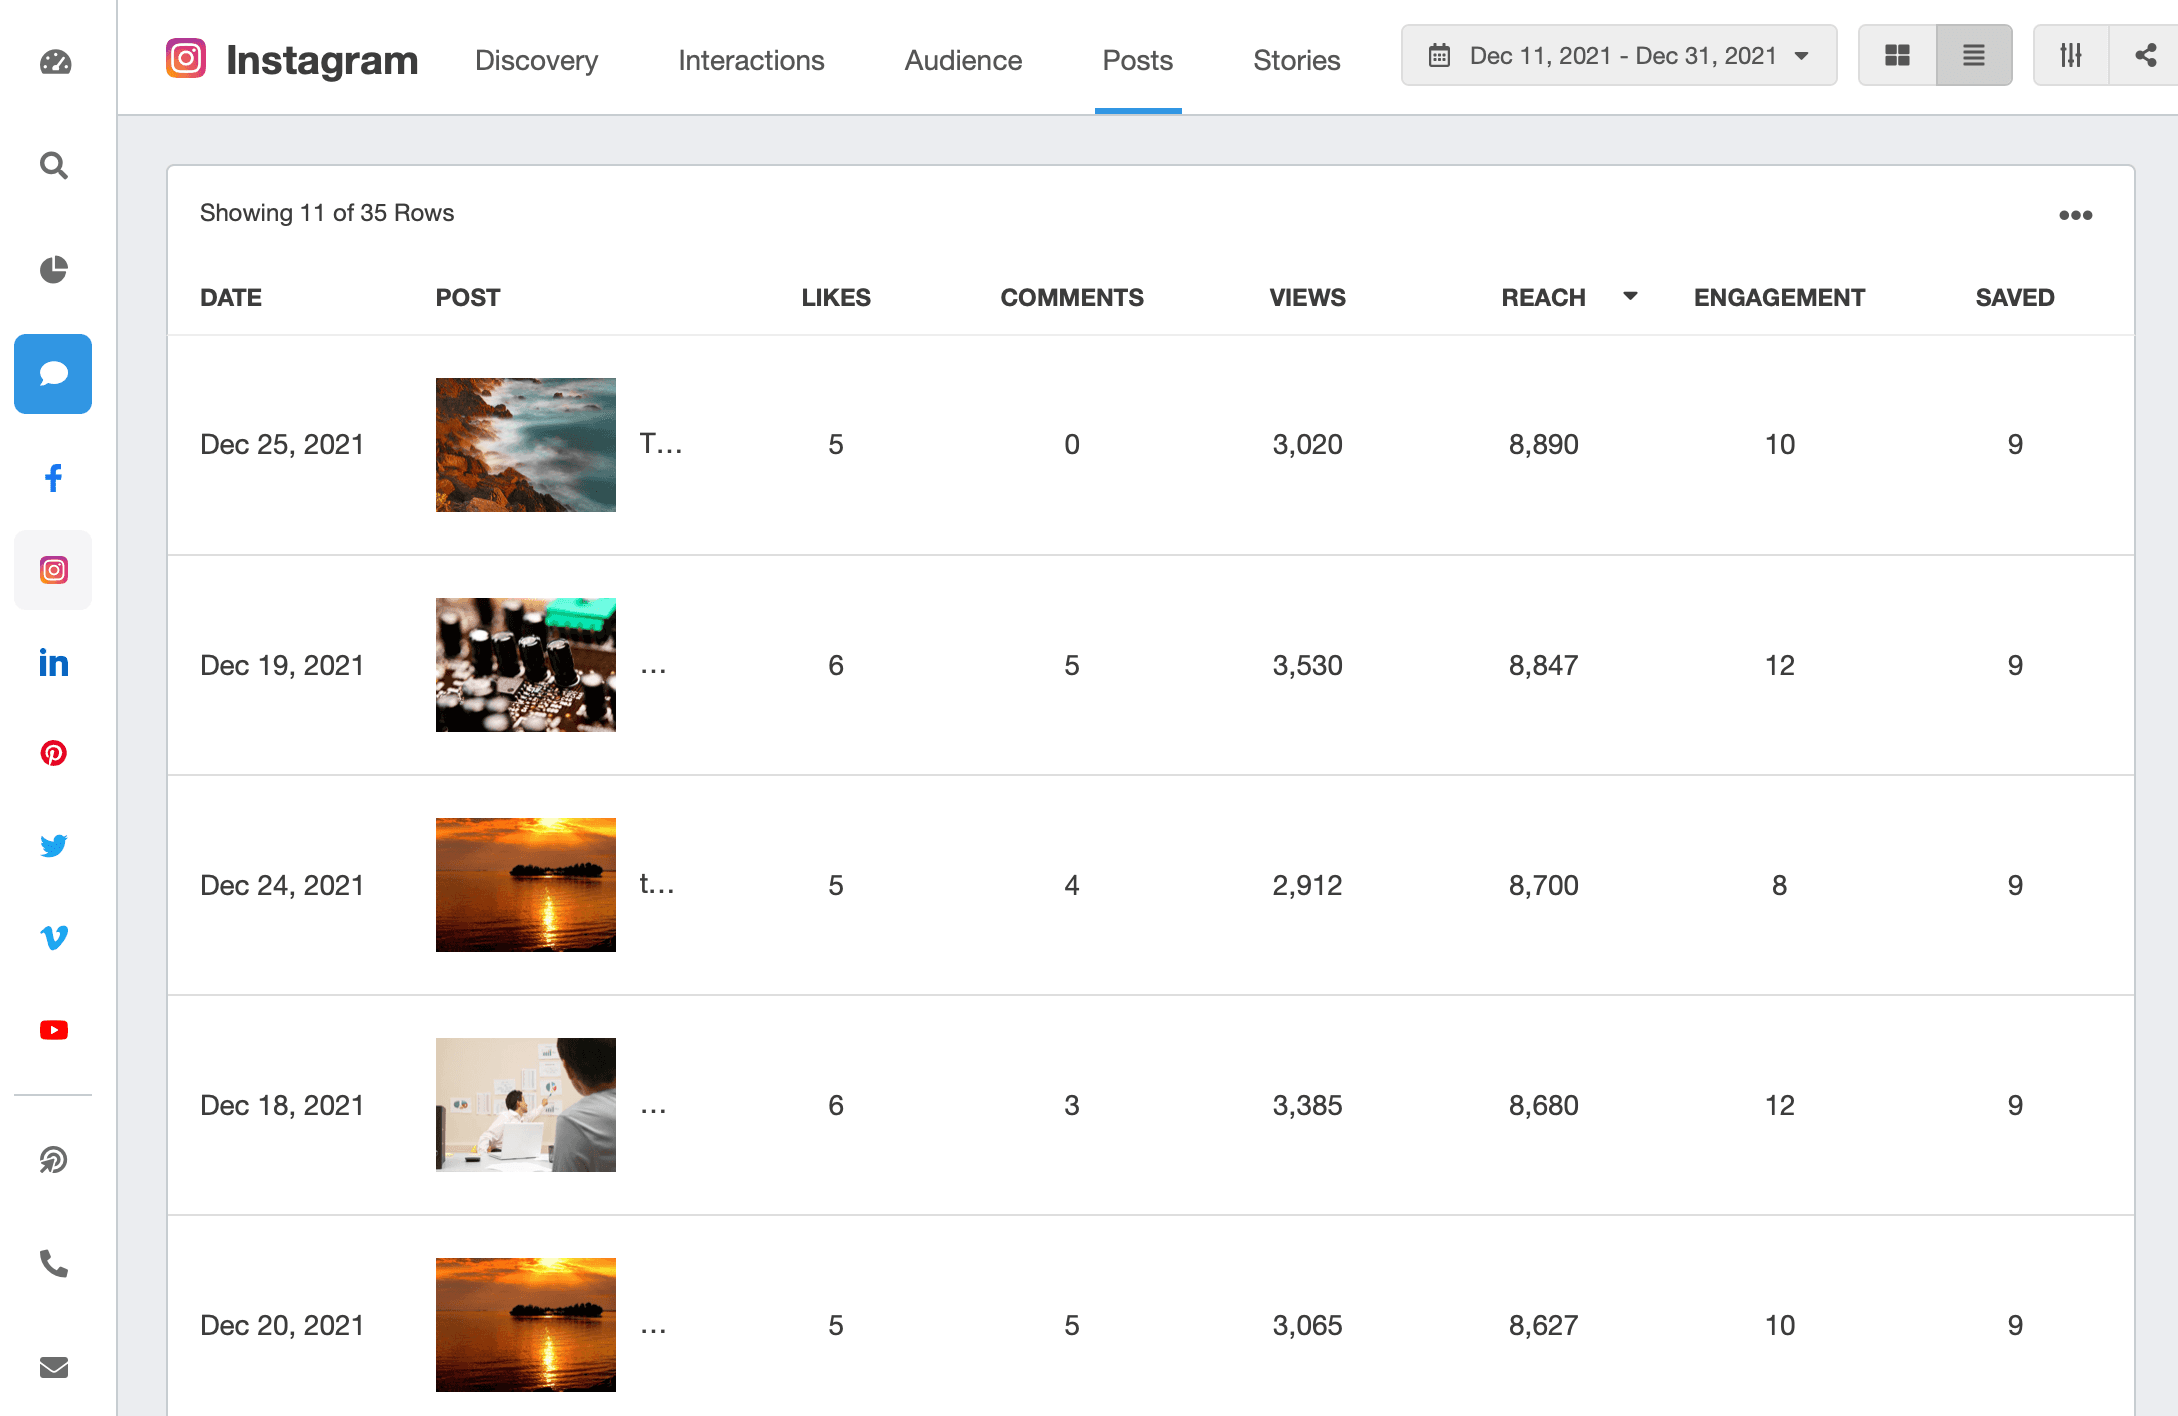
Visuals speak louder than spreadsheets. Including a content feed lets clients quickly see which high-performing posts went out and how they looked across different social media platforms—reducing questions and improving transparency.
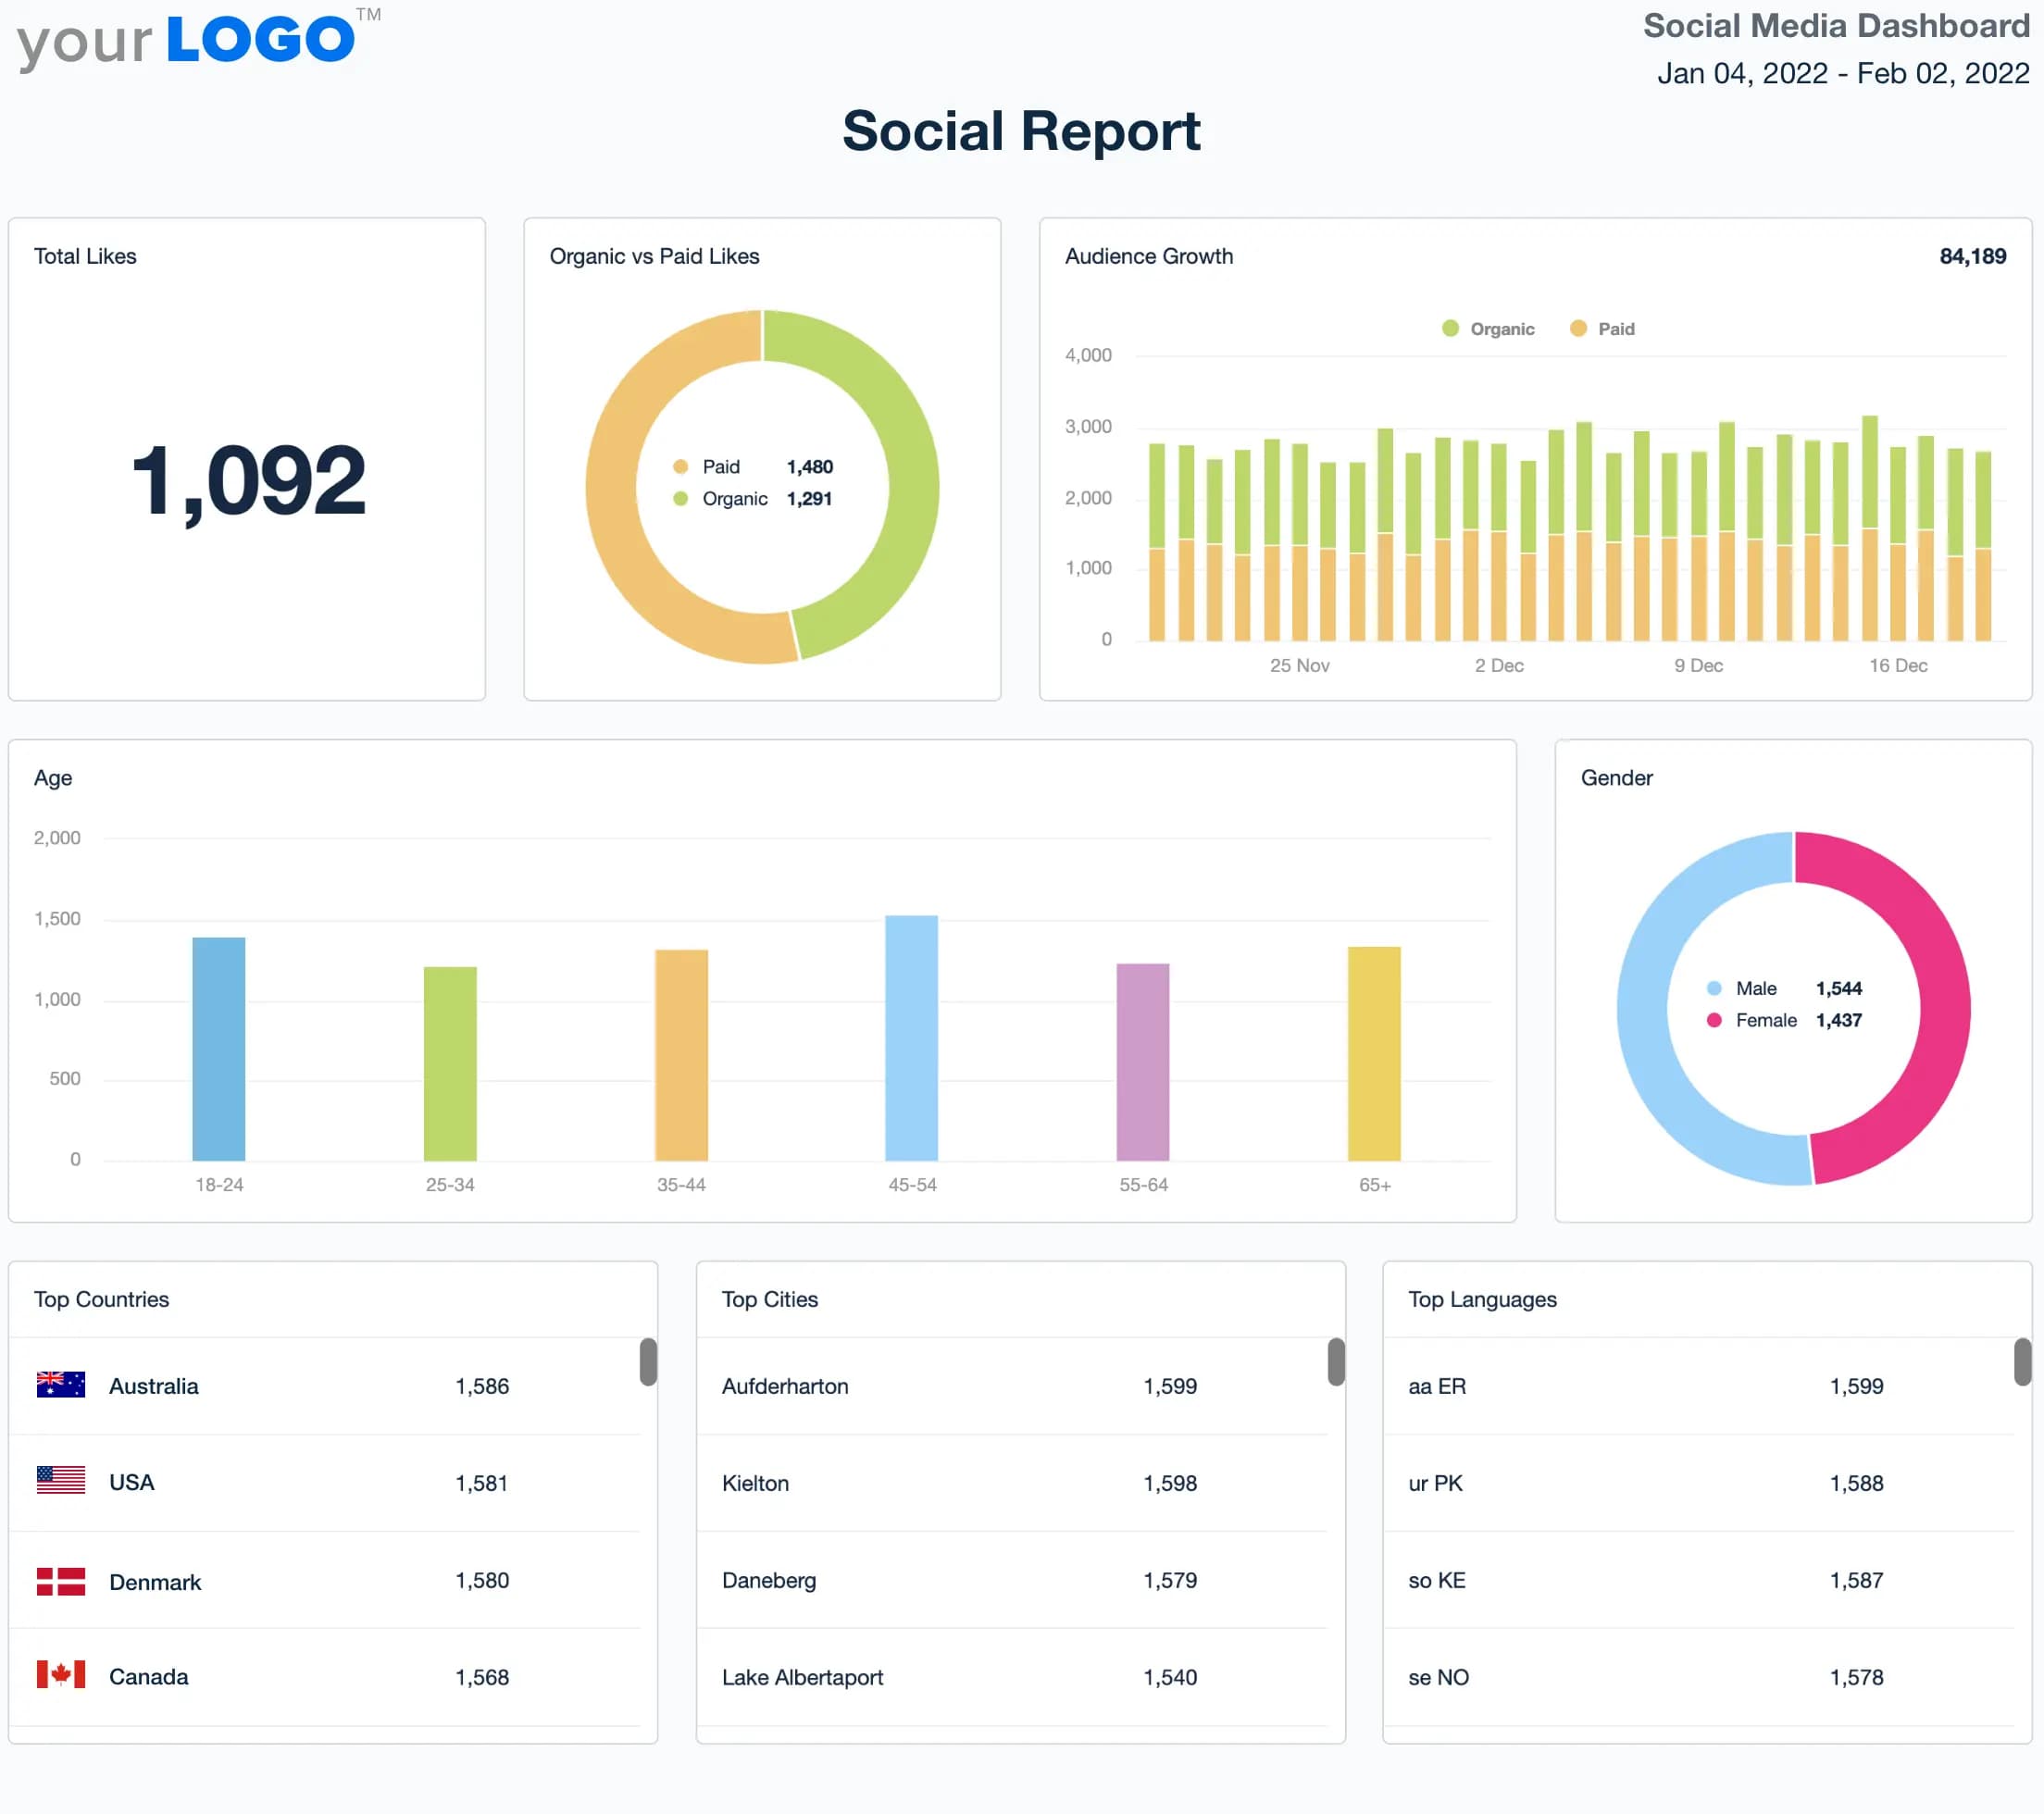
8. Audience demographics and geography — Who you’re actually reaching
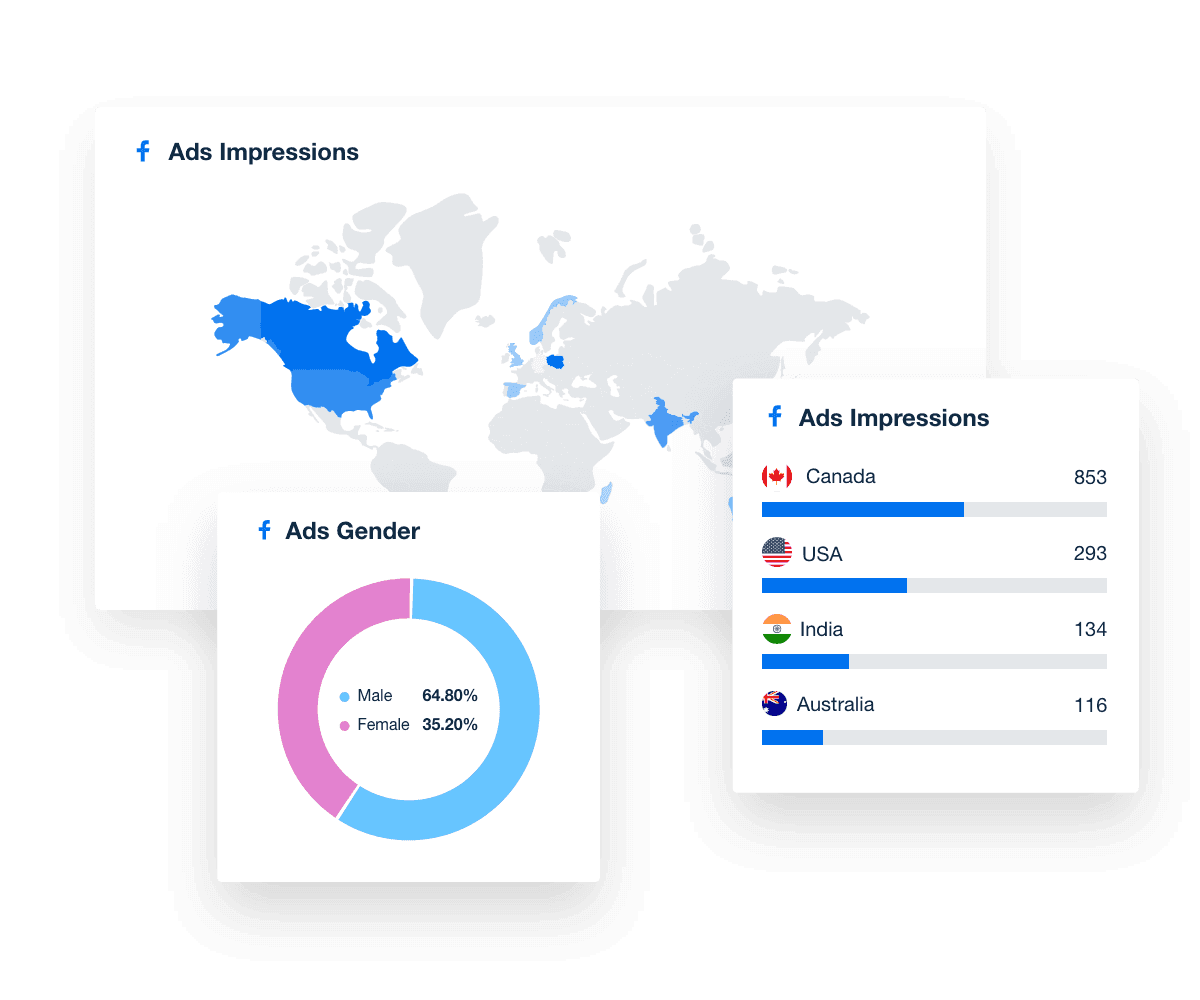
Understanding who your content is reaching—by age, gender, language, or region—helps your agency refine targeting and build a stronger social media strategy. If performance is lagging, this is a good place to spot disconnects between your content and your ideal audience.
These metrics give you a well-rounded look at social media performance—but what makes them powerful is how you turn them into actionable insights your clients can act on.
Agency Tip: Reporting on Google Ads or PPC campaigns? Try the pre-made Google Analytics report template to compile key metrics in just a few clicks.
Types of social media reports
Social media reporting isn't one-size-fits-all. Different clients—and different campaigns—need different types of reports based on goals, timelines, and strategy. Here's how to tailor your reporting cadence and content or maximum impact.
Annual reports — Strategic overview of year-long progress
A comprehensive overview focusing on long-term trends, year-over-year growth, and strategic insights. An end-of-year social media report is ideal for reflecting on the past year’s overall marketing strategy and planning future campaigns.
Quarterly reports — Track momentum and make mid-year adjustments
A quarterly social media report is useful for examining quarterly performance in more detail and comparing it to previous quarters. It helps adjust strategies mid-year and make data-driven decisions for the upcoming quarters.
Monthly reports — Spot trends and inform next-step decisions
Monthly social media analytics reports are essential for monitoring performance data and making quick adjustments. Use them to track campaign insights, brand mentions, and the impact of new and trending topics.
Weekly reports — Agile insights during fast-moving campaigns
These are more granular, focusing on immediate actions and reactions. Weekly social media reports are perfect for active campaigns where quick feedback and iteration are necessary.
Read more on weekly reports: How To Create a Weekly Report That Wows Clients
Campaign reports — Isolate results from specific social pushes
These reports, specifically tailored for individual campaigns, provide detailed analysis of relevant metrics such as engagement rates, reach, and conversion. They help digital marketers understand what's working and what's not.
Platform-specific reports — Deep dives for individual social channels
These reports isolate performance on a single social platform—like LinkedIn or Instagram—so agencies can zoom in on what’s working, where growth is stalling, and how platform-specific strategies are paying off.
Paid social reports — Clarity on ad spend and ROI
If your agency runs social ad campaigns, a dedicated paid social media report shows clients exactly how their budget is being spent and what results are being delivered—across platforms or per campaign.
Once you’ve chosen the right type of social media report, the next step is making the delivery effortless. Instead of sending reports manually, use a platform like AgencyAnalytics to schedule recurring reports that land in your client’s inbox—on time, every time.
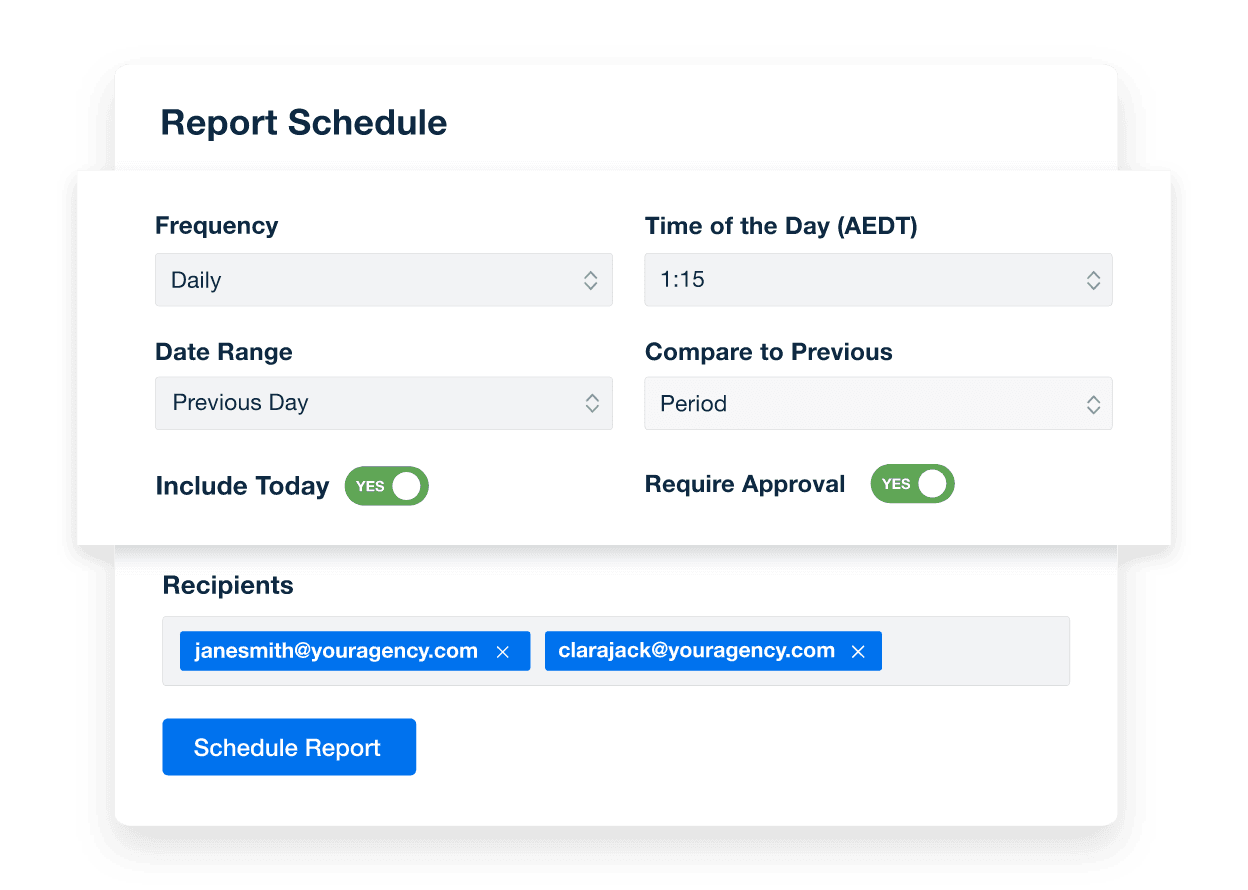
Unlock effortless client reporting with AgencyAnalytics—automated, real-time dashboards and scheduled reports deliver key metrics seamlessly. Try it free today!
9 social media reporting template examples
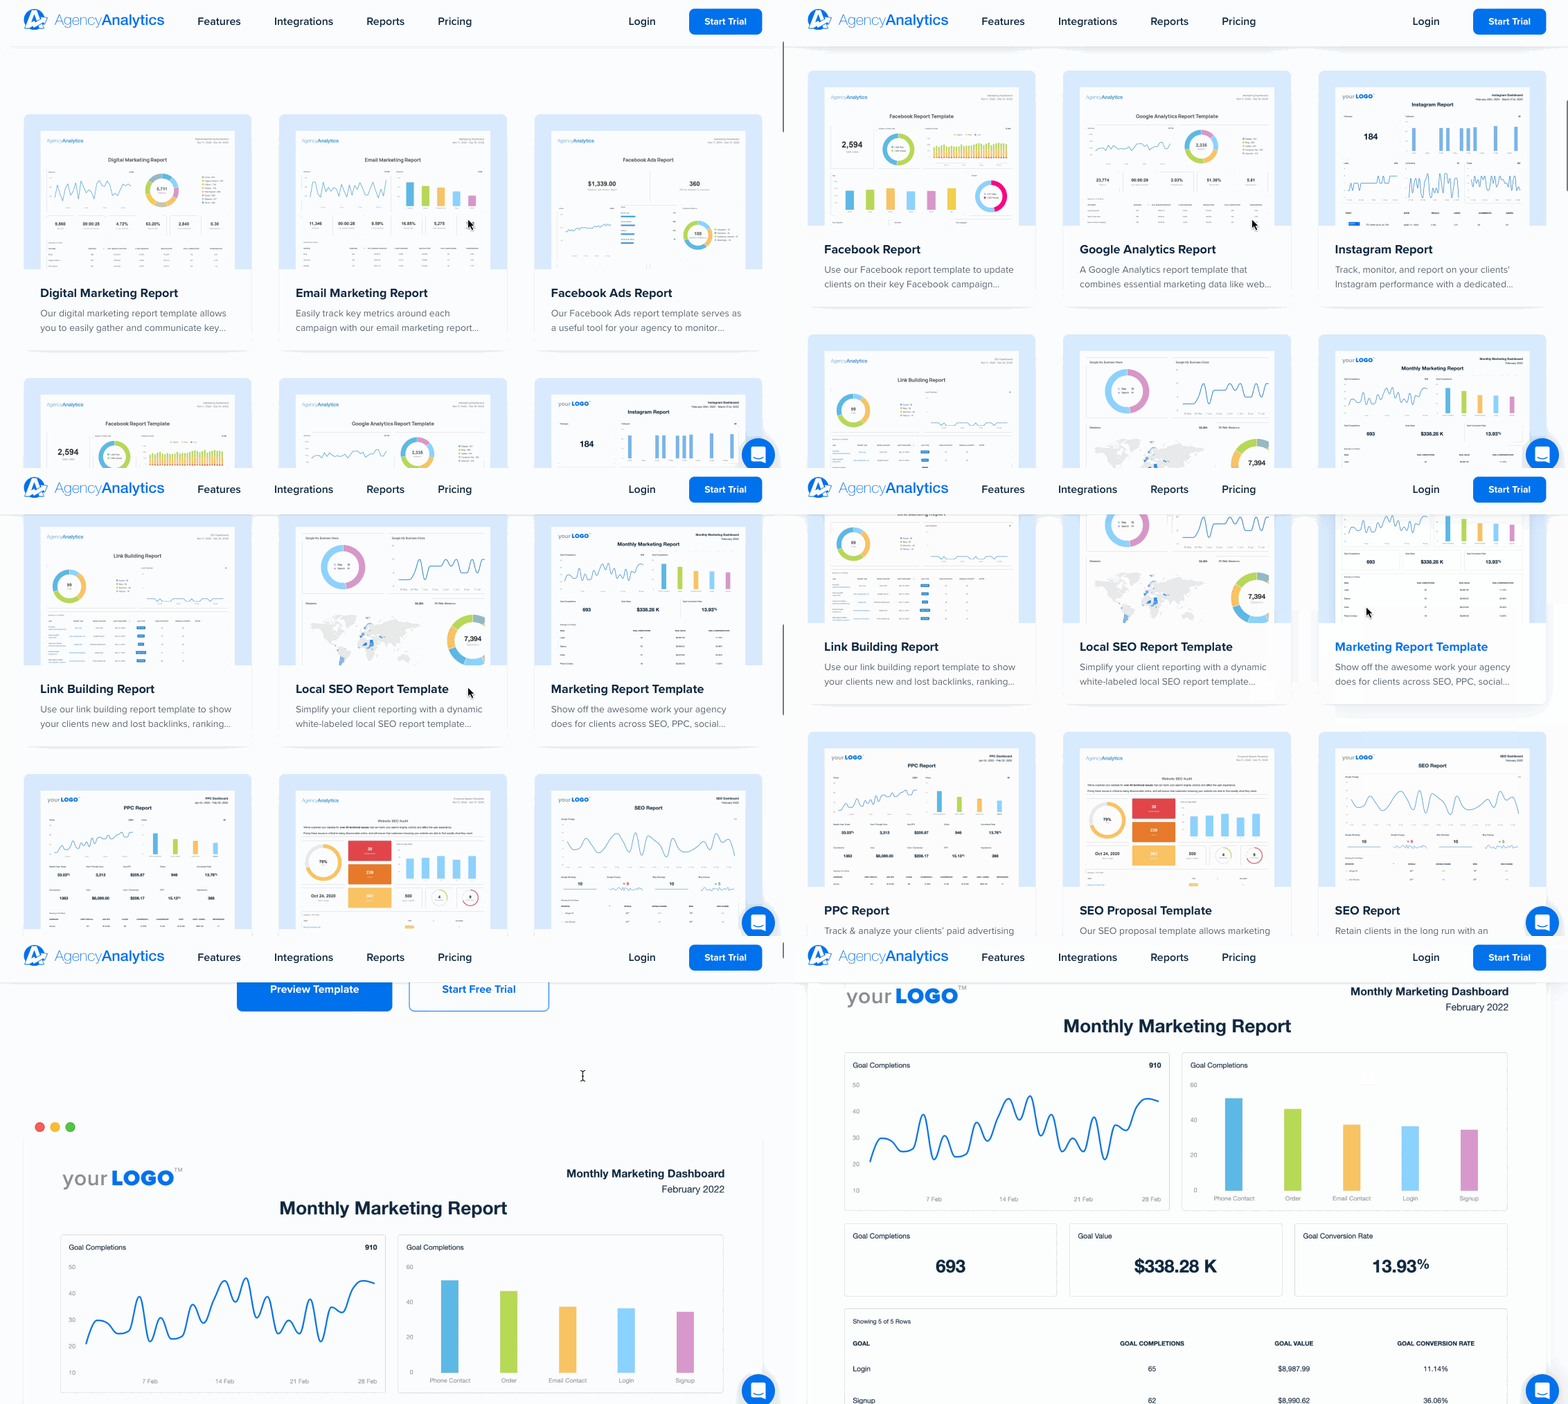
Want to streamline your reporting process without reinventing the wheel? These social media report templates help agencies deliver insights faster—without skipping important metrics or design polish.
Each template is fully customizable, pulling live data from your connected social media platforms while keeping the layout clear, visual, and tailored to client goals. Whether you're tracking organic engagement or paid social campaigns, there's a ready-to-use starting point here.
Reporting shows our clients the results we achieve for them in an easy-to-understand visual. We provide monthly reminders of how we are helping their business grow with these reports.
Denise Bowen, Managing Director, WEB ROI
Take a look at these templates to see how you can automate your social media analytics, highlight wins, and save hours on reporting every month. Start your free 14-day trial of AgencyAnalytics to get full access!
Type of Report Template | Key Metrics and Features |
|---|---|
Best suited for agencies managing multiple platforms for their clients looking to showcase the return on investment (ROI) of their social media strategies. | Follower Growth: Track how an audience expands on each social media platform over specific time periods. Engagement Rate: Explain how well content resonates with the audience (likes, comments, shares, saves). Click-Through Rate (CTR): Gauge the effectiveness of calls to action in driving clicks (on platforms with clickable links). Video Views: Measure video content views on platforms like TikTok or YouTube. Website Visits & Conversions: Analyze how social media efforts drive traffic and conversions on the client's website (via Google Analytics integration). Audience Demographics: Understand the demographics of a client's audience on each platform (age, gender, location). |
A Facebook social media report is ideal for agencies, marketing teams, and social media managers who handle multiple social media accounts, including paid and organic channels. | Reach: Demonstrate the potential audience size and brand awareness a client’s campaigns generate. Engagement Rate: Visually communicate how high engagement rates (likes, comments, shares) indicate a client's content resonates with their target audience. Page Likes: Track the number of people who follow a client's page to reflect audience growth and potential customer base growth. Posts: Provide an overview of each Facebook post's performance, identifying top-performing posts and what content types resonate best with the audience. |
Great for marketing agencies and social media managers, especially those who manage paid and organic client accounts. It streamlines reporting with automated data visualization software, freeing them to focus on strategic analysis. | Follower Growth: Showcase increased followers to demonstrate the brand's growing awareness and audience interest in a specific reporting period. Engagement Metrics (Likes, Comments, Post Shares): Highlight whether a client's content resonates with the target demographic and strategies to boost engagement metrics. Reach and Impressions: Understand how well the content is being distributed across Instagram. Post Performance: Break down social media posts to inform future strategies and show clients which content types resonate best. Instagram Ads Data (Impressions, Clicks, CTR, CPC): Include ad metrics like these to communicate how well your team managed the ad spend and the overall effectiveness of paid advertising efforts. |
Agencies conducting multi-channel campaigns will love this YouTube reporting template. By integrating YouTube data with other social media marketing efforts, agencies present a complete picture of the client's online presence. | Subscriber Growth Tracking: Showcase a YouTube channel's growing audience and the increasing brand awareness that a client’s video marketing brings. Video Engagement Metrics (Likes, Comments, Shares): Demonstrate how videos resonate with viewers, encourage audience participation, and how you’re building a community around a client’s brand. Audience Insights (Age, Gender, Location): Help clients understand their target audience demographics and create more targeted content creation to increase future user interactions. |
Ideal for marketing agencies who handle full-scope digital marketing campaigns for their clients. Seamlessly integrate LinkedIn analytics with 80 marketing channels and showcase the specific value LinkedIn brings to a client's larger marketing strategy.
| Clicks: Reveal user interest and potential for driving valuable traffic to a client's website or landing page. Comments & Social Actions (Likes, Comments & Shares): Showcase audience engagement with increased comments and social actions to prove the content is resonating with a client's target audience. Followers & Followers Net: Tracking follower growth (total and net) communicates the effectiveness of attracting new followers organically and through paid campaigns. Organic/Paid Followers Gain/Loss: Separate organic and paid follower growth to explain how organic content attracts a loyal audience while paid campaigns strategically expand reach. |
Perfect for agencies and social media managers whose target demographics skew younger. The template integrates TikTok data with website traffic, email marketing, and even PPC campaigns. | Video Views & Average Time Watched: Showcase the reach and engagement of a client's content to demonstrate the success rate of capturing audience attention. Likes, Comments & Shares: Quantify engagement and brand sentiment by showcasing an increase in these areas. Follower Country & Gender Percentages: Show clients that their demographic metrics ensure the target audience is being reached. Full Video Watched Rate: Communicate if viewers are watching the entire video and learn if the content is truly captivating or where improvements need to be made. Date & Create Time: Track video performance according to specific dates and times to identify trends and see how content resonates at different points. |
Best suited for agencies that manage large video campaigns for their clients and are looking for ways to demonstrate the value of video content. | Views: The foundation of any video strategy. Share total views and track trends over time to show clients their content reach and audience interest. Followers: Show clients how their content builds a community around their brand. Likes & Comments: Measure engagement and audience reactions to show clients how well their videos are sparking conversations and connecting with viewers. Published Videos: Track video output and content consistency. This demonstrates an agency’s commitment to video content creation. Demographics: Provide clients with the age, location, and gender of their viewers to help them better serve their customers. |
Best for marketing agencies working primarily with ecommerce brands. The ability to track click-through rates and compare data on how Pinterest pins drive sales on ecommerce platforms like Shopify helps to paint a holistic view of performance. | User Analytics: Understand audience demographics and interests to tailor content strategies that resonate with the right people. Pin Analytics: Show clients which pins drive the most engagement (likes, comments, saves) and click-throughs to their website. Click-Through Rate & Clicks: Communicate which pins are driving website traffic. Closeup Rate & Closeups: Track how often users zoom in on specific parts of a client's pins, indicating high interest. Impressions: Highlight how many times a client's pins appeared in user feeds, increasing brand visibility. Quartile 95 Percent View: Identify how long users are spending viewing a client's pins to indicate strong content. Save Rate & Saves: Track how often users save a client's pins to their boards to show a strong indicator of future purchase intent. |
Digital Marketing Report Template
A huge time-saver for marketing agencies who manage large-scale marketing campaigns for their clients. It goes beyond reporting on a single platform, offering a unified view of website traffic, SEO, social media, email marketing, and PPC performance. | Website Traffic & Conversions: Show clients the overall health of their online presence and how marketing efforts drive visitors to take desired actions (purchases, sign-ups, etc.). SEO Rankings: Communicate the value of organic search visibility and how it attracts qualified leads. Social Media Engagement: Demonstrate how social media marketing builds brand awareness and fosters audience interaction. PPC Performance: Track ad campaign effectiveness in reaching target audiences and generating leads or sales at a manageable cost. Email Marketing Performance: Measure open rates, click-through rates, and subscriber growth to show the return on investment (ROI) of email marketing efforts. |
Social media reporting software that impresses clients and saves time
Managing social media for clients means juggling content, campaigns, and constant metrics. Without the right social media reporting tools, building client reports becomes a manual time sink—one that pulls focus away from strategy and results.
Building a social media reporting suite helps solve this by automatically pulling data from all your connected social networks into one place, unifying marketing analytics and measurement, displaying the data intuitively, and automating the process by sending clients their own 24/7 access.
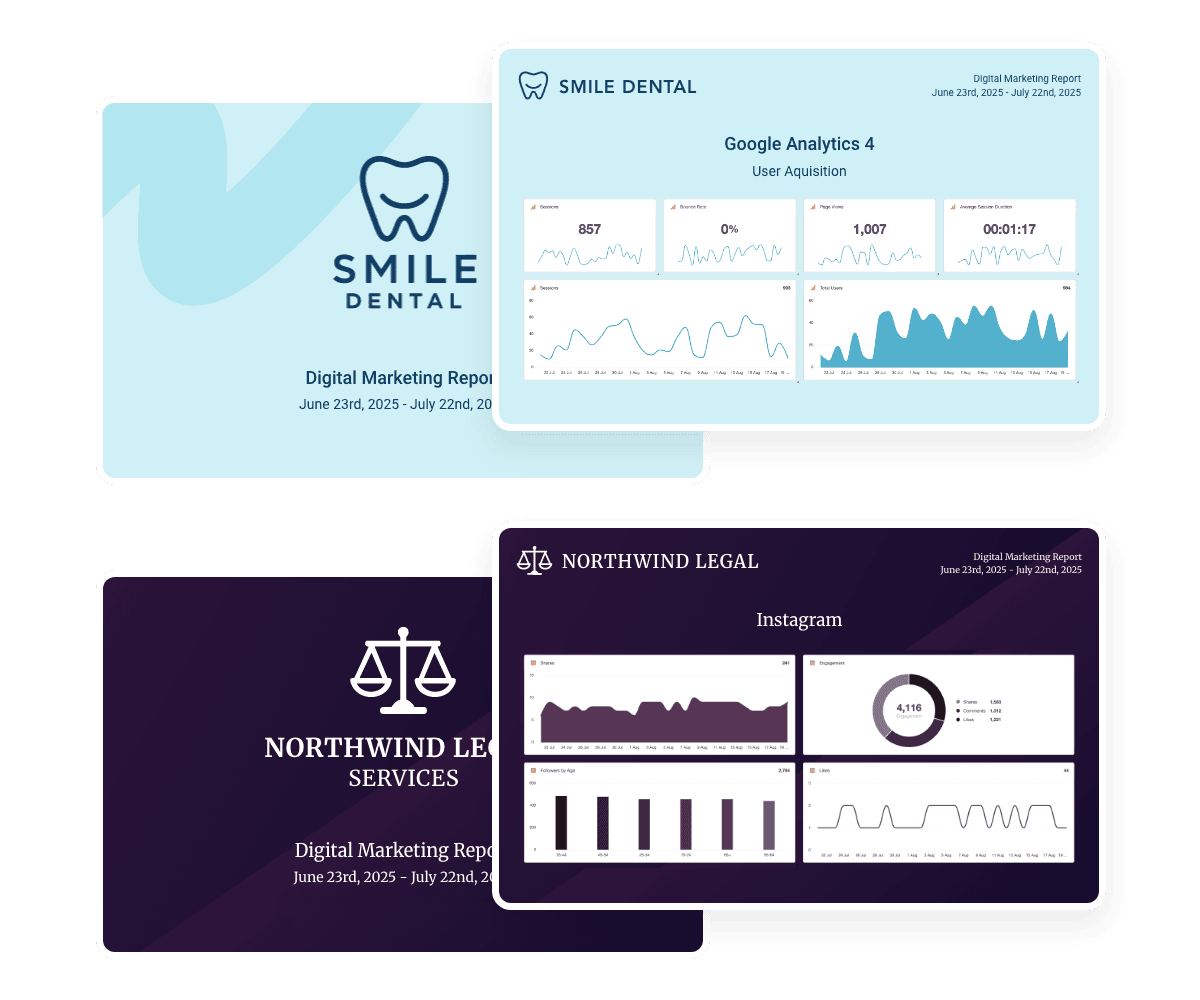
In summary, automated and professional social media reports improve the social media analytics process by showing everything happening on social media channels and the most relevant metrics in a single place.
No more digging through your agency’s social media management tool or individual social platforms to combine Instagram metrics with TikTok Ads data and trying to make the report look cohesive. This automated reporting process not only saves you time but also helps you demonstrate the value of your services to clients by clearly displaying exactly how much traffic, conversions, and revenue you’re driving to their bottom line.
If you’re ready to start building better social media client reports, a powerful analytics platform and a prebuilt social media report template make it easy.
Impress clients and save hours with custom, automated reporting.
Join 7,000+ agencies that create reports in under 30 minutes per client using AgencyAnalytics. Get started for free. No credit card required.
FAQs: Smarter social media reporting, simplified
From choosing the right analytics tools to tracking metrics that matter, these quick answers help you make sense of social media reporting—no guesswork required.
Social media reporting is the process of collecting, analyzing, and presenting data about your brand’s activity across social media platforms. It helps you track performance, prove ROI, and continuously improve your social media strategy. When done well, it turns raw metrics into insights your team and clients can act on.
The right social media metrics depend on your client’s goals. For engagement-focused campaigns, look at likes, comments, and shares. For ROI, track conversions, traffic from social platforms, and audience growth. Add demographics to show who you're reaching—and don’t forget to report on content output (like post volume) to reflect campaign activity.
Social media analytics is about interpreting the data—looking for trends, comparing periods, and identifying opportunities. Reporting is the packaging: taking that analysis and presenting it in a clear, client-ready format. One informs the other. Ideally, your analytics tools should help you do both without jumping between platforms.
For marketing agencies, the best software is one that saves time, supports your entire client roster, and helps you tell a clear story. AgencyAnalytics is built for that exact purpose. With 80+ built-in integrations—including every major social media platform—you automate reports, track KPIs, and give clients 24/7 access to a white-labeled dashboard.
Bonus: It scales beautifully, whether you're reporting for 5 clients or 500.
Yes. A simple competitor analysis—like follower growth, engagement rate, or content trends—adds important context to your client’s performance. If you track these details in external tools, it's easy to import them into AgencyAnalytics using the Google Sheets integration.
Use an analytics platform that unifies data from all your social media channels—like Facebook, TikTok, Instagram, and LinkedIn. Look for reporting tools that break down performance across platforms while allowing you to isolate each one if needed.
Easily use custom metrics to combine critical data from multiple platforms into a single metric to show the collective growth.
This helps clients get the full picture and understand which efforts are paying off.
The best reporting cadence depends on the campaign type and client expectations. Weekly reports work well for time-sensitive promotions. Monthly reports are standard for ongoing campaigns. For larger clients or seasonal reviews, also consider quarterly business reviews or annual rollups.
Just be sure you’re telling a complete, consistent story over time.
Manually? It can take hours—especially if you’re pulling metrics from different platforms and formatting charts by hand. But with a centralized reporting platform like AgencyAnalytics, you can build a fully branded and insightful client report in under 30 minutes.
The biggest benefit is time. You’re no longer switching tabs, screenshotting graphs, or wrangling spreadsheets. But there’s more: automation reduces errors, keeps reports consistent, and allows you to focus on delivering insights—not formatting.
Tools like AgencyAnalytics also allow you to track performance across channels, integrate with Meta Business, and include competitor analysis or advanced KPIs in just a few clicks.
AI reporting tools simplify the most time-consuming parts of social media reporting. Instead of manually writing insights, these tools automatically generate client-friendly summaries that highlight trends, wins, and areas for improvement.
AgencyAnalytics’ AI-powered reporting turns raw data from your analytics tools into clear, human-readable narratives. This helps agencies uncover actionable insights, scale reporting across accounts, and spend more time optimizing social media performance.

Written by
Paul Stainton is a digital marketing leader with extensive experience creating brand value through digital transformation, eCommerce strategies, brand strategy, and go-to-market execution.
Read more posts by Paul StaintonSee how 7,000+ marketing agencies help clients win
Free 14-day trial. No credit card required.


