Table of Contents
Table of Contents
- What Is Automated Reporting Software?
- Using Google Sheets for Reporting: Pros and Cons
- Google Sheets Reporting Limitations
- Why Use Automated Reporting Software
- Use Cases for Automated Marketing Dashboards vs. Reports
- What to Expect After You Make the Switch from Google Sheets
- How To Transition From Google Sheets To Automated Reporting?
- Win Back More Billable Hours By Eliminating Manual Reporting
7,000+ agencies have ditched manual reports. You can too.
Free 14-Day TrialQUICK SUMMARY:
Automated reporting software streamlines client reporting by automatically collecting and analyzing key metrics. Unlike Google Sheets, which requires manual data handling, automated tools enhance efficiency, save time, and reduce errors. This article explores the benefits of transitioning to automated reporting for improved client management and productivity.
Did you know that agencies with 20 clients spend 30 hours on manual client reporting every month? For an employee to handle reporting at $40 per hour, that’s a loss of $1200/month for your agency.
Without the right tools, the more clients you take on, the more your agency gets bogged down by non-billable tasks. Nobody likes to fiddle around with spreadsheets, a million tabs open on their computer, and fix broken formulas in Google Sheets, scrambling to get their marketing reports out the door.
Such activities can really add up, eating away at your agency's valuable time–and distracting you from doing activities that actually move the needle for your clients.
Now imagine turning what was once your routine number-crunching (manual reporting) into a stress-free branded resource that wins you back more time as you scale–and keeps clients coming back.
This article will look at the Google Sheets reporting tool limitations for client reporting and the best alternative for your agency: automated reporting software.
What Is Automated Reporting Software?
Automated reporting software is a tool used by marketing agencies to automatically gather key marketing metrics for internal analysis and sharing with their stakeholders.
Whether or not you choose to have your reports automatically created and sent on a set interval–and never stress about a deadline again–is up to your agency and how you structure your approvals.
But even using automated tools to gather, collate, and calculate metrics and KPIs cuts a majority of the labor-intensive work out of client reporting.
We have spent more than our fair share trying to figure out and work with Google Sheets. We would easily spend a couple of hours on each report because of the details, screenshots, and descriptions involved. Now, we can give back more time to our clients.
- Nathan Hawkes, President at Arcane Marketing
Automated Reporting Software vs. Google Sheets
The key advantage of automated reporting software vs. Google sheets is that with an automated system, most of the heavy lifting of exporting, merging, and collating data is done for you.
Instead of relying on V-lookups and other cell-based formulas, automated reporting software keeps tabs on each of your clients’ real-time marketing metrics–in one platform.
This allows you to analyze it directly, zoom in and out of different time periods to view trends, and visualize the data in charts and graphs that are created for you–without the codes and formulae.
For instance, in the AgencyAnalytics platform, when the numbers change inside any of the 80+ marketing platforms that are supported, so does the data in your reports.
No more importing, copying, or pasting.

Automate your data retrieval with AgencyAnalytics' no-code client reporting software. Start your free 14-day trial today!
Using Google Sheets for Reporting: Pros and Cons
Google Sheets has its place in any agency. From creating ad-hoc reports that focus on a specific initiative or data point to creating performance forecasts. But Google Sheets starts to break down with repeated processes, such as complex monthly client reports spanning multiple campaigns or platforms.
“I was using manual export/import with Google Sheets and combining that with Google data in Google Data Studio (now Looker Studio). The drawback was no real-time data,” says Matthew Regenie, CEO at Prospect Future.
Let’s take a look at the main pros and cons of using Google Sheets for client reporting.
PROS ✅ | CONS ❌ |
|---|---|
Unlimited data | No real-time updates |
It’s free | Lack of support |
Usability | Creating reports can take too long |
Manipulating data with formulae | Fixing them takes time when they break |
Easy to copy-paste data | No API or automation to input data for you |
Customizable font and colors | White labeling looks scrappy at best |
Visualizes data with charts, graphs, and tables | There’s a limited amount of charts you can add to a sheet |
Multiple users can work on the same doc simultaneously | It can slow down and cause you to reload the page |
Can get very granular when calculating specific metrics or KPIs | Setting user permissions to view or edit spreadsheets can be time-consuming |
Google Sheets Reporting Limitations
Tracking, analyzing, and communicating your clients’ marketing campaign progress is essential to show your agency’s impact on their bottom line. And while Google Sheets is great for manipulating data, the fact is that it’s not built for the sheer amount of data that a marketing agency deals with on a daily basis–or that a client wants to see on a monthly basis.
Lacks Data Input Automation
Most of the data that goes into Google Sheets reporting has to be manually pasted from multiple data sources. This causes room for human error but also takes time. And when you have multiple clients with multiple marketing channels, that’s a lot of logging in and out of platforms to combine your data in a meaningful way.
Also, you have to repeatedly do this to get the latest metrics each reporting period. Who wants to start from square one at the end of each reporting period? It’s no wonder so many agencies refer to the client reporting period as “Hell week!”
Although there are ways to automate some of these data points, using tools like Zapier to populate data into specific cells, these connections can all-to-easily break and cost an agency several hours trying to troubleshoot what went wrong. Plus, with human touch comes increased chances of human error.
Our reporting process prior to using AgencyAnalytics could best be described as cumbersome and laborious. The more clients we brought on, the more administrative burden we were forced to endure. - Jessica Weiss, Director of Marketing & Strategic Partnerships, One Firefly
Creating Insightful Reports Takes Too Long
Once you’ve mastered Google Sheets and know the best formula to manipulate your data with (yes, there’s a steep learning curve for each of your marketing teams to learn!) you need to add in your latest data points.
Let’s say you’ve even thrown in some charts and graphs to illustrate your progress in a more visual way for your clients. However, it’s still hard to show the big picture to your clients from a bunch of rows and columns.
And the more data you have in your Google Sheets report, the slower the doc is to load, scroll through, and visualize for actionable insights. And when you’re dealing with clients with multiple marketing campaigns, it’s hard to get it just right every time.
Most clients want to see that work is happening and that they're making positive movement. Going into deep detail on reports is often overkill. - Nathan Hawkes, President of Arcane Marketing
It's A Missed Branding Opportunity
Slapping on your agency’s logo into a complicated-looking doc–that your clients may or may not even understand–doesn’t effectively do the one thing a client report should: communicate success and reinforce your agency’s brand.
A client report is your number one tool that shows your clients the progress you’re making in their marketing activities. It should cement your agency’s impact on a client’s bottom line–not bog them down with data overload.
Leads to Analysis Paralysis
One of the problems with dumping all of your agency’s marketing data into a Google Sheet and then sharing it with the client is that there is often too much data for the client to absorb effectively.
This can quickly lead to unnecessary questions about very specific metrics that are not primary drivers of the client’s success, including vanity metrics.
It's essential to show value to clients with key metrics that matter, business owners & marketing managers want to see the results simplified to measure marketing against business growth/sales. - Pat Akkawi, Director, The Marketing Co
Although this level of granularity can be helpful for campaign optimization, it is rarely the level of detail that the client wants or needs in order to track the ROI of their investment in your agency’s services.
Why Use Automated Reporting Software
When your marketing teams aren’t wasting time manually gathering data from multiple marketing platforms for every client every month, they are using that time for more creative endeavors and applying that information to actually optimize their campaign efforts.
When the founders at AgencyAnalytics set out to grow their SaaS company twelve years ago, they wanted to solve the #1 pain point for marketing agencies: client reporting.
Let’s see just how automated reporting software helps streamline agency workflows.
1. Integrates With Many Marketing Channels
Your clients won’t all be on the same marketing platforms. And they are most likely on more than one platform.
It’s a common scenario–one client uses Mailchimp while another uses Drip. The same applies to social media, where a B2B client may focus on LinkedIn, and a fashion-forward client may focus on Instagram.
AgencyAnalytics connects with 80 marketing channels to bring each one of your client’s data in one place. (There’s even a Google Sheets integration, but more on that in a bit.)
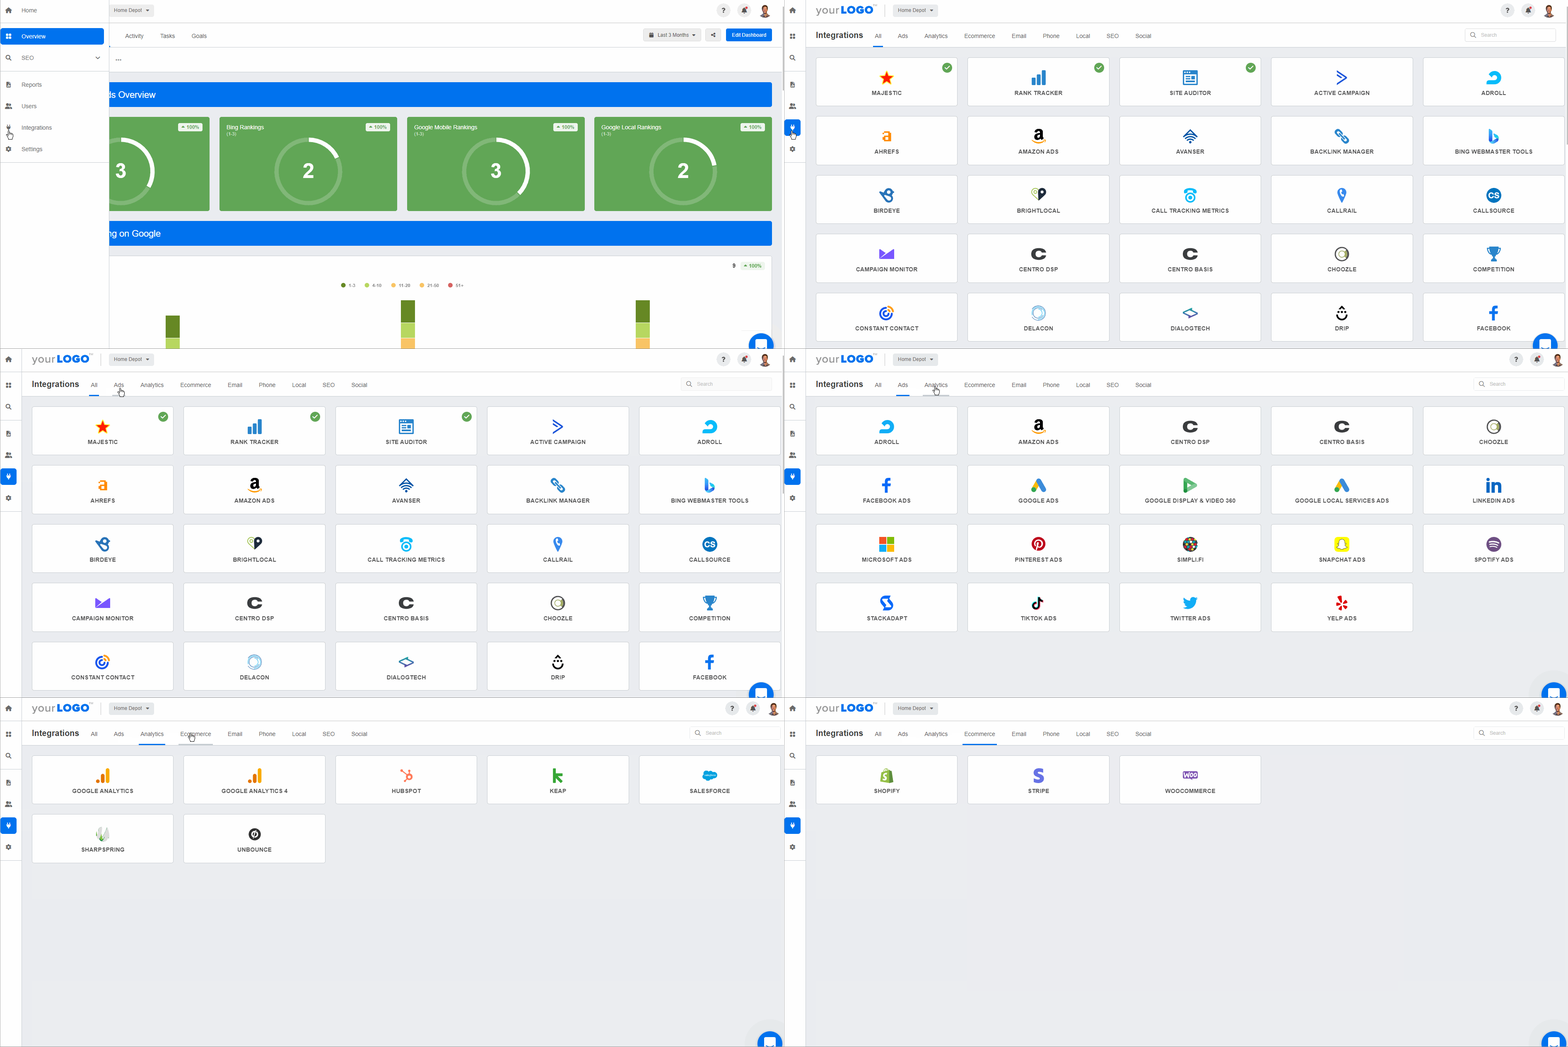
Connect all the integrations you need to show the full picture of your client’s marketing performance under one roof. Start your free 14-day trial today!
2. Pulls In Real-time Data For You
Every integration has its own dedicated marketing dashboard that pulls real-time metrics from that platform. So you have a Facebook Ads dashboard and Facebook Ads report template alongside a Google Ads dashboard for PPC Ads, a Web Analytics Dashboard for your Google Analytics, and so forth. For every client.
No more copying and pasting data. No more cell errors or Vlookups that stop working. The platform does the heavy data lifting, so all your team needs to do is analyze and optimize.
AgencyAnalytics has over 15+ multi-channel dashboard templates to start from. This way, each marketing report template is easily customizable by instantly dragging and dropping the widgets from any of your clients’ integrations into place to create cross-channel dashboards for immediate insights on-the-fly.
Automated reporting software populates marketing dashboards and/or creates client reports in minutes with the date range of your choice.
Not ready to let go of Google Sheets? Check out the Google Sheets Export Extension: The easiest way to get your marketing data from over 80 top marketing platforms into Google Sheets for extra handling and analysis.
3. Schedules Reports
The main feature of automated reporting software is that it puts your client reporting on autopilot–read more about Client Reporting Best Practices.
That means that once you’ve set up a client’s report template, you can have them sent out automatically at regular intervals with the latest data.
And while this is super time-saving and convenient, many agencies prefer to use the report approval system. This allows them to review their reports, add their own commentary in plain English, and customize their executive summary to give a personal touch. And it only takes a few minutes.
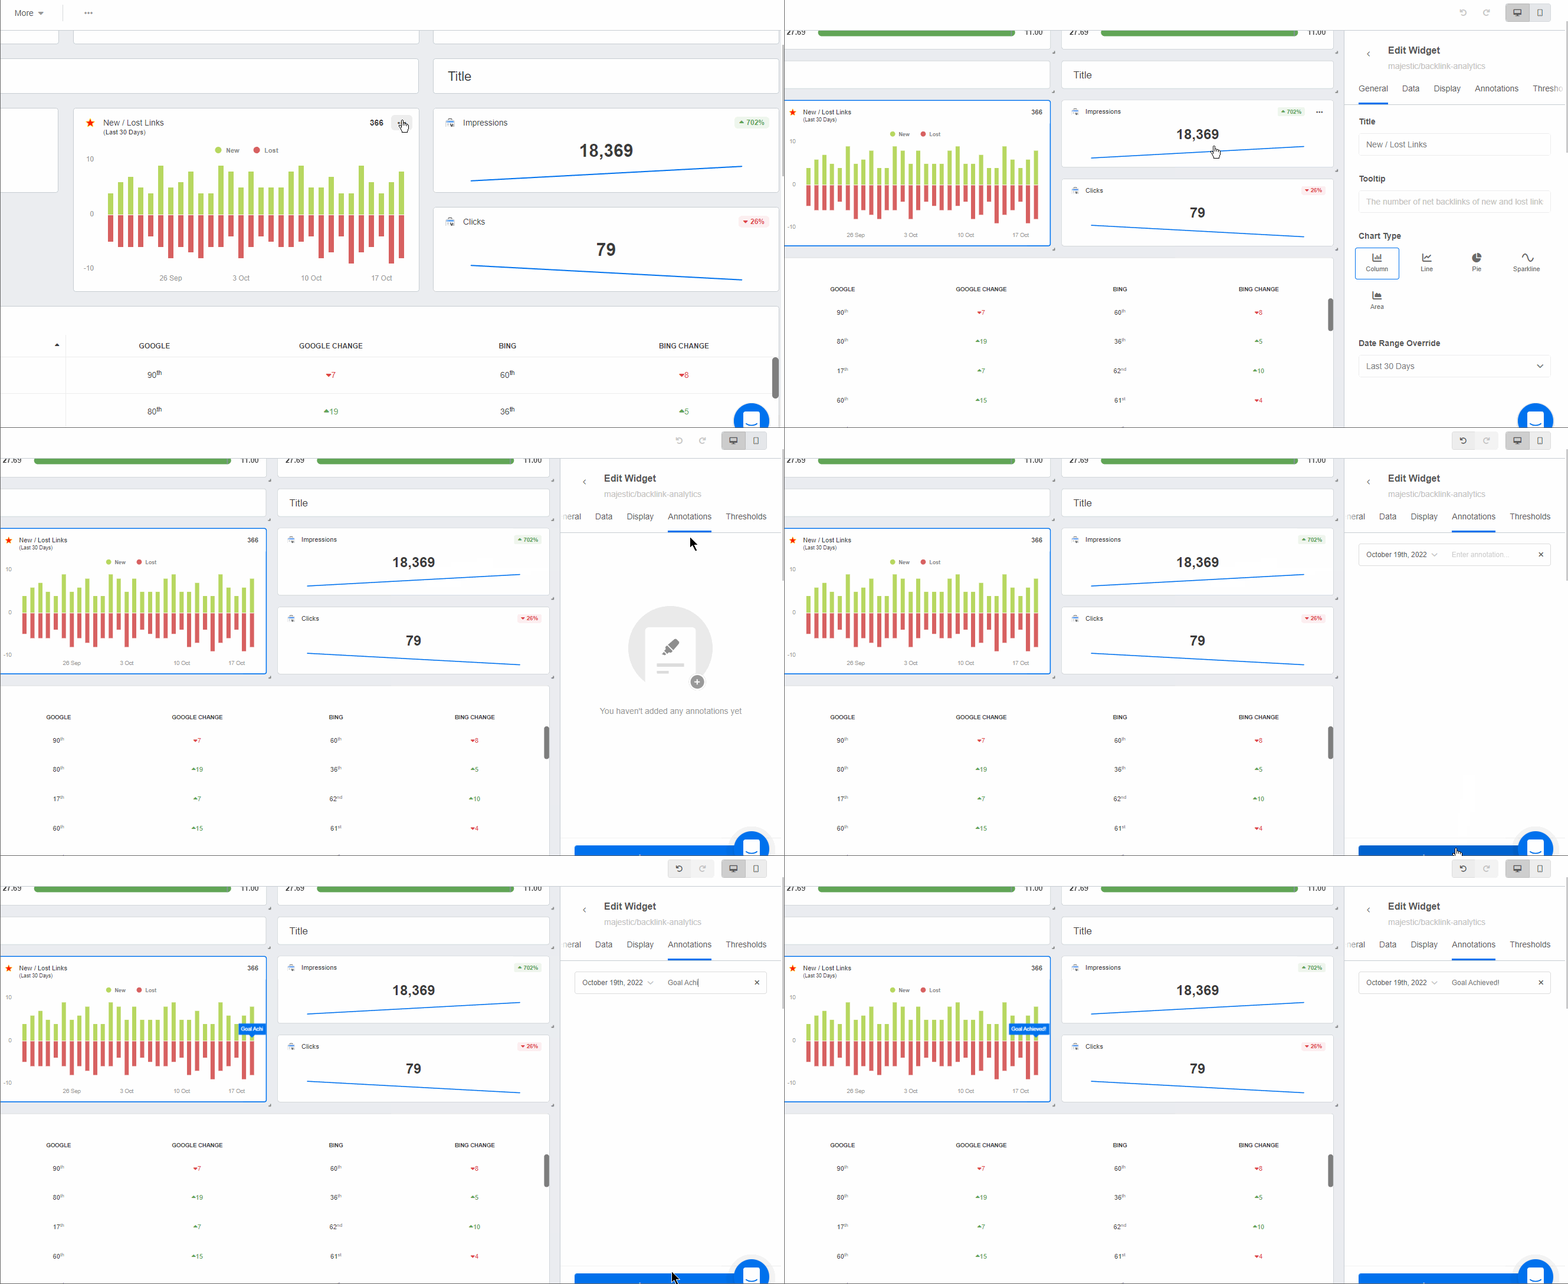
Agency Tip: Put some of your client reports on autopilot–especially the ones your agency doesn’t actively manage but keeps tabs on. For example, a regular SEO audit or Review Management report keeps your clients in the know of their website health or online reputation. Your clients will appreciate this valuable information–with no additional time investment from your agency. Plus, they may even indicate areas of need and be used as a natural upsell opportunity to broaden your agency’s services!
4. Works Around the Clock So You Don’t Have To
Create unlimited individual logins for your team and clients. This way, you can create client-facing dashboards with customized user permissions that are available 24/7–so your more involved clients can check their progress on their own time. And the added transparency gives your agency bonus points and builds trust.
To be able to offer our clients a branded dashboard was very powerful and gave them a sense of going above and beyond. - Brett Sirianni, CEO at Social Supply Co
5. Automatically Updates Goals to Show Progress
Once you set your KPIs with your clients, integrate goal-tracking into your agency’s day-to-day activities. Create custom goals or use custom metrics to immediately know if you’re on track or off-track to quickly change course–before your next reporting period.
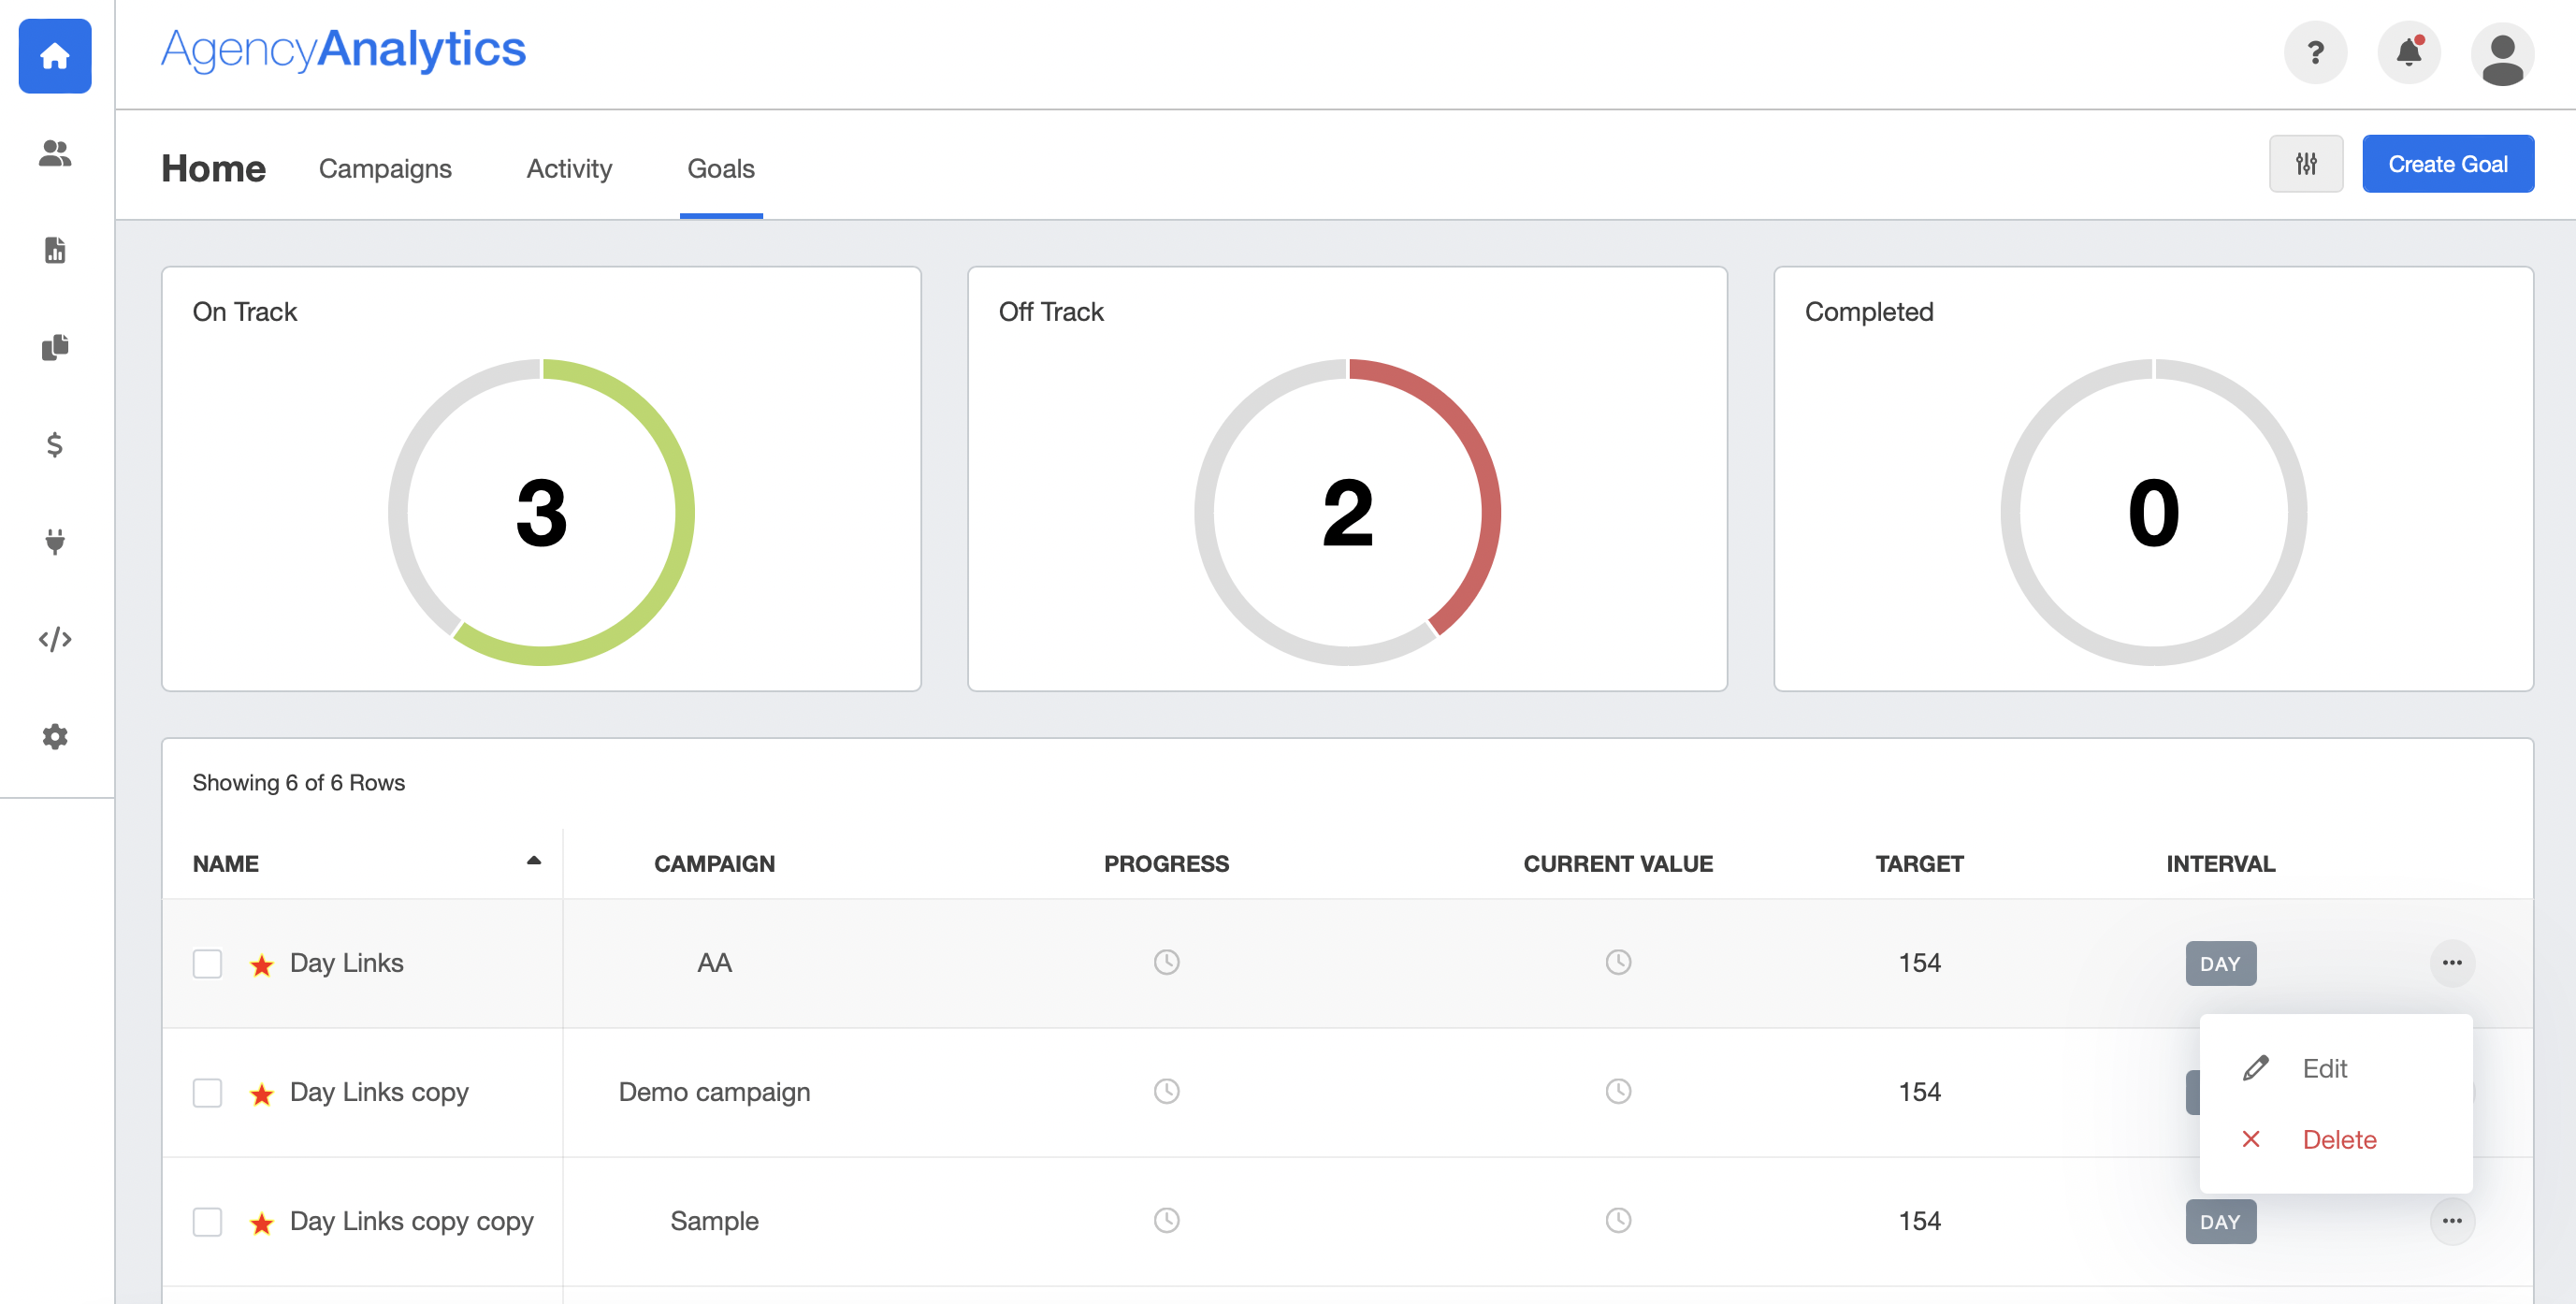
These widgets in AgencyAnalytics are built into your dashboards, making it easy to add to your client reports to showcase your progress toward your clients’ business goals–in a very visual and clear way.
6. Integrates With Google Sheets
Talk about the best of both worlds!
Have data that just isn’t available from the list of integrations? Use the AgencyAnalytics Google Sheets integration!
For certain data points or calculations that you can only put together using Google Sheets, easily connect Google Sheets to the AgencyAnalytics platform to import select data points or entire tables to:
Highlight custom metrics that matter most to your clients
Turn raw data into intuitive charts and graphs
Easily compare raw data month-over-month
Auto-sync your Google Sheets data
Deliver white labeled reports
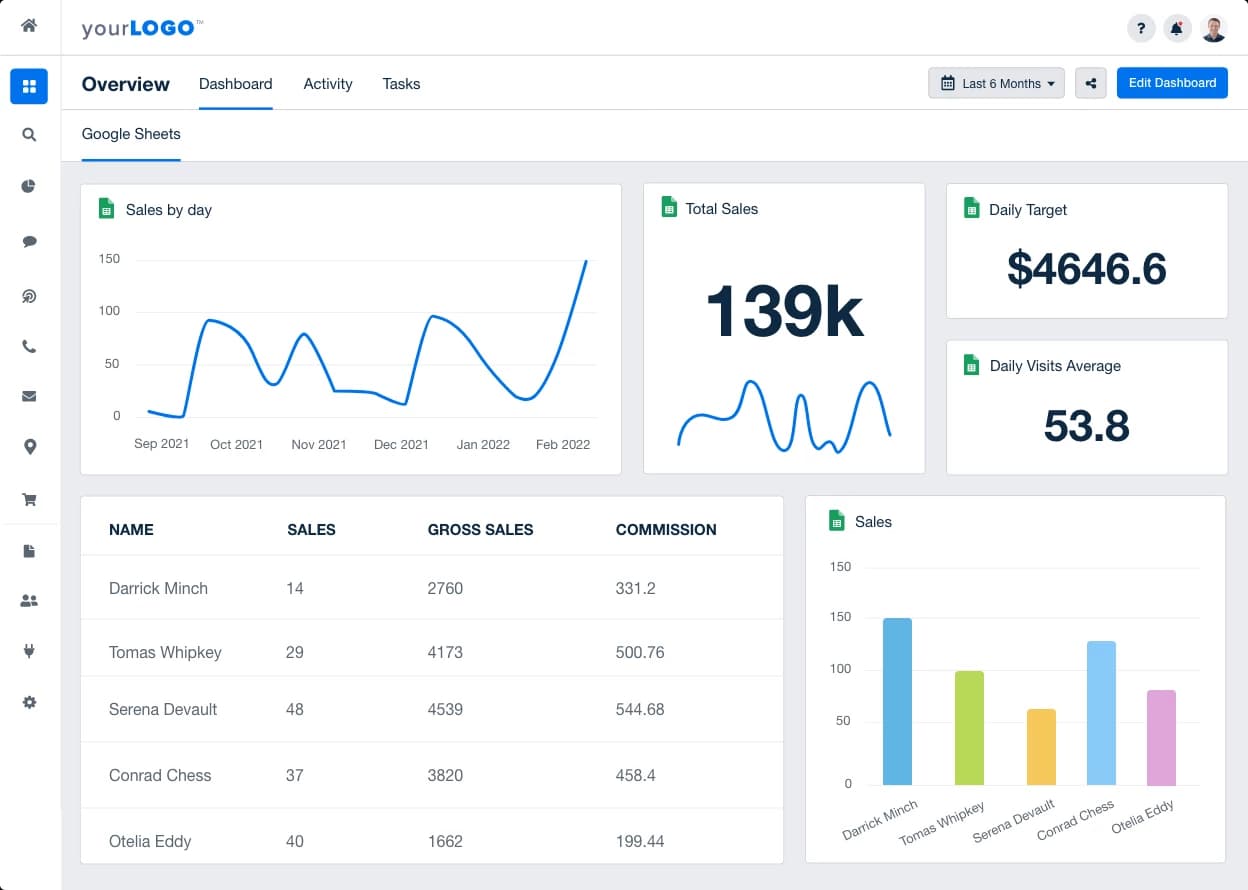
New to AgencyAnalytics? Try the Google Sheets integration free during your 14-day trial!
Use Cases for Automated Marketing Dashboards vs. Reports
A great feature of automated reporting software is that it not only creates client reports but also marketing dashboards. These are most handy for internal use by your agency’s marketing teams, and you’ll see the examples below from when we interviewed marketing agencies on how they use marketing dashboards to reduce churn.
When and How Agencies Use Dashboards vs. Reports:
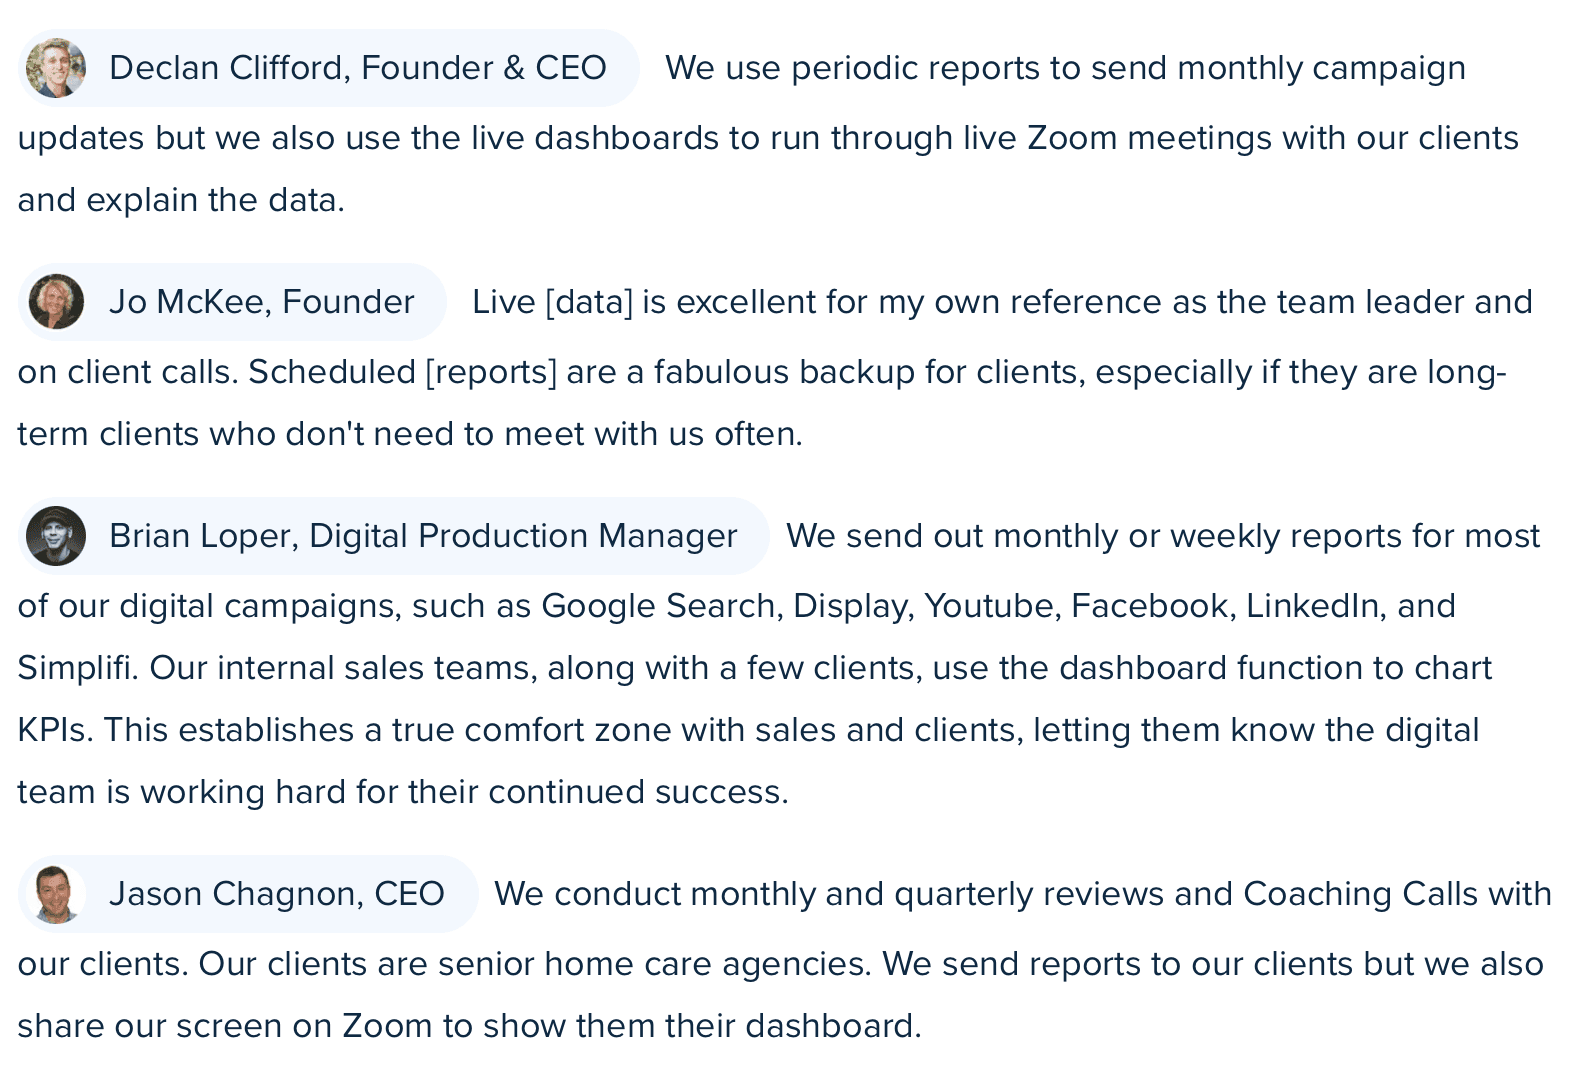
Let’s look at some key differences between marketing dashboards and reports:
Use Cases | Dashboard | Report |
|---|---|---|
Automated scheduling | ❌ | ✅ |
Internal analysis of data for short-term decision-making | ✅ | ❌ |
24/7 access with custom login | ✅ | ❌ |
Client-facing option | ✅ | ✅ |
Drag-and-drop builder for customization | ✅ | ✅ |
80 + integrations | ✅ | ✅ |
Templates to get started right away | ✅ | ✅ |
Full white labeling features (logo, brand colors, custom URL, etc.) | ✅ | ✅ |
In a nutshell, automated reporting software gives you the tools your agency needs to communicate effectively with your clients–and within your teams–at the right time and at the right place.
What to Expect After You Make the Switch from Google Sheets
When you switch from Google Sheets to Automated Reporting Software, you save countless hours, allowing you to scale and grow your agency. Or simply take Fridays off. Or both.
[We’re] saving so much time at the end of the month in running reports. - Brett Sirianni, CEO at Social Supply Co
Expect:
Less Frustration–no more yelling at your spreadsheets
More Time–win back billable hours
More Money–see above
We now have much more free time to focus on our business and client communication now that reporting is clean & automated. - Matthew Regenie, CEO at Prospect Future
Creating Client Reports in Google Sheets vs. AgencyAnalytics
Here is a step-by-step comparison of Google Sheets reporting vs. our automated reporting software.
Google Sheets | AgencyAnalytics |
|---|---|
Step 1 - Open each marketing platform for a specific client (Facebook, Google Ads, Mailchimp, Semrush, etc. ) | Step 1 - Open AgencyAnalytics to see all of the data that has been automatically updated for each client and campaign. |
Step 2 - Find and enter the relevant username and password for that platform. | Step 2 - Use a report template or create a new report – and watch as your clients’ data is automatically populated. |
Step 3 - Set the date range, segments, or other filers you need to find the data you need.
| Step 3 - Add your agency’s insights and analysis. |
Step 4 - Copy the relevant data points.
| Step 4 - Schedule or send your white labeled report to the client. |
Step 5 - Paste into Google Sheets. | Step 5 - You're monthly report template is done! Sit back and relax – or get back to billable work! |
Step 6 - Update any formulas to include the new rows of data. |
|
Step 7 - Update any charts to include the new rows of data. |
|
Step 8 - Review the data calculations to find and fix data errors |
|
Step 9 - Add your agency’s insights and analysis. |
|
Step 10 - Format the report as needed. |
|
Step 11 - Send the report to the client. |
|
Step 12 - Wonder if they opened it and understood it. |
|
Use AgencyAnalytics to see when clients have opened and viewed their reports. Those who regularly don’t interact with your reports could be a sign of churn–reach out to them to mitigate that risk.
The initial setup of the dashboards and the reports might take upwards of an hour per client, but having those reports automatically sent out monthly is an absolute dream.
- Jessica Weiss, Director of Marketing & Strategic Partnerships, One Firefly
How To Transition From Google Sheets To Automated Reporting?
Sign up for AgencyAnalytics–take advantage of the free 14-day trial
Add your client
Add your client’s integrations (there are 80+ to choose from, like Google Analytics, Facebook, YouTube, Mailchimp, etc.)
Connect the Google Sheets integration to add any extraneous custom data
Create and schedule your reports
Report Template Examples
Here are just a few of the report templates you can already use to get a head start, or modify as you wish:
Digital Marketing Report Template
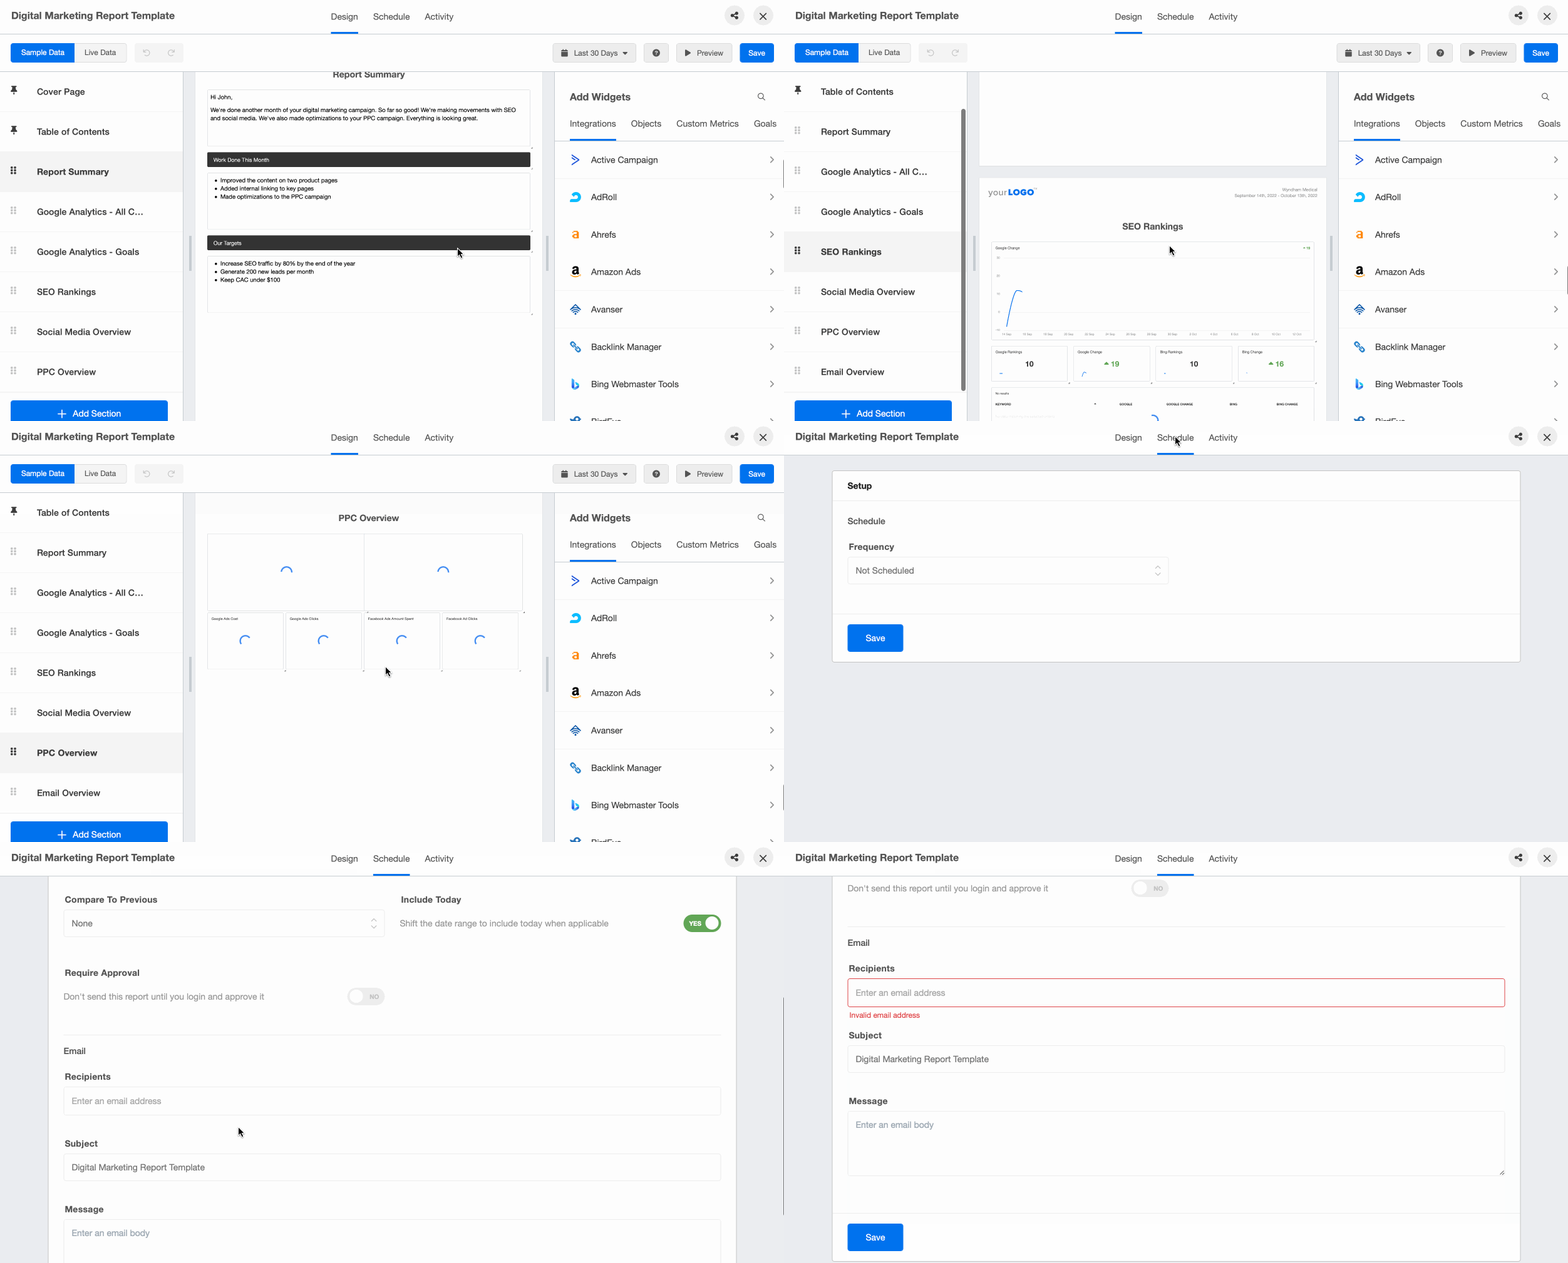
Easily gather and communicate key metrics like web traffic, conversions, SEO ranking, and ad campaign performance with a digital marketing report tool.
Social Media Monthly Report Template
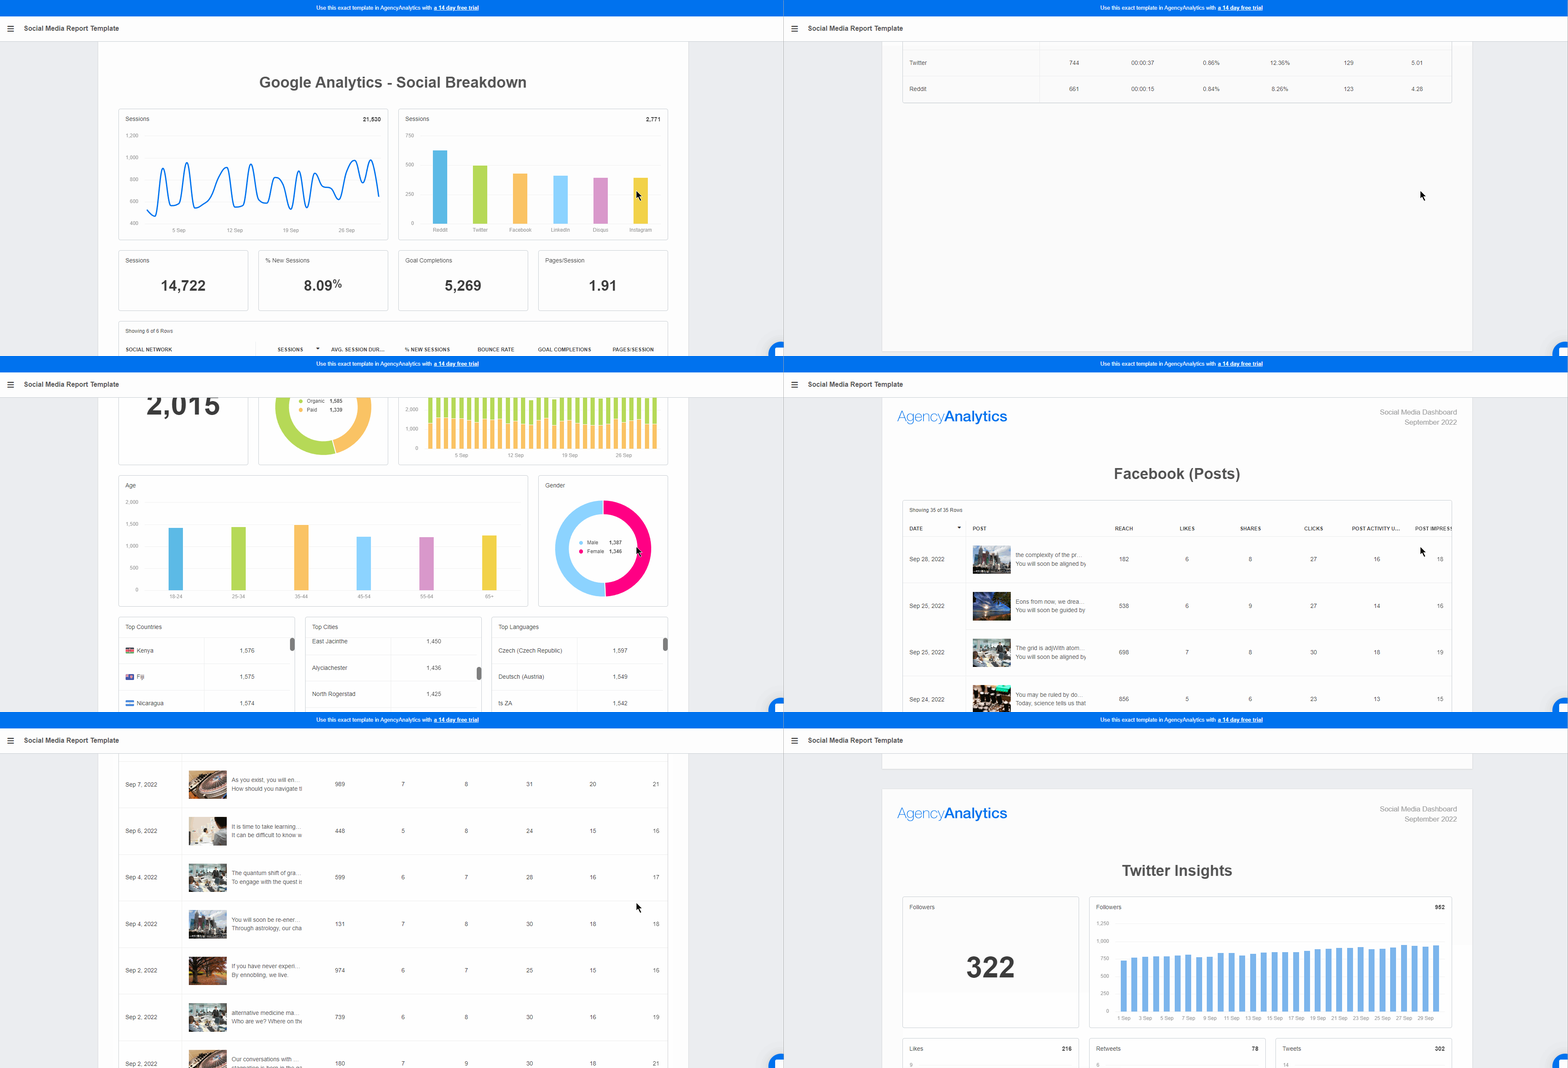
Instantly show your clients their trends in audience demographics, follower growth, and website traffic with an automated social media reporting tool.
SEO Report Templates
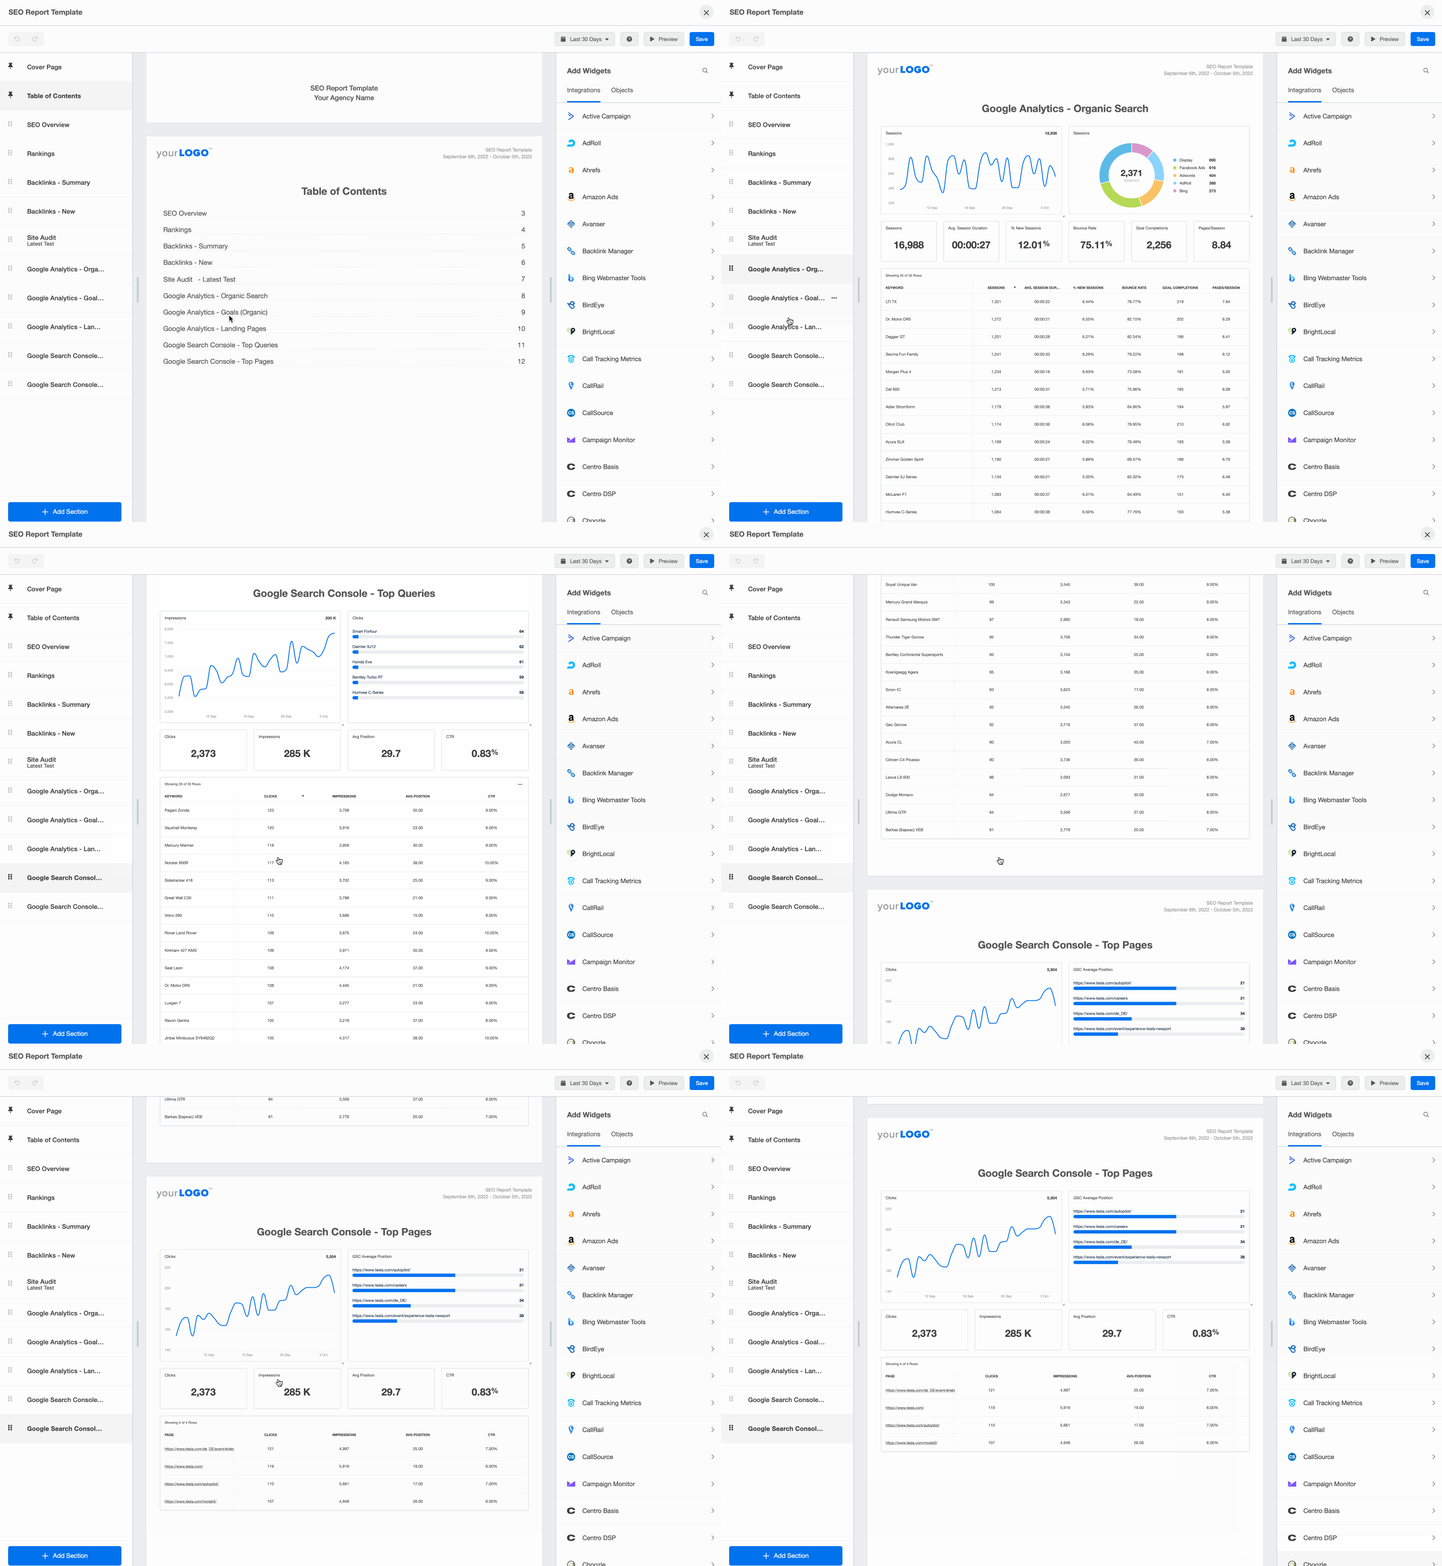
Automate your SEO reporting to save hours every month. This SEO reporting platform highlights the most important KPIs without overwhelming your clients with too much information.
PPC Report Template
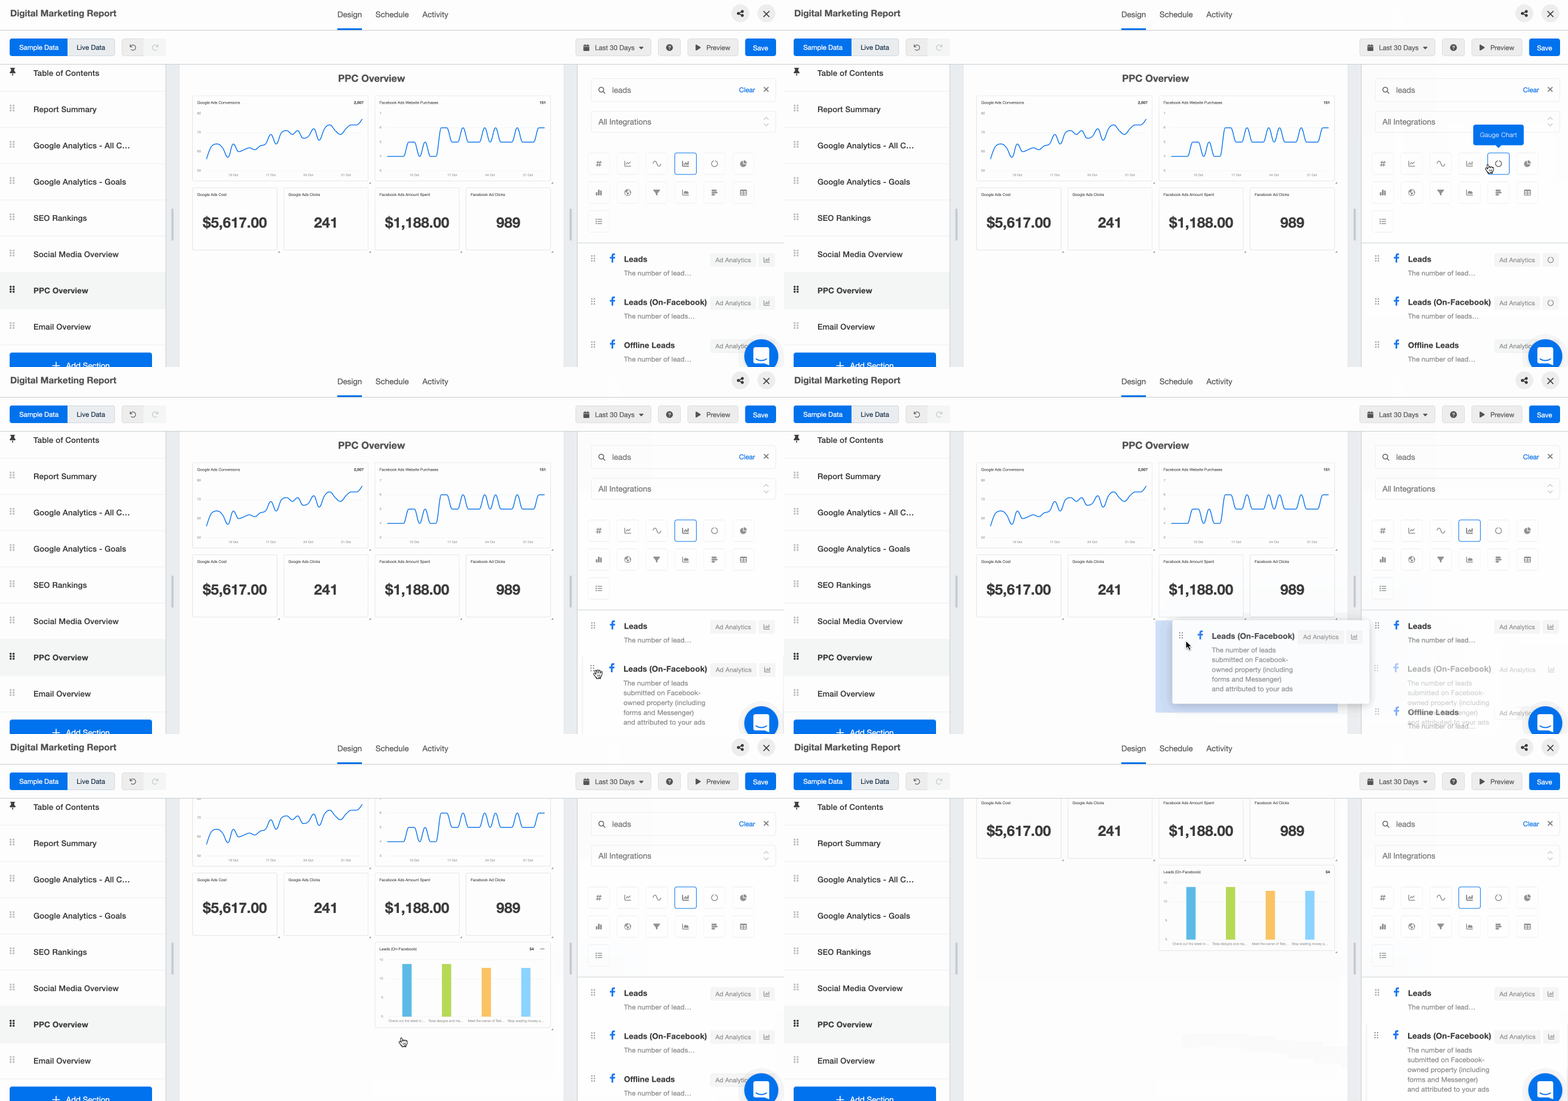
Simplify your PPC reports by already including your PPC markup and showcasing the KPIs that matter most to your clients. Combine data from all your clients’ PPC platforms–from Facebook Ads to Google Ads and even Snapchat Ads–into one visual report.
Win Back More Billable Hours By Eliminating Manual Reporting
If you’re heads-down creating complex reports your clients may not even read, you’re missing out on the results-driven tool trusted by 7,000+ agencies.
Use automated reporting software to visualize your client's KPI data instantly, save time, enhance your client experience–and easily compare month-over-month.
With AgencyAnalytics, get your first two weeks free–no credit card required. Once you add your first client, get the most out of your free trial by connecting your integrations and setting up your first report.
Automated reporting = life-changing.
We used to create a fully custom report for clients, but they prefer AgencyAnalytics. It has a much better UI, turnkey reports, and setting up new integrations is a breeze. It's night and day.
- Matthew Regenie, CEO at Prospect Future

Written by
Melody Sinclair-Brooks brings nearly a decade of experience in marketing in the tech industry. Specializing in B2B messaging for startups and SaaS, she crafts campaigns that cut through the noise, leveraging customer insights and multichannel strategies for tangible growth.
Read more posts by Melody Sinclair-BrooksSee how 7,000+ marketing agencies help clients win
Free 14-day trial. No credit card required.


