What to include in a digital marketing report to wow clients


Table of Contents
- Key takeaways
- Why digital marketing reports matter
- What to include in a digital marketing report
- Build custom metrics around specific KPIs
- Communicate progress with goals and annotations
- Digital marketing dashboards display data in real time
- Other reports to keep in your toolkit
- Internal reports that keep your agency running
- Streamline reporting with digital marketing report templates
- How often should you send digital marketing reports?
- How to gather data for your digital marketing reports
- The takeaway
- Your Digital Marketing Reporting Questions, Answered
7,000+ agencies have ditched manual reports. You can too.
Free 14-Day TrialTable of Contents
- Key takeaways
- Why digital marketing reports matter
- What to include in a digital marketing report
- Build custom metrics around specific KPIs
- Communicate progress with goals and annotations
- Digital marketing dashboards display data in real time
- Other reports to keep in your toolkit
- Internal reports that keep your agency running
- Streamline reporting with digital marketing report templates
- How often should you send digital marketing reports?
- How to gather data for your digital marketing reports
- The takeaway
- Your Digital Marketing Reporting Questions, Answered
7,000+ agencies have ditched manual reports. You can too.
Free 14-Day TrialYour agency probably produces marketing reports like clockwork. Some help you close deals. Others keep your team aligned. But too many agencies still spend hours pulling data, formatting PDFs, or guessing which report to send when.
A digital marketing report is the bridge between your agency’s expertise and your client’s goals, and it’s a delicate balance to get the information just right. When your reports are easy to understand, clients see your value straight away. Deliver a confusing jumble of numbers instead, and you risk the trust you’ve built.
So how do you know what to include? The details vary from client to client, but the best reports clearly present data that demonstrates how your work is influencing performance. Good reporting also gives you a thorough understanding of what’s working and what isn’t, so you can make proactive, data-driven decisions on your client’s behalf.
A great report doesn’t just summarise numbers. It turns marketing data into a story about progress, outcomes, and opportunities.
This guide covers what belongs in a digital marketing report, which report types to use at which moment, and how to streamline the process. You’ll save time, reduce client confusion, and free up resources for the strategic work that drives growth.
Key takeaways
Reports earn their keep when they connect marketing activity to business outcomes, which is why conversion metrics sit at the centre of every strong report.
Nearly 40% of agencies credit transparency and proactive communication as the #1 driver of client retention, ahead of campaign performance at 31%.
Matching the report to the moment matters as much as the data inside it: a stakeholder heading into a board meeting needs a focused executive summary, not a 30-page deep dive.
Templates, custom metrics, goals, and annotations turn a static PDF into a living document clients can follow between meetings.
Automating data collection from 85+ sources keeps reports consistent and accurate, and gives your team the hours back.
Why digital marketing reports matter
A digital marketing report gives your agency the chance to be transparent about results, discuss areas for improvement, highlight wins, and reduce client churn through clear communication.
Based on the recent marketing agency benchmarking survey, nearly 40% of agencies credit transparency and proactive communication as the #1 driver of client retention.

Campaign performance follows closely at 31%. Good reporting lets you demonstrate both at once.
Consider this scenario. You’re in a client meeting and they ask why your agency is spending so much time building content around a particular keyword. You start by referencing the top keywords their customers are searching for. Next, you point to the keyword rankings report that shows the keyword history and how these rankings have improved over the last 3 months. Finally, you bring their attention to key Google Analytics 4 metrics, such as a line graph showing the increase in web traffic after implementing more targeted keywords, or the increase in organic-driven revenue.
Since most clients now use GA4, make sure your reports clearly show the shift in data structure and the metrics that replaced Universal Analytics, like event-based conversions and engagement rate.
Used well, a report explains how your marketing efforts affect your client’s online and offline bottom line. The goal is to use data storytelling and data blending to help clients visualise the results and key performance indicators (KPIs) you’re achieving.
The right report at the right moment
Modern reporting is about aligning reports with your client’s specific business goals and delivering them at the right time. A weekly report helps your team catch underperforming campaigns before they drain the budget. A monthly report gives clients a high-level view of performance across channels like Google Ads, SEO, and email. A quarterly report is your proof that the strategy is working, which helps you justify budget increases or pitch expanded services.
The wrong report at the wrong moment creates noise. A stakeholder preparing for a board meeting doesn’t need a 30-page report, just a focused executive summary. A general marketing report won’t help diagnose why engagement dropped on a key campaign. When you pair the right report with the right moment, clients see progress clearly and understand how their spend supports growth.
What to include in a digital marketing report
Maybe you already know the value of a great report, but the ones you’ve created in the past aren’t resonating. With so many metrics available, it’s difficult to know what belongs and what’s just noise.
Here are the key elements to include, in the order most clients want to read them.
1. Executive summary
The executive summary provides a concise overview of your key findings and performance metrics over the past month. The time frame varies from client to client, but most agencies report monthly. The goal is a snapshot of the campaign’s success and the areas that need work.

Keep it to a one-page overview covering major wins, challenges, and key insights. Include the marketing objectives set at the start of the campaign and how well each was met, along with any notable milestones. Add a brief analysis of the primary channels — social, email, SEO, PPC — to outline what each contributed, then go deeper in the sections that follow. A few quick metrics such as click-through rate, conversion rate, and ROI give busy stakeholders a clear picture at a glance.
Agency Tip: The executive summary should offer actionable insights and recommendations based on the data within the marketing report, aiming to guide future digital marketing strategies and improve overall results. Showcase your agency’s expertise and pitch new services you know your client will benefit from.
This is also the report you send to decision-makers who care about outcomes rather than platform-level detail. A general digital marketing report pulls data from every major channel and distils it into a narrative that makes sense, keeping the focus on ROI, momentum, and next steps.
When to use it: Monthly or quarterly
Key marketing metrics to include in a digital marketing report:
High-level campaign impact
Top-performing marketing channels
Overview of SEO, email, PPC, and social metrics
Key takeaways and priorities for next month or quarter
Comparisons to past periods or benchmarks

2. Website and analytics data
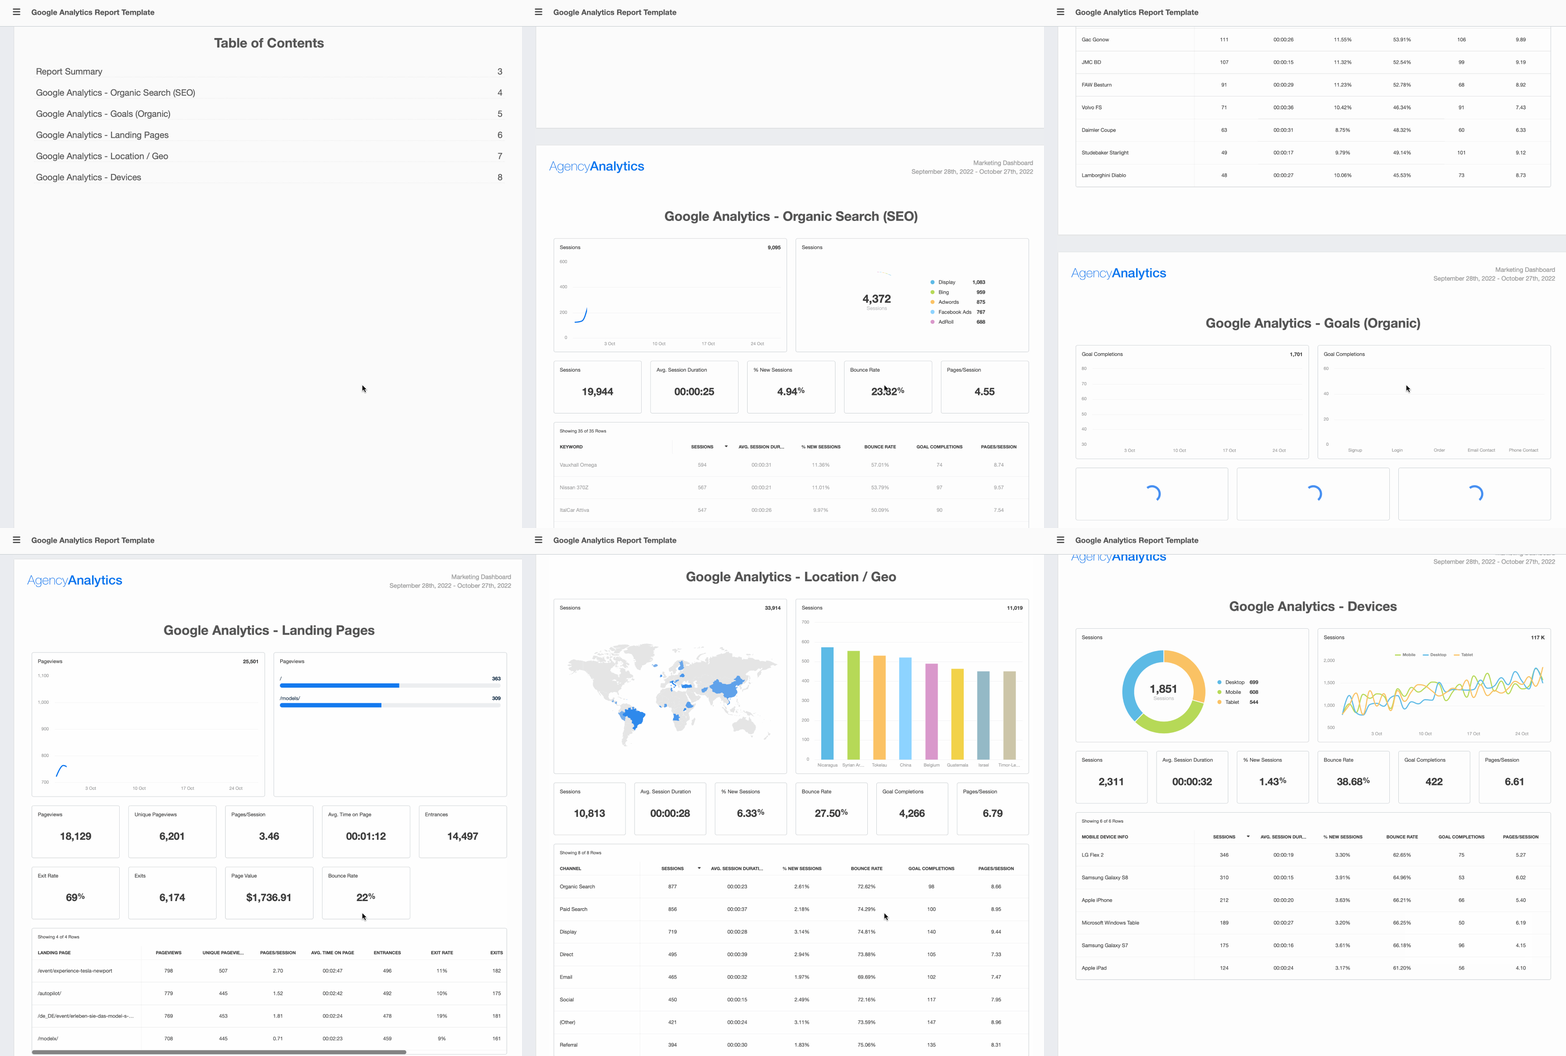
The first platform in your client report should be Google Analytics. Your client’s website is the central hub of every campaign, from SEO and paid search to email and social, so this section shows how the wider strategy has affected it.
With the shift to GA4, focus on engagement rate, new users, and average session duration rather than the old bounce rate model. Include visitor numbers for the last month and the channels they came from, so both you and the client can see where customers originate and which channels need attention.
A web analytics report goes further: it reveals what attracts traffic, what engages visitors, and what drives conversions. It’s the go-to report after a site launch, a landing page rollout, or a major content campaign. Use it to pinpoint which sources deliver quality traffic, which pages underperform, and where users drop out of the funnel. It helps clients understand the “why” behind website performance rather than only the “what”.
When to use it: Monthly or after significant site changes
What marketing metrics to include in a web analytics report:
Website traffic metrics (sessions, users, bounce rate)
Traffic sources (organic, direct, referral, paid)
Top-performing pages and conversion paths
Conversion paths and funnel drop-offs
Device, browser, and location breakdowns
Insights from Google Analytics and Google Search Console
3. Conversion metrics
Conversion metrics are the centrepiece of any marketing report because they tie your work directly to your client’s revenue. Seeing a set of numbers from their agency is one thing. Understanding how those numbers turn into sales is another.
Avoid reporting vanity metrics (clicks, likes, and email opens) that are hollow digits contributing little substance to proving your marketing efforts are making them money.
Kim Meissenheimer, Ads Specialist at Expand Agency
This is the place for granular detail: session duration, bounce rate, and total goal completions or conversions. These metrics help executives and other stakeholders see exactly how your work translates into measurable ROI. Break the data down by channel so everyone can see which one performs best.
For example, if their social media analytics show a low conversion rate while email campaigns convert well, that gap points to a fix. Look at the email copy and apply the same language or positioning to their social posts, or A/B test different call-to-action buttons. That’s how reporting turns into data-driven marketing strategies.
The marketing reporting tool pulls conversion data from Google Analytics and displays traffic from multiple sources, so you and your clients get an instant overview of what’s resonating with customers.
4. SEO rankings
After conversions, SEO performance helps clients understand their visibility and long-term growth opportunities. Your agency understands why search engine optimisation is integral to most campaigns, but your clients may not.
An SEO report should track any changes in your client’s organic rankings on platforms like Google and Bing. If they’ve dropped a couple of spots on the SERP, that’s your signal to adjust the content strategy. If you’re reporting on multiple campaigns or regions, include local pack results and keyword intent grouping to show deeper insight into search behaviour.
Show clients how they rank for keywords in their industry and how they stack up against competitors. It’s also a natural opening to pitch additional services such as a technical SEO audit. Use an SEO audit tool to identify and report on the top issues hurting your client’s growth.
If your agency specialises in SEO, use the dedicated SEO report template and built-in marketing analytics tools to report on all of a client’s critical SEO KPIs.

5. Content performance
A content marketing report gives credit where it’s due by tying blogs, landing pages, and lead magnets to outcomes like SEO improvements, lead generation, and pipeline impact.
Use it to show clients which pieces are ranking, which content drives conversions, and where the gaps are worth filling. It’s especially useful for agencies managing SEO-driven content strategies, content hubs, or clients investing heavily in long-form or gated assets.
When to use it: Monthly or campaign-based
What to include in a content marketing report:
Traffic performance by content type or asset
Keyword rankings tied to content
Time on page, engagement, and exit rate
Content-driven conversions or leads
Backlinks, social shares, and referral sources
Opportunities for new content or updates

6. Social media data
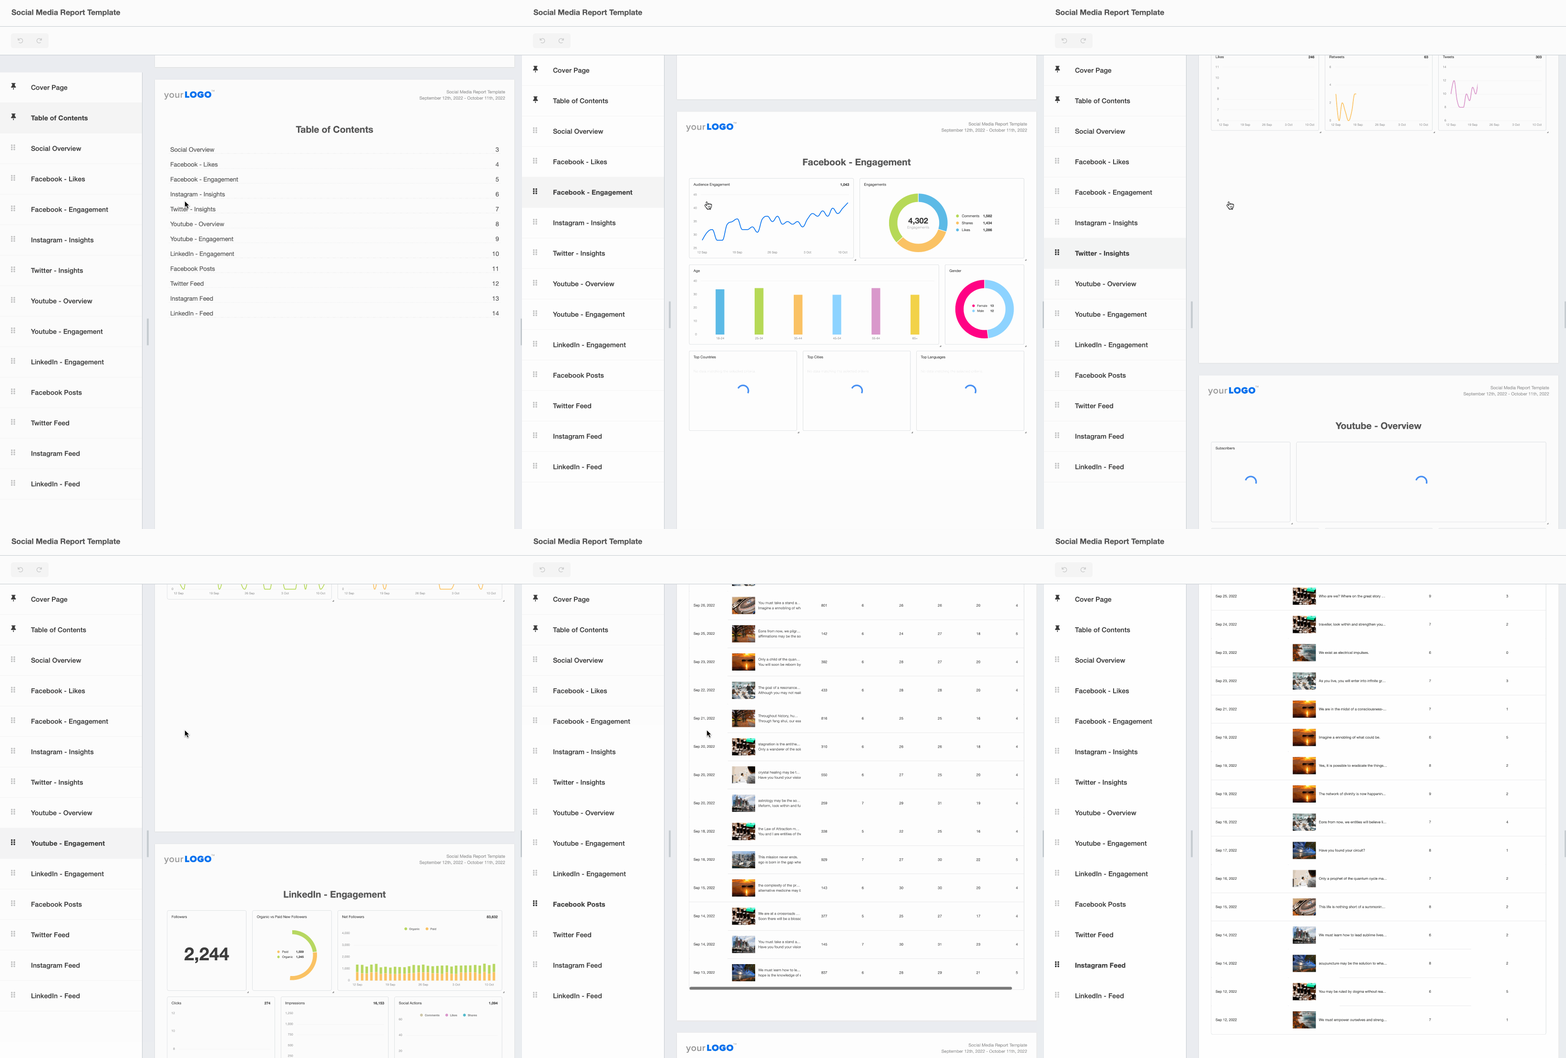
Use the top social media KPIs to prove the campaigns you’re running are producing results. Focus on engagement quality over vanity metrics: click-through rate, audience growth, and sentiment trends across channels.
Highlight cross-platform metrics such as engagement, impressions, and followers for each account. A brief overview of each platform helps clients see which ones reach the most people and how those people are engaging. Follower growth affects your client’s credibility and reach, so show how your agency is broadening their audience.
Manually updating spreadsheets to track follower growth across multiple accounts for every client becomes a pain quickly. An automated social media analytics dashboard saves the time and lets you focus on results. Use those insights to improve cohesion between organic and paid efforts.
Agency Tip: Include top-performing posts and customer testimonials in this section of your digital marketing report to highlight what customers are saying about your client’s business online. This gives them insights into what they can take ownership of offline like improving customer service practices, for example.
7. PPC update
Paid search and paid social move quickly. Budgets shift, audiences change, and platforms like Google Ads, Bing Ads, and LinkedIn Ads update constantly. A PPC marketing report makes performance transparent by tying ad spend directly to conversions, ROAS, and cost efficiency.
Include performance metrics such as clicks, impressions, click-through rate (CTR), conversion rate, and cost per click (CPC) on a monthly basis, plus an overview of the campaign’s objectives and achievements against the client’s wider strategy.
Instead of listing clicks and impressions, turn ad performance into something actionable: which campaigns are hitting KPIs, which audiences are converting, and what changes are on deck. Use charts and graphs so clients understand the budget allocation and pacing for each platform, and flag any budget changes and why you made them. Compare current benchmarks to previous periods so clients know whether they’re getting a healthy return.
Digital marketing reports help clients see their ROI and they feel confident in their marketing spend. This ultimately helps their business grow because they continue to advertise.
Janeene High, CEO, Results Driven Marketing
AI-powered insights help you spot optimisation opportunities faster.
When to use it: Weekly or monthly
What marketing metrics to include in a PPC marketing report:
Ad spend and Cost-Per-Click breakdown
Campaign-level and ad group performance
Keyword, audience, and device performance
Insights into paid search and paid social trends
Agency Tip: Offer recommendations based on the data, outlining actionable marketing insights to enhance the PPC campaign’s effectiveness, reach, and return on investment (ROI) for the client.

8. Email marketing overview
Email is often the quiet workhorse of digital marketing. It drives revenue, nurtures leads, and supports retention.
Start with how many people are reading and opening the emails, then go deeper. What do customers do once they open? Are they clicking the call to action? Do they convert or book appointments? What is the email unsubscribe rate?
Use integrations with HubSpot or Mailchimp to merge email analytics with the wider report, connecting behaviour from email through to landing page performance. That data loop shows how inbound efforts drive conversion and retention.
An email marketing report proves the impact of every subject line, automation, and A/B test by tying engagement metrics to conversions. It’s especially useful for abandoned cart workflows and product launches, where behaviour shifts fast, and for clients who need proof that their list isn’t just growing but actually converting. Those metrics also surface direct customer feedback: maybe there’s a product or service customers click on more than others, which is information your client will want.
When to use it: Campaign-based or monthly
What marketing metrics to include in an email report:
Conversions and revenue from emails
Segmentation and engagement breakdown
Insights from A/B tests and subject line experiments
Email performance across devices and time periods

9. Ecommerce revenue
Ecommerce clients need visibility into how each channel contributes to revenue, average order value, and customer retention. An ecommerce marketing report pulls performance data across email, PPC, social, SEO, and influencer campaigns to show what’s driving sales, repeat purchases, and customer lifetime value.
It goes beyond tracking product sales. It shows which campaigns are paying off, where customers drop off, and what needs to change — the clarity to move fast on seasonal offers or new ad creative.
When to use it: Weekly or monthly
What to include in an ecommerce marketing report:
Revenue by channel (organic, email, PPC, social)
CPA, ROAS, and blended CAC
Conversion rates by campaign
Cart abandonment insights
Product-level performance
Customer Lifetime Value and repeat purchase rates
Build custom metrics around specific KPIs
Take your data visualisation further with custom metrics that combine a client’s marketing data with other campaign metrics. Instead of disjointed reports — calls from a call-tracking report, traffic from web analytics, form submissions from HubSpot — paint a combined picture that shows why these metrics matter against their bigger goals. Custom reporting also brings KPIs from multiple campaigns together, combining SEO, social, and PPC data into one view.
For example, overall LinkedIn impressions is interesting to note but fails to illustrate the larger picture. To add depth to a social media report, combine total ad spend across all social platforms and divide by total conversions across those platforms for a blended cost per acquisition.
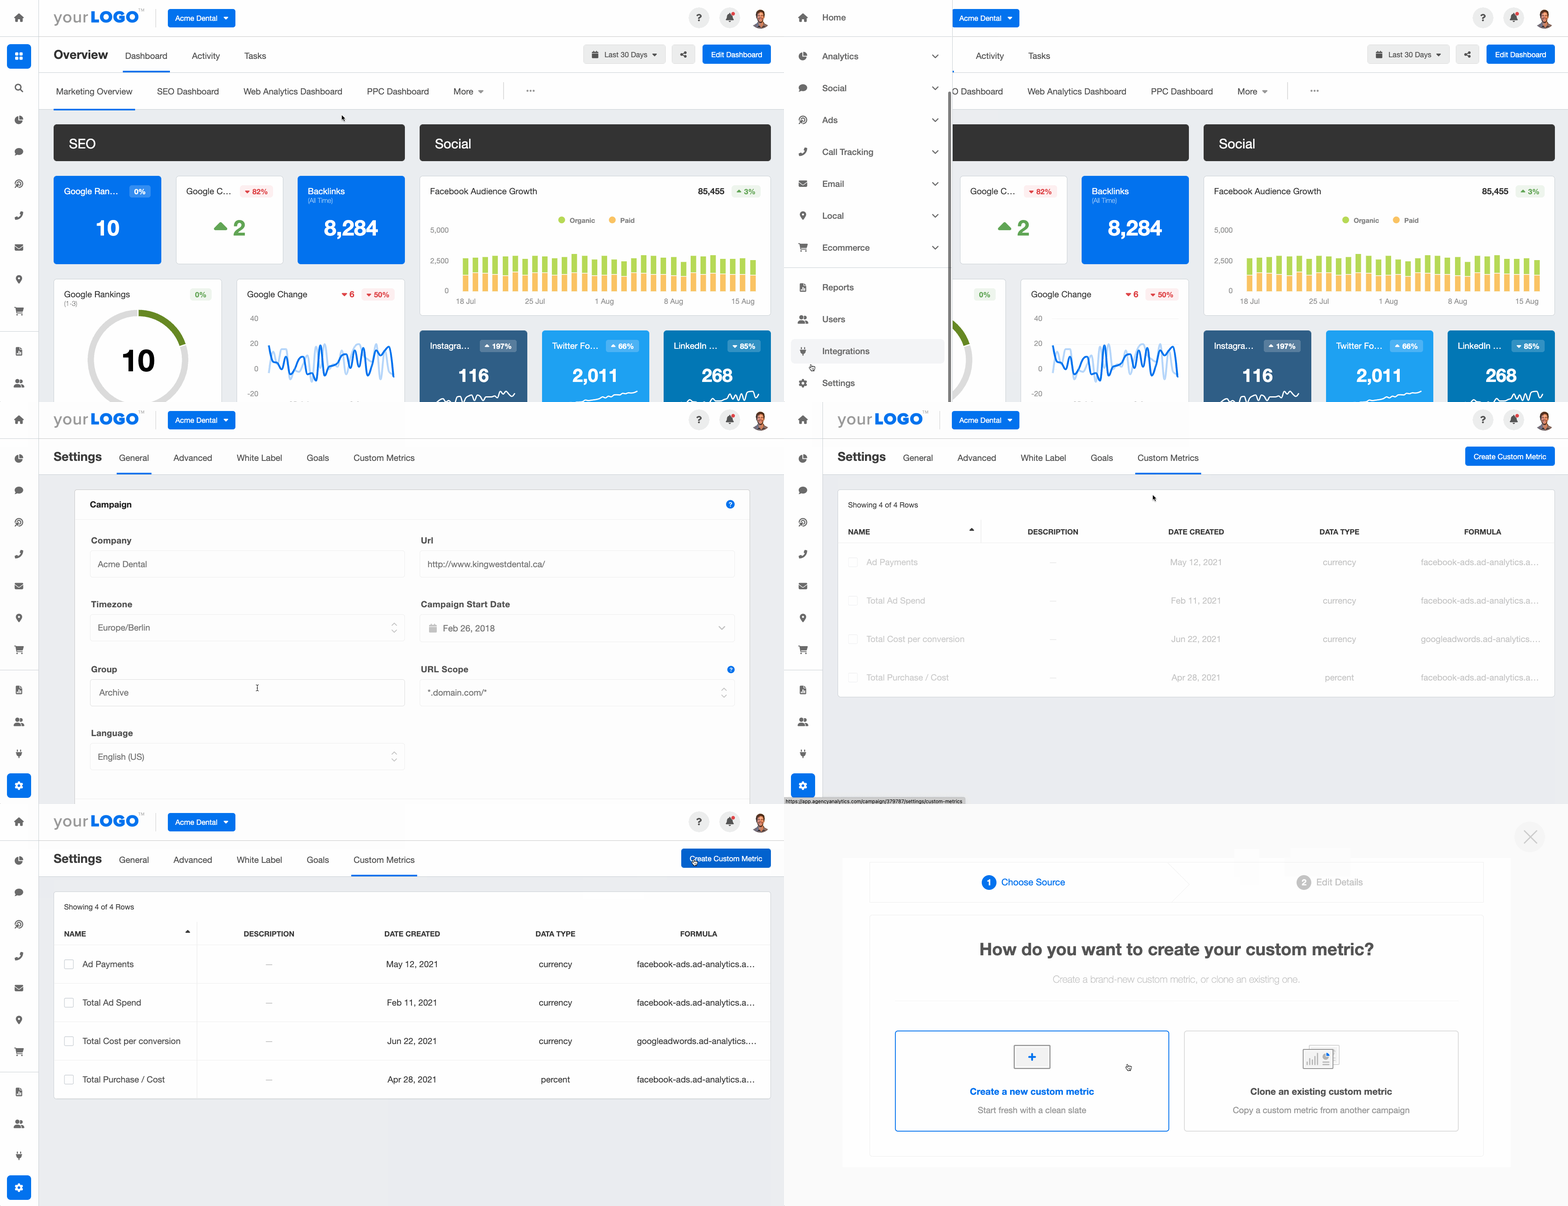
Use custom metrics to tell a unique story with each clients’ marketing data. Get started today with your 14-day free trial.
Communicate progress with goals and annotations
The best reports are living documents, not a stationary list of data points. Using goals and annotations in your client reports gives clients a visual read on progress toward pre-determined KPIs, and annotations explain the why behind results without technical jargon.

Digital marketing dashboards display data in real time
A live digital marketing dashboard gives clients and internal staff an up-to-date snapshot of how a project is progressing. Dashboards sync automatically with all your KPIs, so both sides have current visibility across SEO, PPC, and social. On-demand access creates transparency in the relationship and increases accountability for teams tracking progress toward KPIs.
If you have clients who like to check in frequently, give them their own custom login. Granular user permissions keep you in control of exactly what each client can access.
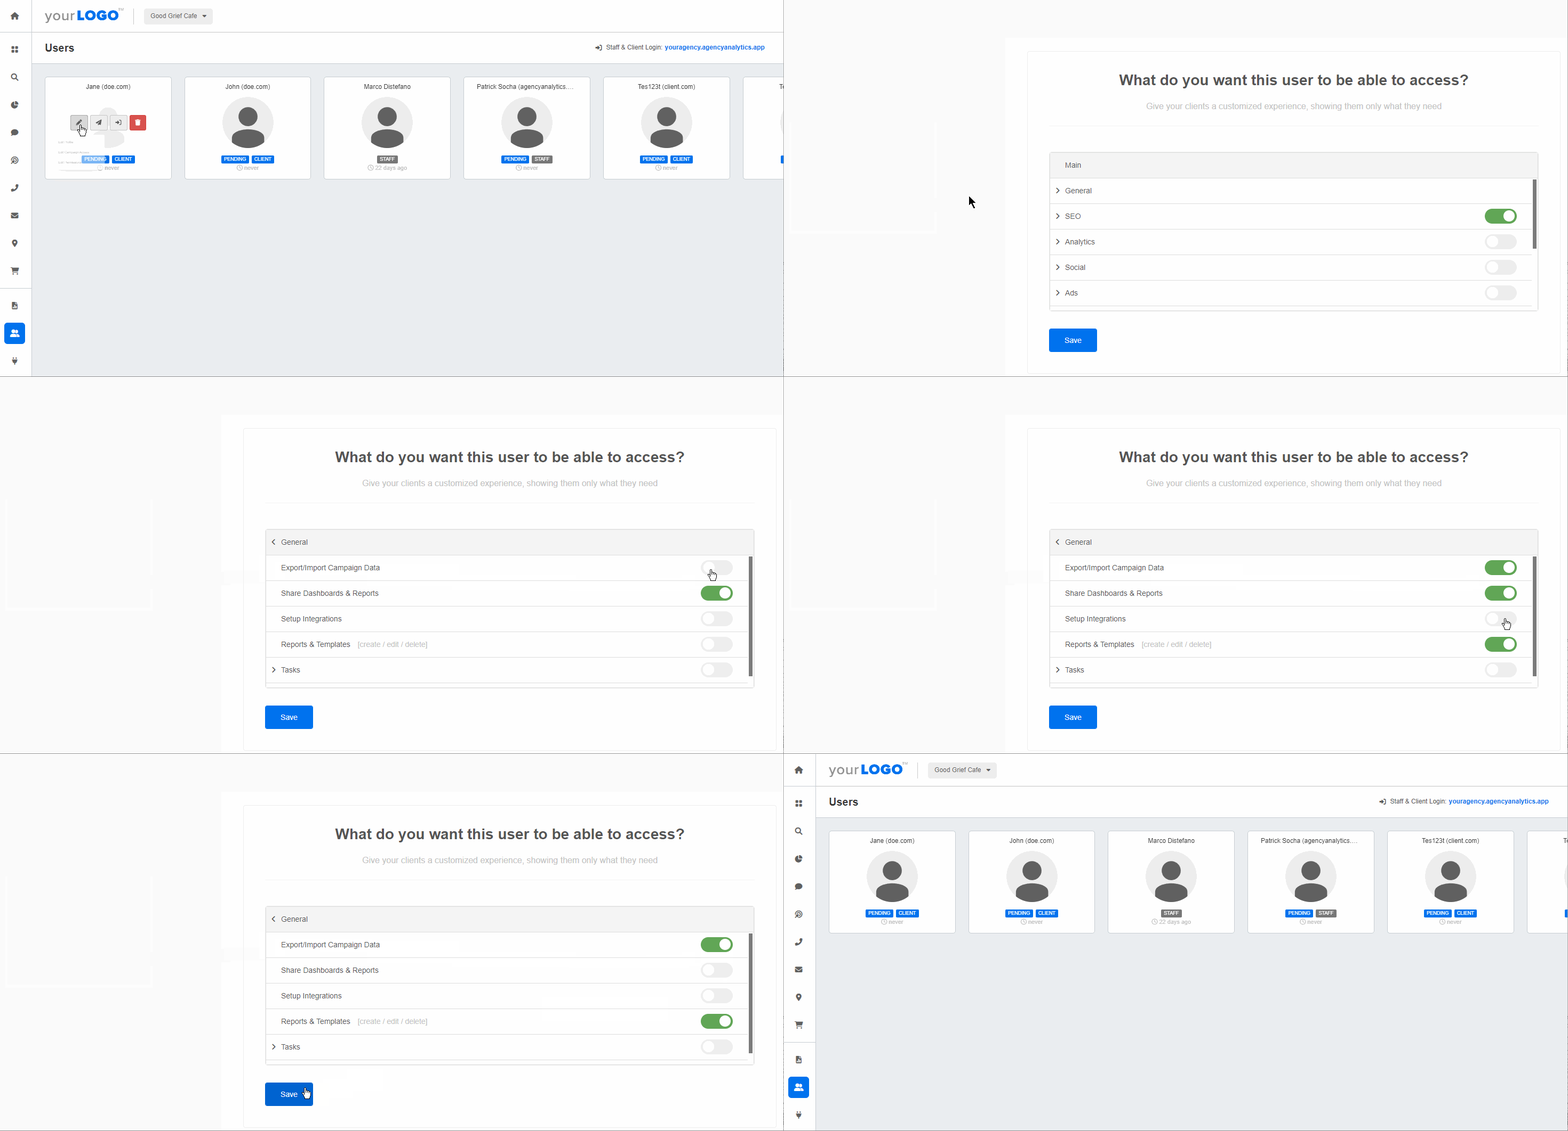
That kind of centralised visibility matters most for agencies managing multiple campaigns or large teams.
With custom dashboards, we’ve successfully consolidated the data we want to see for every client, easily identifying potential issues with their campaigns. This centralized approach saves us valuable time and empowers us to proactively address and flag any concerns, fostering a proactive and efficient workflow.
Alexa Rees, SEO Manager at seoplus+
Reports and dashboards also improve your agency’s internal communication and keep everyone on the same page.
Other reports to keep in your toolkit
The nine elements above cover the core monthly report. These formats handle the moments that fall outside it.
Client report
The client report is your single source of truth for multi-channel performance. It combines your specialised reports (SEO, PPC, email, social) into one digestible format tailored to the client’s goals, highlighting what matters and filtering out the noise. It’s also the most widely shared document inside client organisations, which makes clarity essential.
When to use it: Monthly or campaign-based
What to include in a client report:
High-level summary of campaign performance
KPI breakdown by channel
Wins, challenges, and next steps
Data visualisation (charts, graphs, comparisons)
Narrative insights written in plain language
White labeled report formatting for client-facing polish

Quarterly business review
Quarterly business review reports zoom out to show how performance tracks against broader strategic goals. Treat them as a reset point where you step back from day-to-day metrics to look at how far you’ve come and where you’re headed.
When to use it: Every three months
What to include:
Marketing performance summaries
Key wins and challenges
Department-level updates
New initiatives, experiments, or tools
Goals for the next 90 days
Annual marketing agency report
An annual report wraps 12 months of work into a single narrative showing progress, momentum, and results. It gives clients a view of how their spend contributed to market share growth, customer retention, and business outcomes, and prepares them to set budgets, shift priorities, or expand services next year.
When to use it: End of calendar or fiscal year
What to include:
Summary of yearly marketing activities
Year-over-year performance comparisons
Channel-by-channel performance summaries
Budget utilization and ROI analysis on marketing investments
Strategy recommendations for the next year
Ad hoc report
Some moments demand immediate insight: a spike in traffic, a drop in conversions, a PR event, or a shift in paid search performance. An ad hoc report lets your team respond quickly with focused data pulled from multiple sources. It’s useful for diagnosing anomalies and showing clients you have eyes on the situation.
When to use it: As needed, typically outside the regular reporting cadence
What to include:
Context: what triggered the report
Focused performance snapshot
Key insights and implications
Recommended actions
Optional comparison to baseline or past periods
Performance benchmark report
A performance benchmark report compares your client’s results against industry averages, competitor performance, or your agency’s internal portfolio benchmarks. It shows whether a campaign is performing above expectations and where competitive gaps exist, which makes it one of the most persuasive formats when you’re justifying budget allocation, proposing new services, or reframing expectations around KPIs.
When to use it: Quarterly, annually, or during audits and proposals
What to include:
Snapshot of current marketing performance
Industry, competitor, or internal benchmark data
Strengths and areas for improvement
Gap analysis tied to business goals
Clear strategic recommendations and next steps

Want to instantly see how your clients’ campaigns stack up against industry benchmarks? Use AgencyAnalytics’ insights feature to access real-time performance comparisons and deliver smarter, data-backed recommendations.
Client proposal
A proposal sets the tone for the whole relationship. Whether it’s an SEO proposal, social media management proposal, PPC proposal, web design proposal, or a full-service digital marketing proposal, it’s your first chance to show you understand the client’s business. Cover their goals and pain points, recommended services and timelines, scope and pricing, expected results and KPIs, and case studies or past report examples — that’s what moves the conversation from cost to value before a contract is signed.

Related reads:
Internal reports that keep your agency running
Client reports shape how clients see your agency. Internal reports shape how your agency runs.
Operational report
Operational reports are the agency equivalent of a health check. They show how projects are progressing, where capacity is stretched, and which internal processes need attention.
When to use it: Weekly or monthly
Important metrics to include:
Project timelines and current status
Resource allocation and team capacity
Workflow or efficiency metrics
Platform/tool usage
Departmental highlights, risks, or blockers
Financial report
Financial reports track revenue, expenses, profit margins, and overall financial health, and inform decisions about hiring, pricing, client retention, and investment in new tools or services. This is your internal scoreboard.
When to use it: Monthly or quarterly
Important metrics to include:
Revenue by client, project, or service
Expenses (tools, labor, overhead)
Profit and loss summaries
Forecasts and cash flow projections
Budget vs. actual spend
Progress report
Whether it’s a rebrand, a website launch, or a major paid campaign, progress reports track milestones and flag issues early. They work internally and also keep clients updated on non-recurring or complex projects.
When to use it: Project-based, bi-weekly or monthly
What to include:
Current status of key deliverables
Completed and pending tasks
Blockers and risks
Updated timelines and ETAs
Resource needs
Team performance report
As your agency scales, a team performance report helps managers track output, identify high performers, and spot where training, support, or resource reallocation is needed. Roll-Up Reports and Dashboards deepen this visibility by aggregating client and campaign data across teams, giving a unified view of workload, performance trends, and capacity without pulling dozens of separate reports.
When to use it: Monthly, quarterly, or on-demand using live dashboards
What to include:
Task or project completion rates by team or individual
Billable vs. non-billable hours (if tracked)
Workload distribution
Client satisfaction or internal feedback
Performance trends over time
Incident report
Things go wrong. An incident report documents what happened, what was impacted, and how you’ll prevent it in future. Whether it’s a reporting error, a campaign misfire, or a communication issue, handling it well earns trust from your team and your clients.
When to use it: As needed
What to include:
What happened and when
Who was involved or impacted
Root cause analysis
Corrective action steps
Follow-up or resolution timeline
Streamline reporting with digital marketing report templates
Since the key to growing your agency is reducing inefficiencies and eliminating repeatable tasks, moving out of manual reporting is an excellent place to start. 90% of employees feel burdened with repetitive, boring tasks that can easily be automated.
Using a monthly marketing report template or a digital marketing report template automates the repetitive work and gives your team more time for strategy and client communication. Set-up takes some customisation up front, but once you’ve built your template, adapting it for other clients is straightforward.
Create a master report template that lays out the specific metrics you want to report on for each type of campaign/instance first and foremost so your reporting is uniform across clients. This also saves your agency time because you aren’t starting from zero each time.
Molly Lopez, Founder & CEO, Sparo
Templates include automation for scheduled delivery and data blending from multiple sources using custom metrics. Don’t forget white labeling: every time clients receive a report with your branding on it, they associate their results with your agency.
How often should you send digital marketing reports?
Now that your client reporting template is set up, how often should it go out? Even the best reports lose value if they aren’t delivered consistently. There isn’t a one-size-fits-all answer, but most agencies report monthly.

That’s not a hard rule. If your client has long-term goals that require building up their SEO, less frequent reports may suit. If you’re running short-term campaigns with immediate results in mind, more frequent updates — even a daily report — showcase wins as they happen.
Other factors to consider:
Industry and seasonality: If your client’s business operates during a specific season, they may need more frequent reporting during peak times.
Campaign complexity: An intricate campaign across multiple channels requires more comprehensive analysis, which affects cadence.
Client preferences: Some clients prefer a weekly analytics report, others are content with monthly reporting.
Talk to your clients and align frequency with their needs. Regular communication and feedback make sure the cadence meets the client’s expectations.
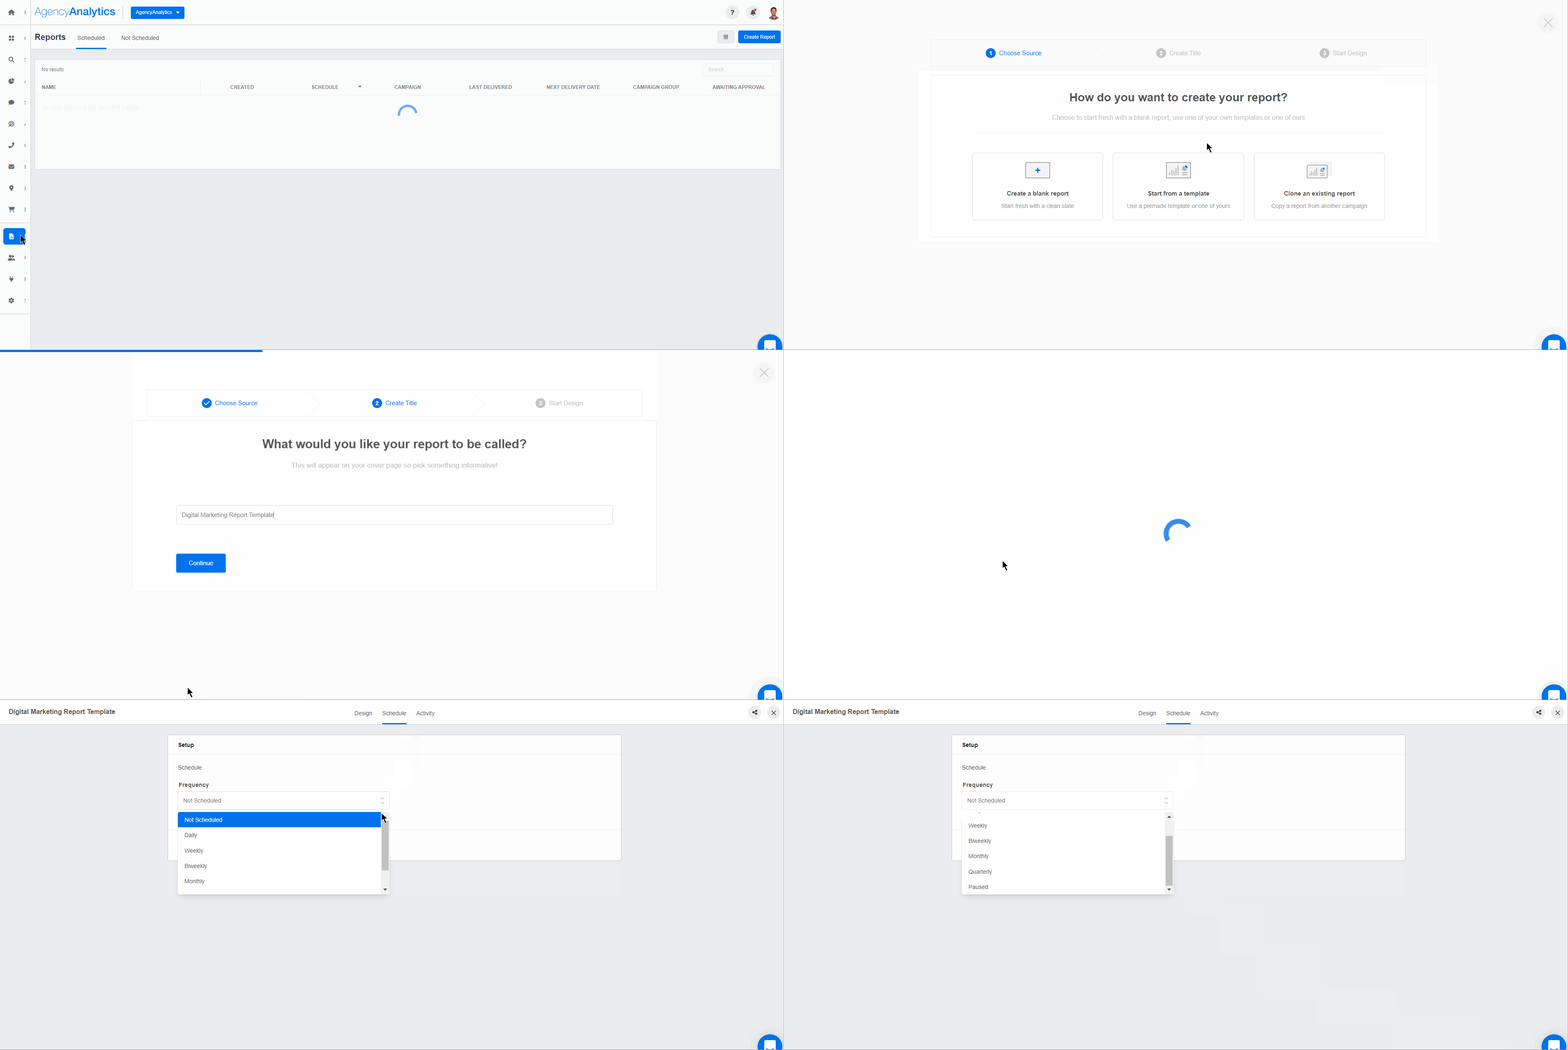
The goal is the right level of visibility for each client, not the maximum volume of data.
Schedule weekly reports (or bi-weekly, monthly, and quarterly reports) to keep your clients informed on campaign performance. Get started with your 14-day free trial.
How to gather data for your digital marketing reports
Manually gathering data from multiple sources is resource-intensive, error-prone, and drains hours every week. When a client calls with a question about their strategy, you want your team to answer quickly and get back to billable work.
Automating data collection from 85+ sources keeps your reports consistent and accurate across all campaigns. Automated marketing reports centralise data from SEO, PPC, social, email, and more into real-time, client-ready reports in a few clicks.
What automation looks like in practice:
Your monthly reports build themselves, with no Monday morning scramble.
Stakeholders get campaign updates automatically, exactly when they expect them.
Your report always includes real-time data that updates as campaigns evolve.
Instead of chasing metrics, your team spends time turning insights into results.
With AgencyAnalytics, we were able to centralize all the data in one place, enabling us to easily track and analyze campaign results across different channels.
Jessica Crist, Production Manager at High Five Media
Make the switch to AgencyAnalytics and start compiling in-depth, custom-built, white labeled reports today. Join over 7,000 growing agencies who trust the platform to deliver reliable results to their clients every month.

With AgencyAnalytics, you’ll:
Create effective marketing reports in 11 seconds.
Use popular marketing report templates to launch quicker and customise later.
Apply white labeling to make every report feel like your own.
Set automated schedules for weekly, monthly, or quarterly reports.
Share live dashboards so clients can track progress anytime.
Make the most of your free trial by connecting all of your clients’ campaign metrics in one place. With over 85 marketing integrations, your team doesn’t have to spend time on manual reporting. Fully customisable widgets highlight each client’s specific data, and the drag-and-drop report builder keeps the process simple to start.
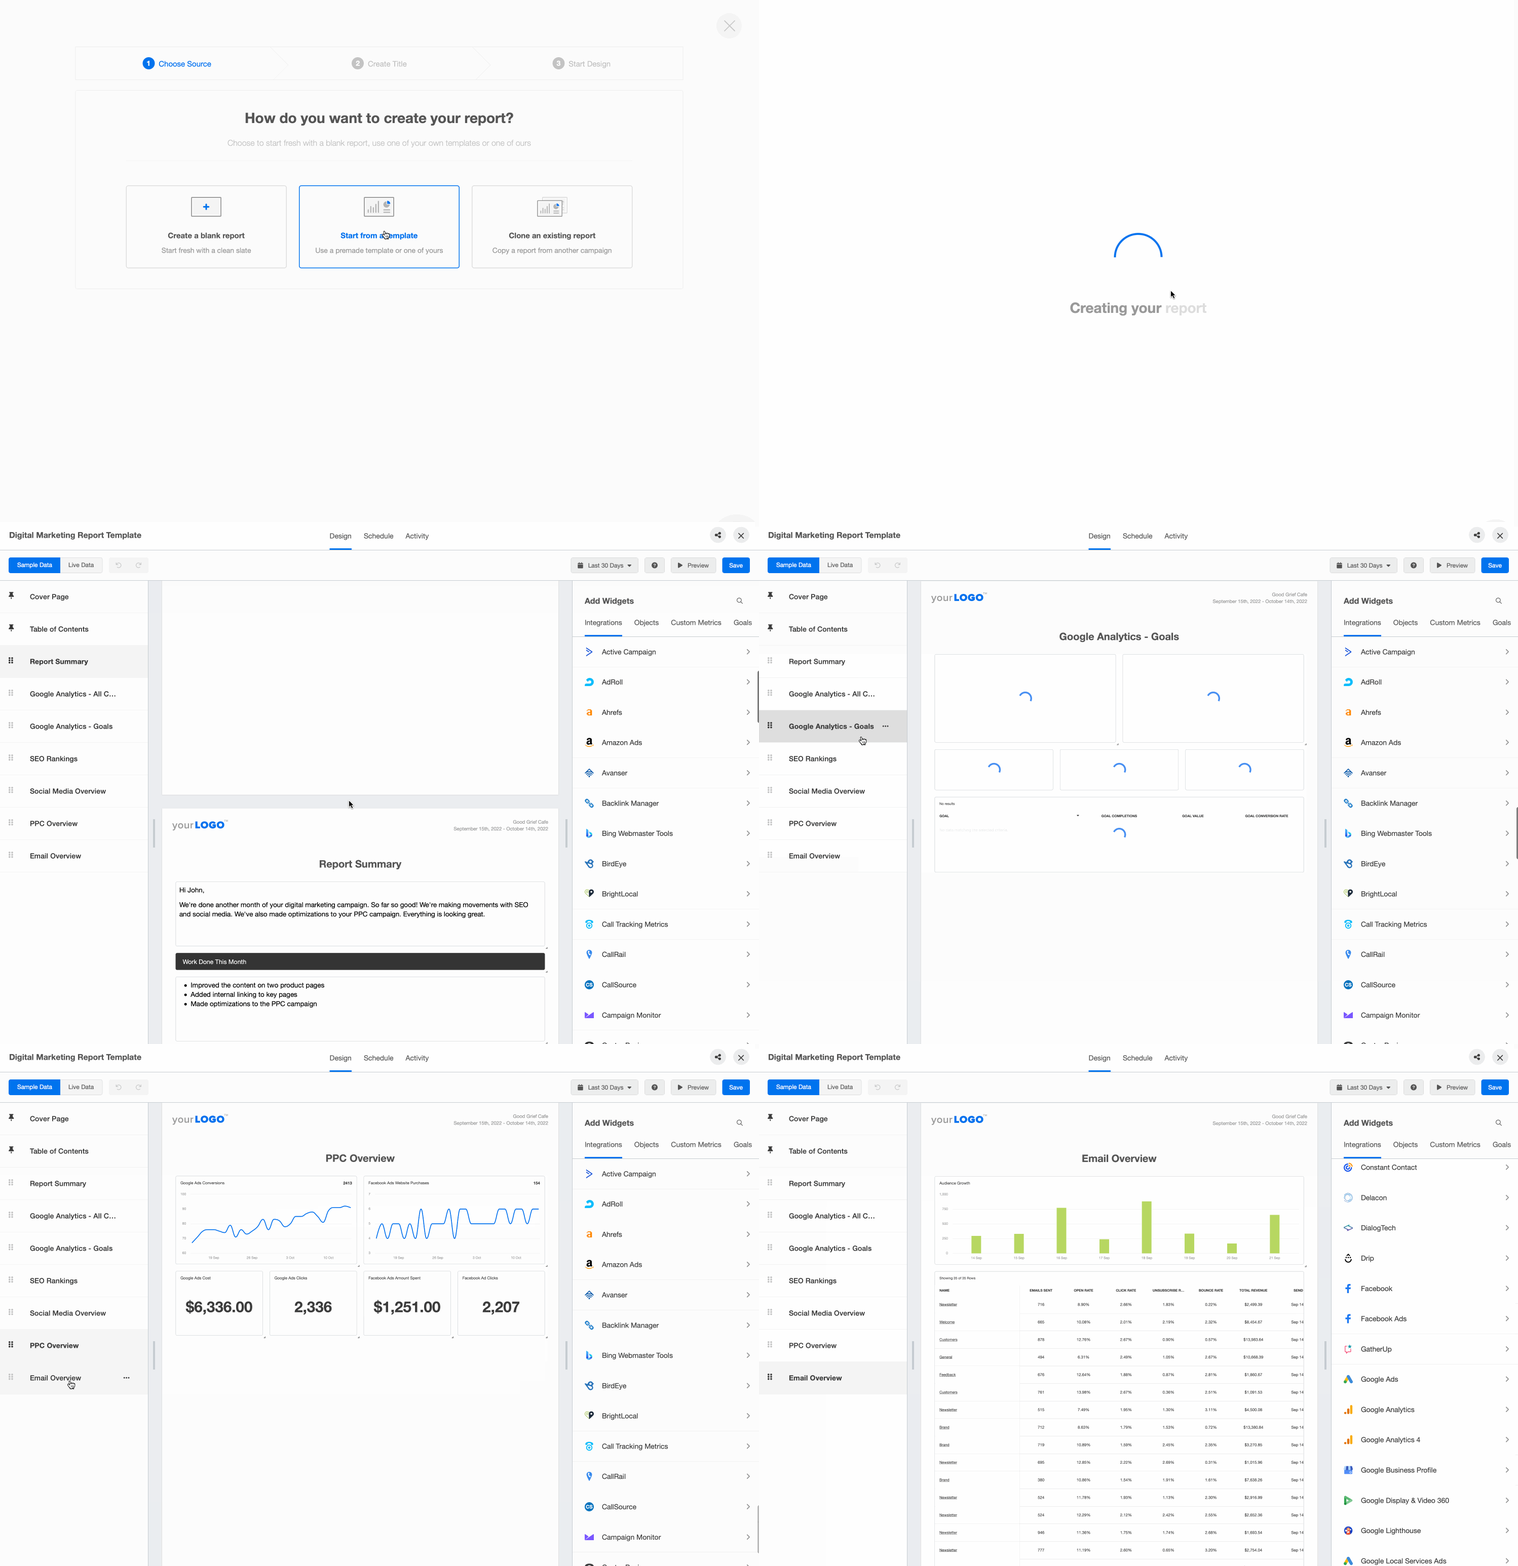
Automation isn’t about removing the human touch. It removes the bottlenecks that slow your agency down, including the option to automate PPC reporting while keeping room for commentary and insight.
The takeaway
Creating digital marketing reports for your clients is essential to helping their businesses thrive. By focusing on clear objectives, the client’s priority OKRs and KPIs, data-driven insights, and actionable recommendations, your agency presents a narrative that shows the value of your work and drives better decisions. Visualisations and concise language make those reports accessible, which makes it easier for clients to grasp complex data and act on it.
Building a thoughtful reporting process pays off quickly. It saves time, drives better decisions, and gives clients more confidence in your expertise.
With fully automated reports and custom dashboards, you have everything you need to save time, impress clients, and scale your marketing agency. Try AgencyAnalytics risk-free for 14 days.
Impress clients and save hours with custom, automated reporting.
Join 7,000+ agencies that create reports in under 30 minutes per client using AgencyAnalytics. Get started for free. No credit card required.

Already have an account?
Log inYour Digital Marketing Reporting Questions, Answered
Practical insights to help agencies deliver client-ready digital marketing reports that drive clarity, strategy, and retention.
A strong monthly marketing report template should combine all your KPIs in one easy-to-understand format. Include traffic sources, conversion rates, click-through rate (CTR), and social media performance across multiple campaigns. Use visuals to highlight key insights and focus on progress since the previous period. A great report doesn’t overwhelm clients—it connects metrics to outcomes and shows how your marketing efforts support their overall campaign performance and long-term business goals.
Avoid technical jargon and focus on storytelling. Translate raw data into insights by grouping metrics by marketing channel—SEO reports, social media channels, PPC campaigns, and email marketing. Add short annotations explaining why metrics changed. Present results in a visually appealing layout that helps clients measure progress at a quick glance.
When clients can connect the dots between your data and their goals, you build lasting trust and retention.
Most agencies send monthly reports, but frequency depends on campaign complexity and client preference. Weekly reports work best for active ad campaigns or when C-level executives need near real-time data to make informed decisions. For SEO or inbound marketing strategies, monthly or quarterly reports are ideal. The key is consistency—clients should always know when to expect updates and what new insights they’ll get each time.
Custom reporting allows your agency to combine data from multiple sources—like Google Analytics, Google Ads, email automation tools, and paid ad platforms—into a comprehensive overview. Use cross-channel integrations to show the full customer journey, from click to conversion. A single platform like AgencyAnalytics keeps all your KPIs in one place, providing a clear performance overview without jumping between tools.
A well-structured report highlights where campaigns perform best and where optimizations will deliver higher ROI. Compare cost per click (CPC), average CTR, and conversion rates across various channels to identify areas for improvement. Include notes on landing pages and user behavior for deeper insights. When clients see exactly how your strategy increases traffic, conversions, and engagement, they’re more likely to increase spend and continue partnerships.
Digital marketing reports connect the marketing team, sales team, and other departments with a shared view of campaign performance. When everyone—from content creators to C-level executives—works from the same data, collaboration becomes effortless.
Reports clarify who’s driving results, which campaigns are performing, and where to focus next. By sharing a performance overview in an easy-to-understand format, your agency helps different stakeholders make better decisions faster.
The outcome? Better coordination across departments, more consistent messaging, and a unified strategy that supports your clients’ global marketing goals.
A digital marketing report provides a big picture view of how each channel contributes to overall results. By tracking key metrics such as average session duration, average CTR, and conversion rates across various campaigns, agencies can dig deeper into the data and identify areas that need optimization. Maybe one landing page isn’t converting or a specific ad campaign isn’t driving enough traffic.
Regular analysis of historical data and trends makes it easier to fine-tune your marketing strategy, helping clients get more value and higher ROI from every channel.
Ad hoc reports give agencies flexibility when clients need quick insights outside the regular reporting cycle. For instance, a managing director may want to review how a new product launch performed across social media channels and PPC campaigns without waiting for the next monthly report.
Custom reports let you pull the right metrics on demand—like traffic sources, click-through rates, and conversions—using one platform. This responsiveness builds trust, keeps clients informed, and demonstrates your agency’s ability to adapt and act quickly when results matter most.
Reports aren’t just for showing results—they’re powerful tools for growth. A well-structured performance report helps your agency uncover opportunities to generate leads, increase conversions, and drive more money from existing campaigns.
By reviewing data from multiple sources—social channels, PPC campaigns, and SEO reports—you gain more insights into what’s working and where to optimize. When clients see clear proof that your strategies produce measurable ROI, they’ll invest more confidently in their marketing partnership, ensuring both sides see long-term success.
Richelle Peace is a writer with a degree in Journalism who focuses on web content, blog posts, and social media. She enjoys learning about different topics and sharing that knowledge with others. When she isn’t writing, Richelle spends time teaching yoga, where she combines mindfulness, movement, and her passion for wellness.
Read more posts by Richelle PeaceWhat other agency experts are reading

KPI reporting examples, templates & how-to guide
Learn how to create effective KPI reports in 2025 with templates, examples, and best practices for every KPI reporting scenario.

Dashboard vs. Report: Which Is Better For Clients?
Both dashboards and reports deliver valuable information to clients, but they differ in their approach, format, and functionalities. Here’s how to choose the best option.

Marketing report examples: 8 client-ready reports to show performance & ROI
Discover eight marketing report examples with the KPIs, sections, and best practices agencies use to show ROI, explain results, and automate client reporting.